


Key Points:
- After extending its bearish trend, the GBP/USD pair has entered a consolidation phase, with the potential for a short-term bullish correction to collect buy-side liquidity;
- A stabilization above $1.3672 could open the path toward $1.3696; otherwise, the scenario of continued selling pressure will be strengthened;
- On lower timeframes, CVD divergence and the two-sided liquidity structure have increased the probability of a ChoCH and a move toward the FVG;
- From a fundamental analysis perspective, the vote of four Bank of England members in favor of a rate cut increases the risk of pound weakness;
- The relative strength of the US Dollar Index and the upcoming CPI and PMI data may determine the medium-term direction of GBP/USD.
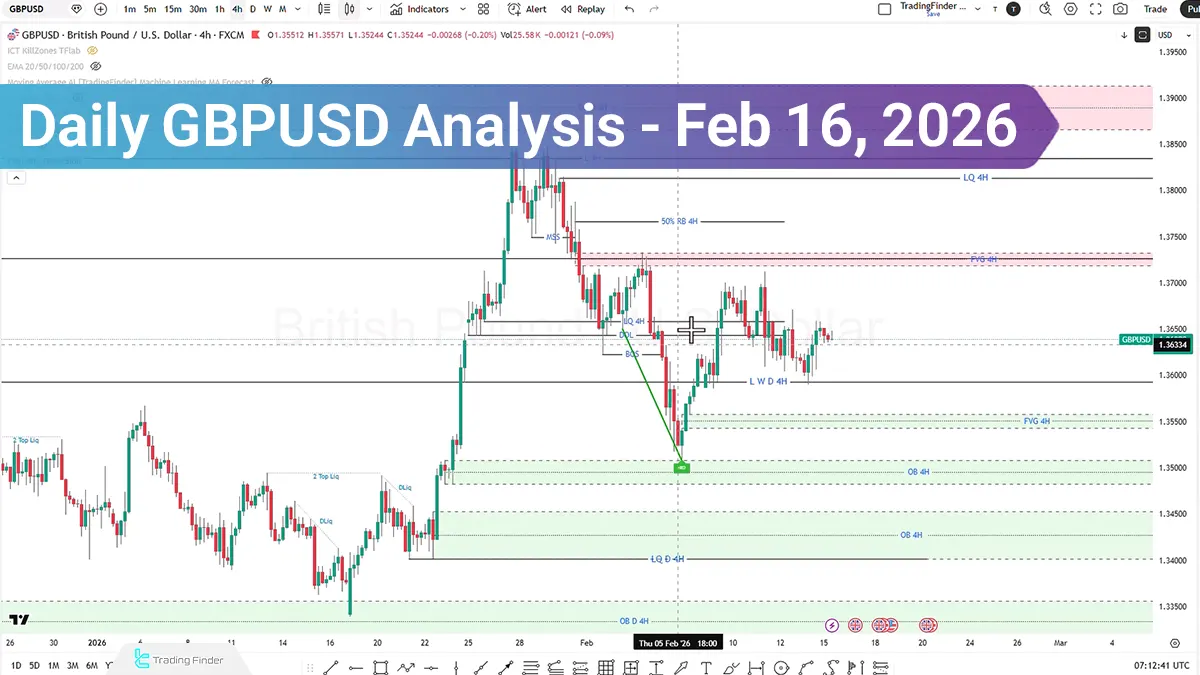
The GBP/USD pair continued its bearish trend in line with the previous scenario.
The current market structure indicates the possibility of a short-term bullish correction to collect Buy Side Liquidity; however, the relative strength of the US dollar may prevent the formation of a sustainable bullish trend.
Upcoming inflation data and the Purchasing Managers’ Index (PMI) will also play a key role in determining the final direction.
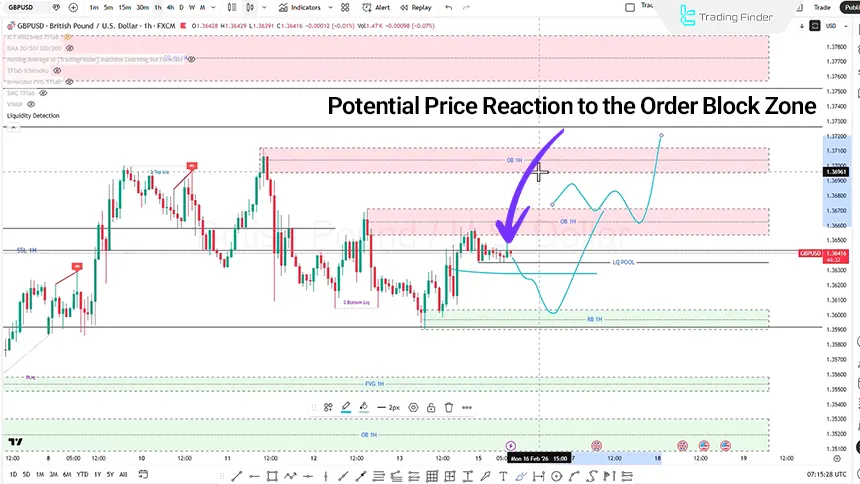
Daily Analysis of GBP/USD on the 1-Hour (H1) Timeframe
On the 1-hour timeframe, price has reacted to the Order Block zone, and liquidity structure has formed on both the buy and sell sides. After the collection of buy-side liquidity, signs of increasing selling pressure are observed as follows:
- Price registers a valid candle above the Order Block zone at the $1.3672 level;
- There is a possibility of continued upward movement toward the next Order Block zone at $1.3696.
In this case, the market may enter a deeper corrective phase. Along this path, the Draw on Liquidity structure may attract price toward lower levels.
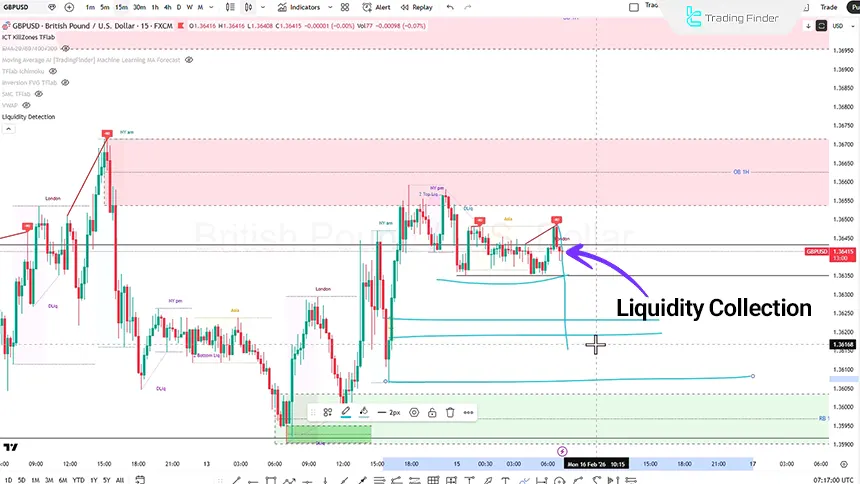
Analysis of GBPUSD on the 15-Minute (M15) Timeframe
On the 15-minute timeframe, price was in an Accumulation phase, followed by a sharp upward move. At the same time, divergence in the CVD indicator (CVD Divergence) has issued a signal of bullish weakness, which may pave the way for a bearish move.
Buy Scenario:
- After collecting sell-side liquidity, price reacts to the BPR or Order Block zone;
- Signs of weakness appear in the bearish trend;
- A market structure shift.
Sell Scenario:
- During the London session, price first collects buy-side liquidity;
- Reacts to the Order Block zone;
- Signs of weakness in the bullish move and a Change of Character (ChoCH) form.
Fundamental Analysis of the GBP/USD
At the latest UK monetary policy meeting, four members voted in favor of a rate cut, which is considered a signal of potential pound weakness. This reflects an expansionary bias and downward pressure on the GBP currency.
In contrast, despite relatively dovish views toward the US dollar, the relative strength structure still remains in favor of the USD.
Therefore, even in conditions of reduced demand for the dollar, this currency maintains a relative advantage over the pound and may shape more pronounced trends against GBP.
This week:
- UK inflation data (CPI) will be released;
- On Friday, the Purchasing Managers’ Index (PMI) will also be announced.
The market’s reaction to these data releases may determine the medium-term direction of the pair.
Conclusion
The overall structure of GBP/USD remains inclined toward bearish pressure; however, in the short term, a bullish correction to collect buy-side liquidity is possible.
The relative strength of the US dollar, alongside the expansionary signals from UK monetary policy, reinforces the risk of continued decline. Price reaction to the $1.3672 and $1.3696 levels, together with this week’s inflation and PMI data, will play a decisive role in confirming the market’s final scenario.


