


Key Points:
- GBP/USD entered a corrective phase under the influence of the weakening U.S. Dollar Index; the increase in short positions on the dollar supports the pound;
- On the 4-hour timeframe, after the FVG is filled, a correction toward the $1.355 area is possible; reaction to the Basing zone will determine the next direction;
- On the 1-hour timeframe, negative divergence and the $1.3624 level represent a key reaction area; holding this level could activate a bullish reversal scenario;
- On the 15-minute timeframe, the classic Asia accumulation and London manipulation scenario could lead to a Liquidity Sweep followed by a bullish Market Structure Shift;
- If bullish momentum stabilizes, the $1.3767 and $1.38 targets will be activated; otherwise, a correction toward $1.3589 and $1.355 is likely.
In GBP/USD trading, price moved under the influence of the weakening US Dollar Index and, as anticipated, entered a corrective phase after reacting to liquidity zones.The decline in momentum in the US Dollar Index and the increase in selling pressure have provided the foundation for pound strength.
In this analysis, movement scenarios are examined based on market structure, Fair Value Gap (FVG), and price behavior across multiple timeframes.
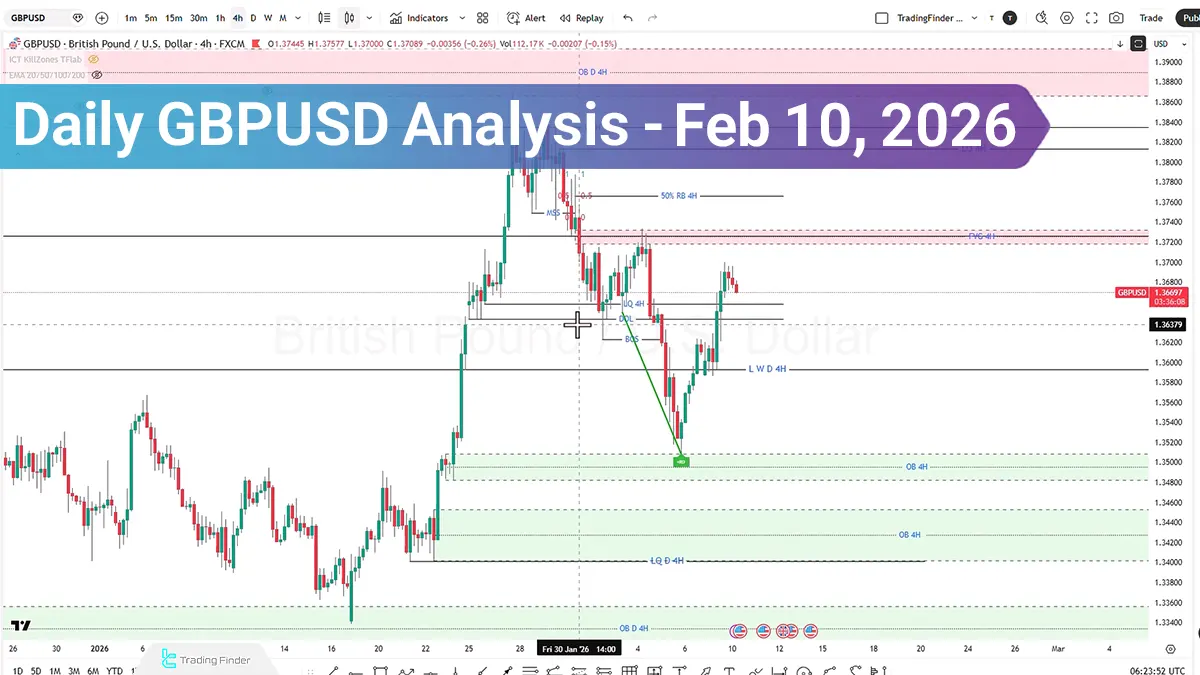
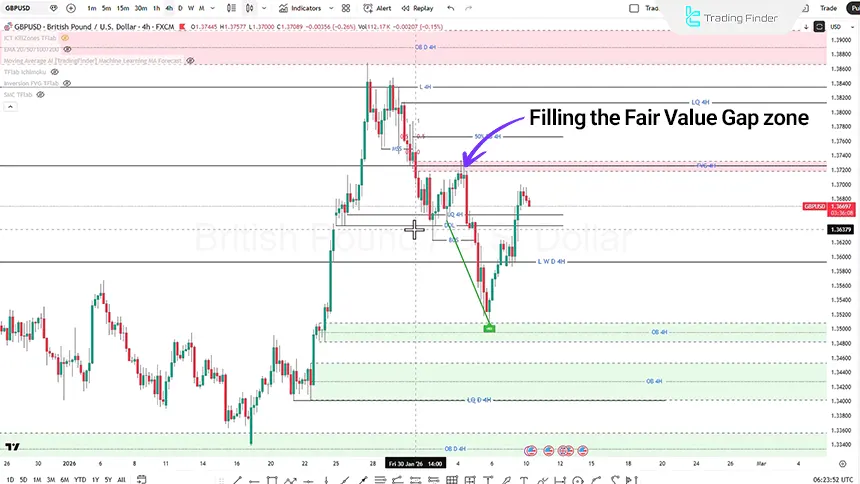
GBP/USD Analysis on the 4-Hour Timeframe
On the 4-hour timeframe, after filling the Fair Value Gap area, price entered a short-term reaction phase. At the same time, analysis of the US Dollar Index shows that selling pressure has increased and short positions have expanded; a factor that has led to relative pound strength against the dollar.
If selling pressure intensifies and the Basing zone is lost, price may move lower to collect sell-side liquidity, making a move toward the 1.355 area likely.
Additionally, if signs of weakness in the bearish trend appear (such as declining momentum or structural reaction within the Basing or FVG area), one may look for a market reversal and activation of the bullish scenario.
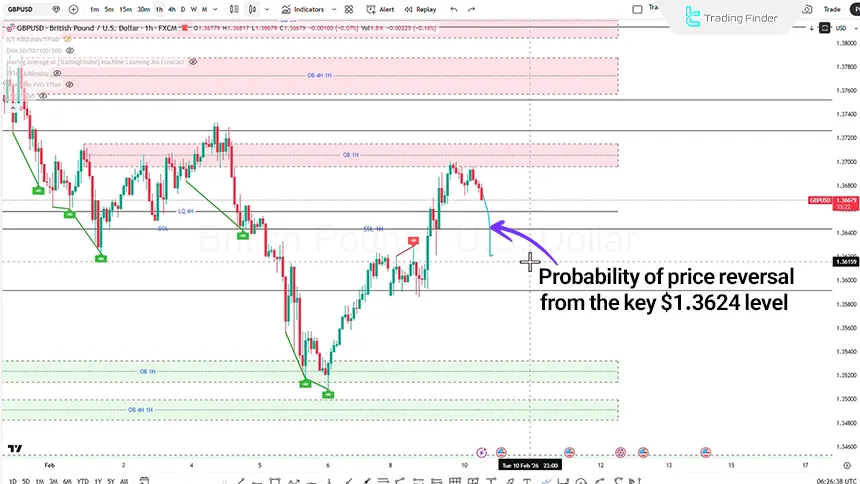
GBP/USD Analysis on the 1-Hour Timeframe (H1)
On the 1-hour timeframe, the downward price movement is accompanied by negative divergence, increasing the probability of completing the bearish correction. The Basing zone at $1.3624 is identified as a key reaction level.
If this level holds and a market structure shift is observed, long (Buy) positions can be considered with targets at previous swings and internal liquidity levels.
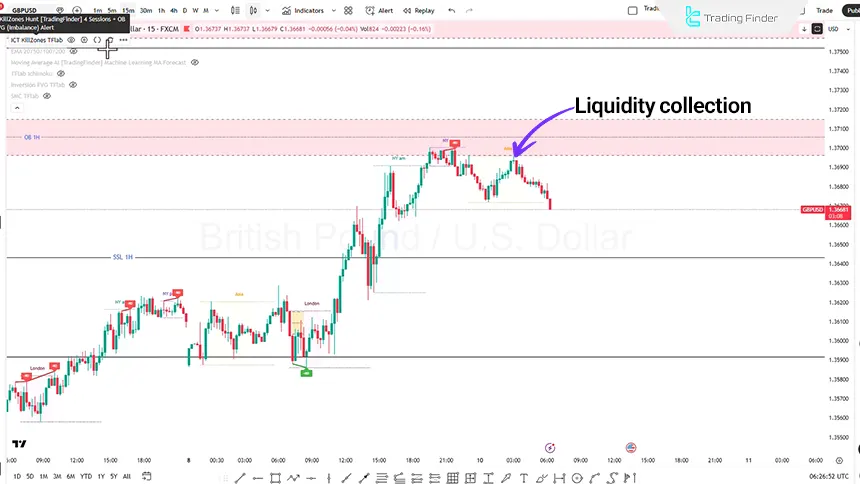
GBP/USD Analysis on the 15-Minute Timeframe (M15)
On the 15-minute timeframe, price behavior during the Asian session indicates an accumulation phase. Using the ICT Killzone indicator, key time zones can be identified.
Probable scenario on the 15-minute timeframe:
- Price accumulation during the Asian session;
- Deceptive move (Manipulation) at the beginning of the London session to the downside;
- Liquidity collection and execution of a Liquidity Sweep;
- Market Structure Shift;
- Bullish move with risk-to-reward targets of 1:1, 1:2, or higher.
Conclusion
The decline in momentum in the US Dollar Index and the increase in selling pressure remain the main drivers of pound strength. However, a short-term correction toward the $1.3622, $1.3589, or even $1.355 areas is not unlikely.
Price reaction within these zones will determine the market’s next direction. If a structure shift forms and bullish momentum stabilizes, the $1.3767 and $1.38 targets could become attainable.


