


Key Points:
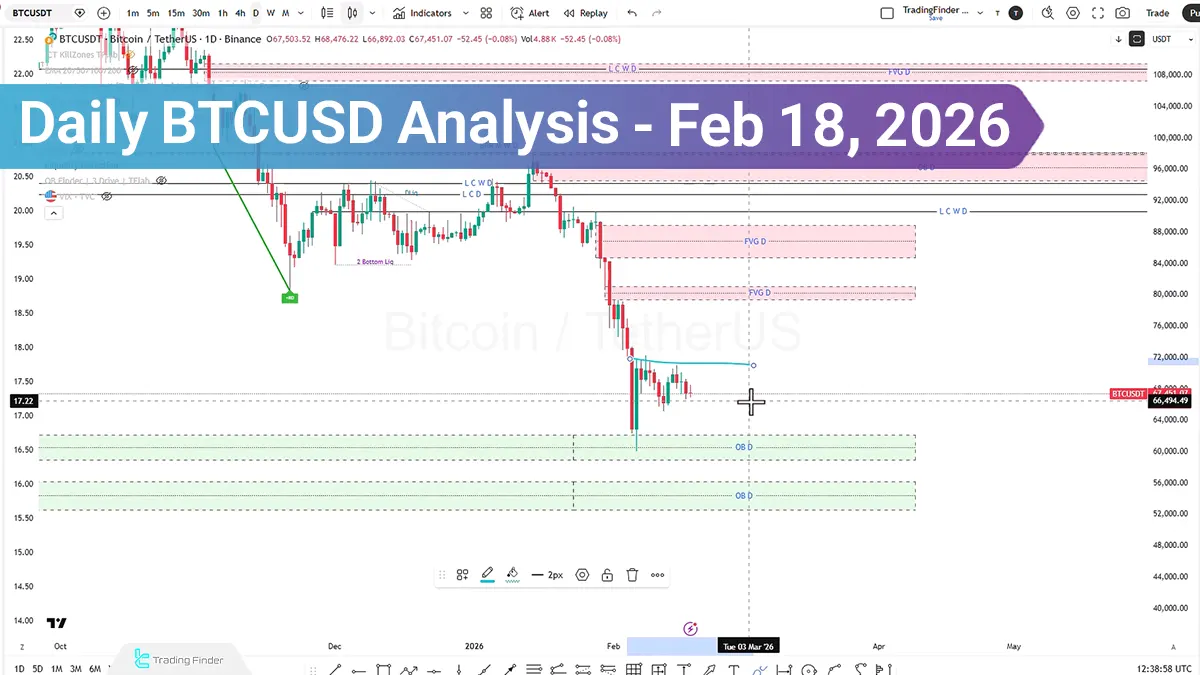
- Bitcoin is in a Consolidation phase, and the mid-term structure remains bearish with the formation of Lower Highs and Lower Lows;
- In the 4-hour time frame, unless a valid close is recorded below $66070, an acceleration of the bearish trend will not be confirmed; however, a break of $68534 and stabilization above $70219 could shift the short-term bias to bullish;
- In the 15-minute time frame, the Displacement cycle has been completed, and the reaction to the London session high plays a decisive role in the short-term direction;
- On-chain data and declining liquidity in the cryptocurrency market have increased the risk of a deeper correction; until key resistance levels are validly broken, the dominant scenario remains continued selling pressure toward lower liquidity zones.
The Bitcoin market has entered a Consolidation phase in recent days, and declining liquidity in the cryptocurrency market, combined with selling pressure, has prevented the formation of sustained bullish momentum.
The price structure in the mid-term time frames remains bearish, and until a noticeable improvement in sentiment in financial markets detection is observed, the dominant scenario will be continued pressure toward lower liquidity zones. On-chain data simultaneously shows signs of an increased risk of a deeper correction.
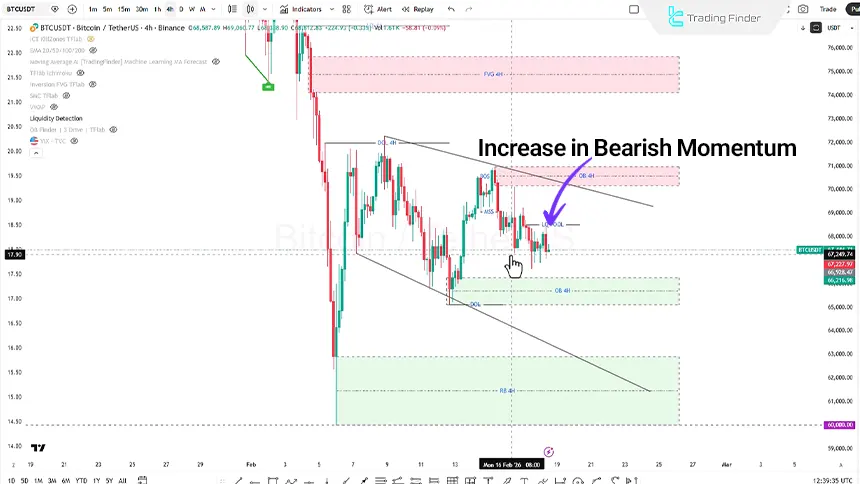
Bitcoin Analysis in the 4-Hour Time Frame (H4)
In the 4-hour time frame, price is fluctuating within a descending channel and is consecutively forming lower highs and lower lows. In yesterday’s trading session, price failed to break the key level and, after collecting liquidity, entered a ranging phase.
Based on the Price Action approach, as long as price cannot close below the $66070 level, a strong continuation of the bearish trend will not be confirmed.
Additionally, a move above 68534 and then stabilization above 70219 could signal a shift in the market’s short-term bias toward bullishness.
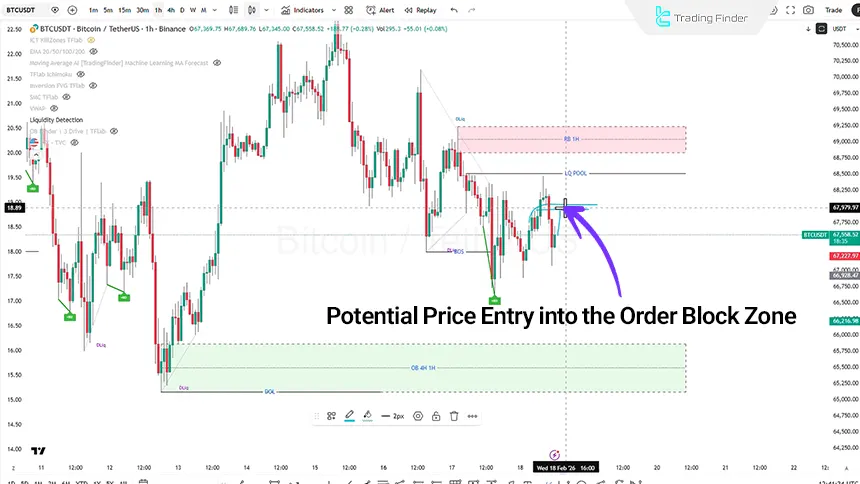
BTC Analysis in the 1-Hour Time Frame (H1)
In the 1-hour time frame, after selling pressure, price moved aggressively downward and, following a break of structure, once again performed a pullback to the upside.
Key characteristics of this structure:
- Price entering a bearish Order Block zone;
- Short-term reaction and inability to break the next structure;
- Collection of buy-side liquidity;
- Failure to register a close above previous swing points;
- Renewed return of selling pressure.
This price behavior can be considered a balancing phase and liquidity accumulation.
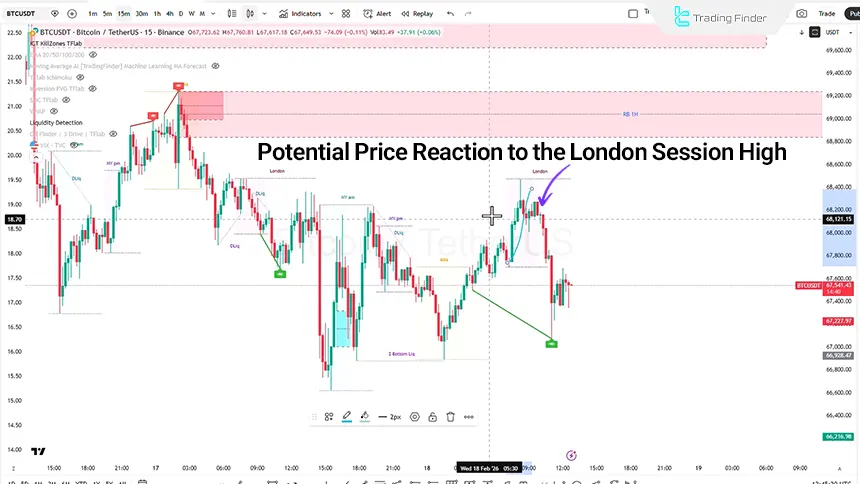
BTC Analysis in the 15-Minute Time Frame (M15)
In the 15-minute time frame and based on the ICT Kill Zone indicator framework, price behavior can be interpreted within a liquidity cycle and structural displacement. This structure begins with an initial accumulation phase and is subsequently completed with targeted displacements toward liquidity zones.
Price reaction to the previous day’s London session high is considered a key short-term market decision point, and the way price behaves around this level will determine the next directional move.
Conclusion
The overall Bitcoin structure is currently assessed as bearish, and the market’s primary focus is on collecting sell-side liquidity. As long as no valid breakout is observed above the $68534 and $70219 levels, the dominant scenario remains continued selling pressure and price attraction toward lower liquidity zones.


