


Key Points:
- AUD/USD entered the weekly Order Block with bullish momentum; however, the inability to close above previous swings and the presence of negative RSI divergence have increased the probability of a short-term correction;
- On the daily timeframe, as long as price holds above $0.6897, the overall structure remains bullish; a pullback to the FVG or the daily Order Block could provide an opportunity for trend continuation;
- On the 4-hour timeframe, reaction to the Fair Value Gap and the formation of bullish pin bars signal a return of demand; if bearish weakness appears, the buy scenario targeting higher swings will be activated;
- The corrective scenario could target the $0.6841 area, especially if buy-side liquidity is collected again and momentum weakens;
- Potential weakness in the U.S. Dollar Index toward the 95.994 level could support further AUD strength; however, short-term shifts in relative currency strength require precise risk management.
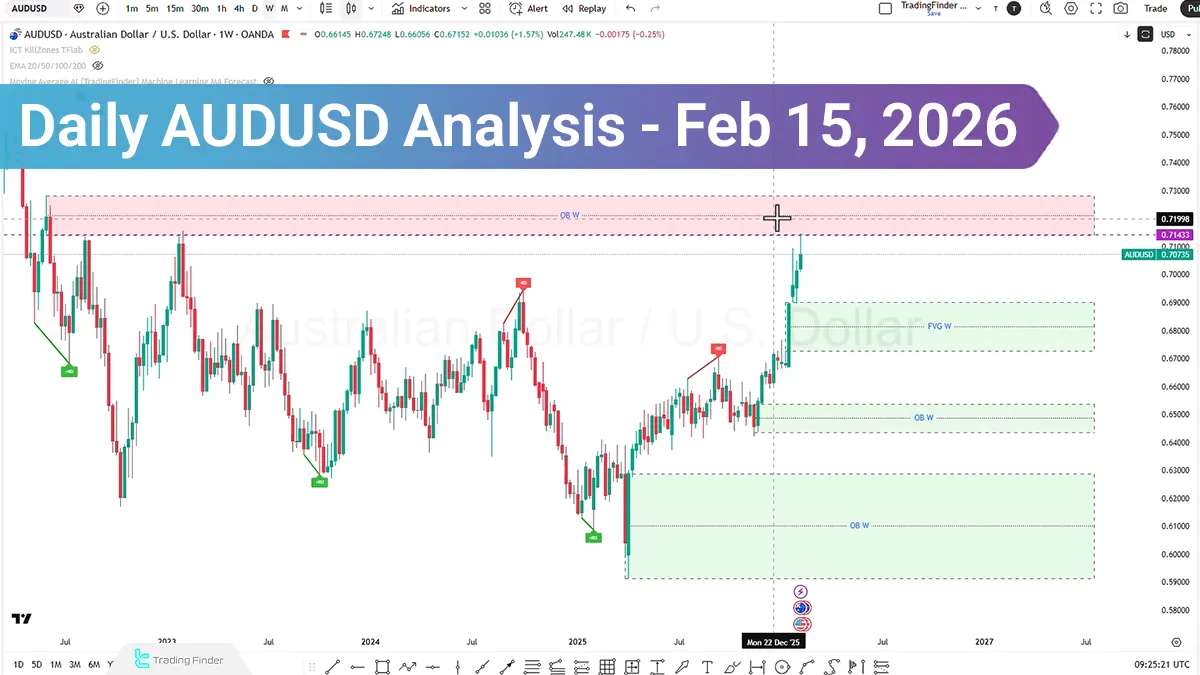
The AUDUSD pair moved in line with the projected scenario, gaining positive momentum and entering the weekly Order Block range.
Despite the expansive bullish move, price failed to close above prior swings and merely collected Buy Side Liquidity. Subsequently, the reaction to the Order Block zone, along with the Relative Strength Index (RSI) and overall market structure assessment, has presented multiple scenarios ahead for the market.
AUD/USD Analysis on the Daily Timeframe
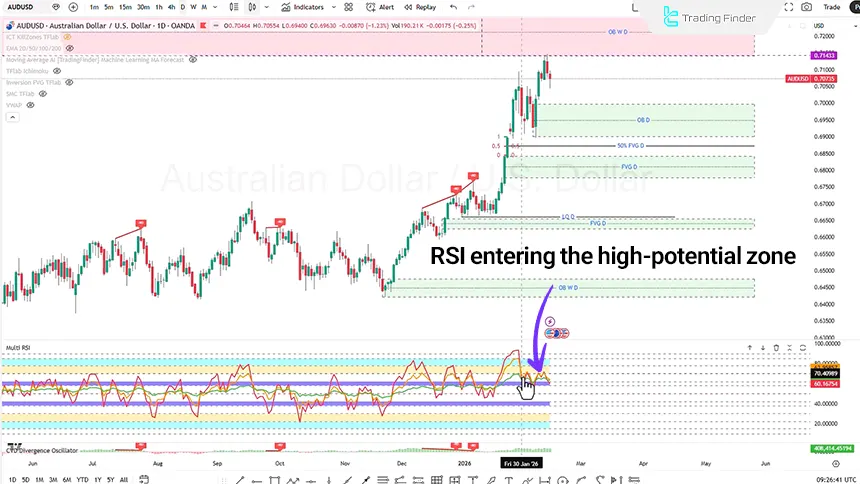
On the daily timeframe, price is breaking structural levels, indicating bullish trend stabilization at this scale. However, reviewing the Relative Strength Index (RSI) reveals an important point:
- The RSI has entered a high-potential zone but formed a lower high;
- While price is printing higher highs;
- This situation indicates negative divergence between price and the indicator.
Such divergence may be considered an early warning of a short-term correction.
Scenario One, If, at the beginning of the new week, price undergoes a short-term correction:
- Fills the Fair Value Gap;
- Or enters the daily Order Block zone.
Upon observing positive momentum, there is potential for targeting higher levels up to the 50% area of the weekly Order Block (refined on the daily timeframe).
Scenario Two, If price moves upward at the beginning of the week and once again collects Buy Side Liquidity, in the event of weakening bullish momentum, a sell position may be considered.
The target in this case could be, order block range or the FVG area at the 0.6841 level.
However, considering the overall bullish market context, priority remains with trend-aligned trades.
AUD/USD Analysis on the 4-Hour Timeframe (H4)
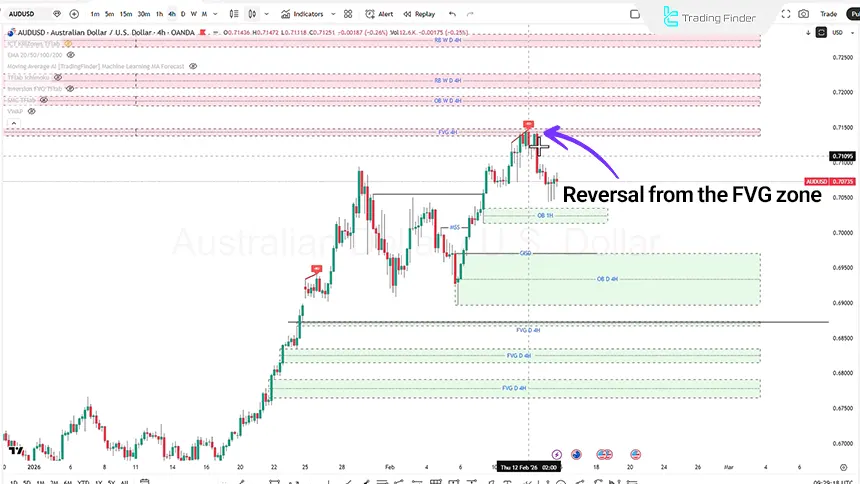
On the 4-hour timeframe, following a market structure break, price entered the Fair Value Gap (FVG) zone with bullish momentum. In that area:
The CVD Divergence indicator had identified negative divergence;
- Multi RSI also showed negative divergence;
- Price moved downward;
- Collected Sell Side Liquidity;
- Reacted to the FVG zone;
- And formed three bullish Pin Bar candles.
This candlestick behavior reflects buying pressure and the potential continuation of the bullish trend.
Additionally, if price corrects and forms three consecutive bearish layers along with the identification of weakness in the bearish move and prints a confirmed bullish candle, Strategy No. 2 will be activated as follows:
- Entering a buy position can be considered;
- Stop loss should be placed behind the Pin Bar candle;
- Targets should be determined based on swings or risk-to-reward ratios of 1:1 and 1:2.
Analysis of the U.S. Dollar Index (DXY)
Throughout the week, the Australian Dollar (AUD) became the strongest currency in the market, while the U.S. Dollar (USD) ranked weaker. However, during the final 48 hours of the week:
- AUD strength was declining;
- USD strength increased.
And on the last trading day, this shift in strength continued. From a fundamental perspective, if accompanied by selling pressure, the U.S. Dollar Index (DXY) may continue its downward trend toward the $95.994 level.
Under such conditions, DXY weakness could lead to relative AUD strength and the targeting of higher price levels in AUD/USD.
Conclusion
The overall market structure on higher timeframes remains bullish; however, negative divergence on the daily timeframe increases the likelihood of a short-term correction.
Price behavior within Order Block and Fair Value Gap (FVG) zones will play a key role in determining the next move.
As long as no valid close below $0.6897 is recorded, the dominant scenario remains continuation in line with bullish momentum; nevertheless, risk management is essential in response to shifts in relative currency strength and fluctuations in the U.S. Dollar Index (DXY).


