


Key Points:
- Ethereum, on the 1-hour timeframe, has entered a selling pressure phase following a bearish Displacement and a break of structure; additionally, the filling of the Fair Value Area and the formation of a Pin Bar indicate a short-term reaction;
- In ETH, as long as a valid close above the broken structure is not recorded, the short-term bias remains bearish; bullish corrections are primarily evaluated as pullbacks toward supply zones;
- On the 1-hour timeframe of BNB, the formation of a bullish Full Body Candle signals a temporary entry of buying momentum; however, considering the macro conditions and the Extreme Fear environment, this move may merely be a short-term correction;
- Declining liquidity, capital outflows, and rising uncertainty regarding U.S. monetary policies may prevent the formation of a sustained bullish trend;
- In both assets, the final direction depends on the quality of the close within Order Blocks, the strength of momentum, and price reaction to supply levels after the break of structure; risk management carries heightened importance under low-liquidity conditions.
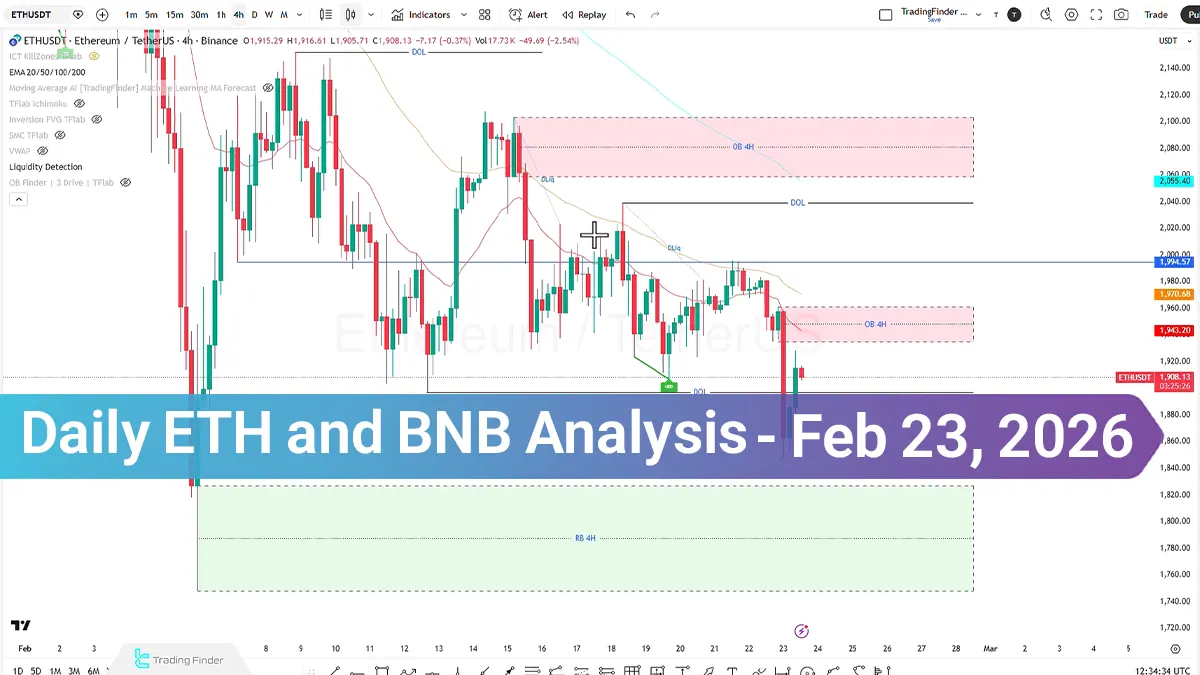
The cryptocurrency market began the week, coinciding with the reopening of the Asia Session, under increased selling pressure.
This supply pressure led to a market structure break and liquidity collection at lower levels. Under current conditions, declining liquidity and the dominance of fear sentiment may reinforce the bearish scenario; however, should new liquidity enter the market, bullish corrections toward supply zones would not be unexpected.
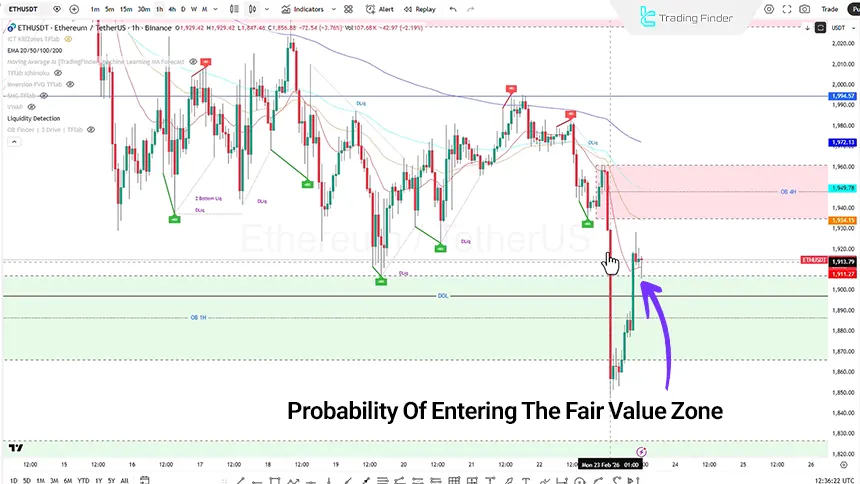
Analysis of ETH on the 1-Hour Timeframe (H1)
On the one-hour timeframe, a bearish Displacement move is clearly observable. This move took shape simultaneously with the release of the news declaring the tariffs imposed by Donald Trump as illegal by the U.S. Supreme Court, which led to a price decline at the opening of the Asian session. Price behavior in this time frame:
- An unsuccessful attempt to reclaim higher levels;
- Filling of the Fair Value Gap;
- Liquidity Formation;
- Formation of a Pin Bar candle in the reaction zone.
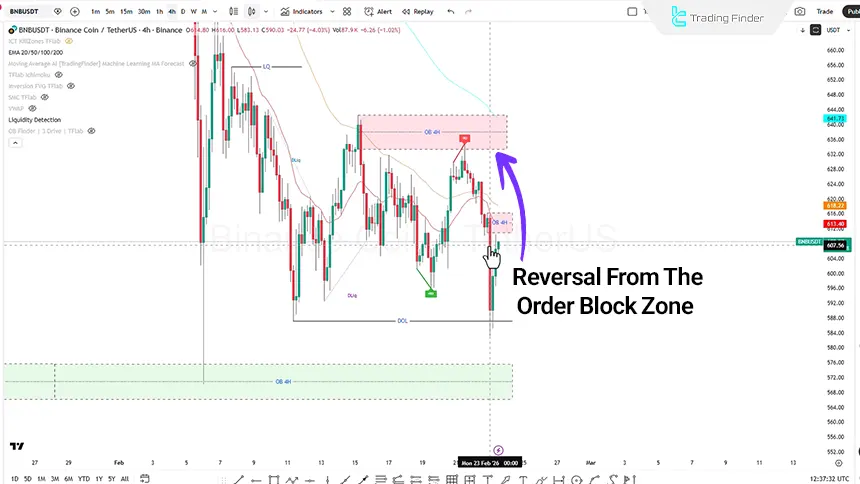
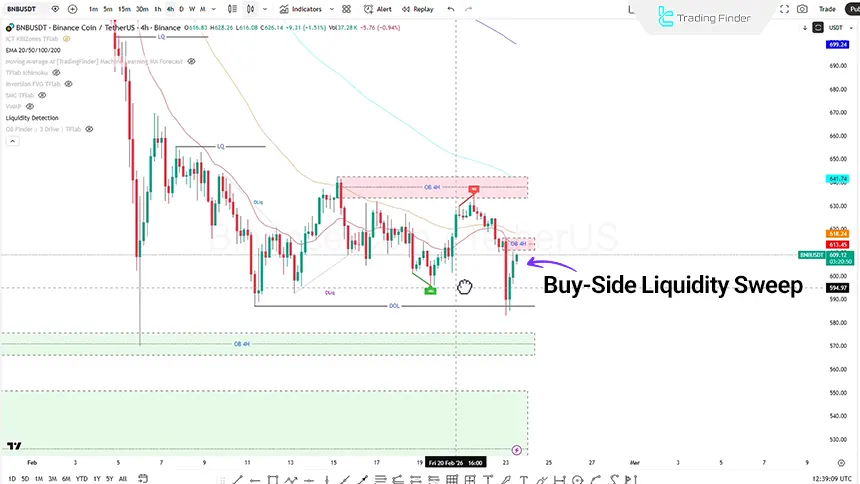
Analysis of Binance Coin on the Four-Hour Timeframe (H4)
Binance Coin also experienced a bearish move under the influence of the news environment and market selling pressure. After a Liquidity Sweep and liquidity collection, the price consolidates again within a range with candle closure stabilization; for the 4-hour timeframe, two potential scenarios are considered:
In case of a price increase, a move toward the Order Block zone is possible; if weakness is observed in the bullish trend within this zone, a sell position may be considered.
The first Order Block zone may act as a liquidity absorption area; the price may move toward the second Order Block within the $621 to $650 range; if a break of structure or a change of structure is observed in this area, the sell scenario will be reactivated.
Based on the previous signal, after liquidity collection, the market entered a bearish phase, providing an opportunity to capitalize on a sell position.
Analysis of BNBUSDT on the 1-Hour Timeframe (H1)
On the one-hour timeframe of Binance Coin, the latest recorded candle is a bullish full-body candle, which from a price action perspective is considered a Bullish Displacement. This type of candle typically indicates the temporary entry of buying momentum into the market and may have formed with the objective of collecting Buy Side Liquidity at higher levels.
However, it should be noted that the broader market conditions remain influenced by Extreme Fear, declining liquidity, capital outflows, and increasing uncertainty in the monetary and monetary policy of the United States. These factors may prevent the stabilization of a sustained bullish trend and limit upward moves to temporary corrections.
Conclusion
The technical structure of Ethereum and Binance Coin under current conditions is influenced by break of structure, liquidity collection, and the dominance of bearish momentum. Declining liquidity and the prevailing fear sentiment in the market may reinforce the bearish scenario.
although bullish corrections toward Order Block zones remain possible. Price behavior around supply zones and reaction to broken structures will determine the short-term direction of the market.


