In the forex market, strong positive or negative correlations often exist between similar or opposite currency pairs, and using these relationships helps avoid opposing trades and apply more precise risk management to reduce unintended losses. Within professional trading workflows, this analytical layer is often aligned with performance validation processes such as Forward Test and Forward Testing to ensure decisions remain robust under real-market conditions.
Analyzing correlation structures between currency pairs helps prevent position overlap, reduce portfolio risk, and support effective diversification and hedging. This is especially important in Forward Testing, where hidden exposures and the real-world behavior of correlations become clearer than in historical simulations.
This approach reduces portfolio volatility by optimizing capital allocation, refining stop-loss levels, and coordinating entries and exits, while Forward Testing helps minimize severe losses and improve overall portfolio resilience.
Monitoring currency pair correlations is essential for smart risk management and validating technical breakout failures
Why Is Currency Pair Correlation Important in Trading?
Paying attention to currency correlations in trading enables intelligent hedging, precise risk control, and the validation of technical breakouts. There are 5 reasons to pay attention to currency pair correlations in trading, which are as follows:
Eliminating counter trades
Profiting from temporary divergences
Hedging positions
Diversifying risk
Testing breakouts and technical confirmations
Note: To analyze the correlation coefficient (a metric showing correlation strength) for forex market, use TradingFinder’s Forex Correlation Tool.
Eliminating Counter Trades
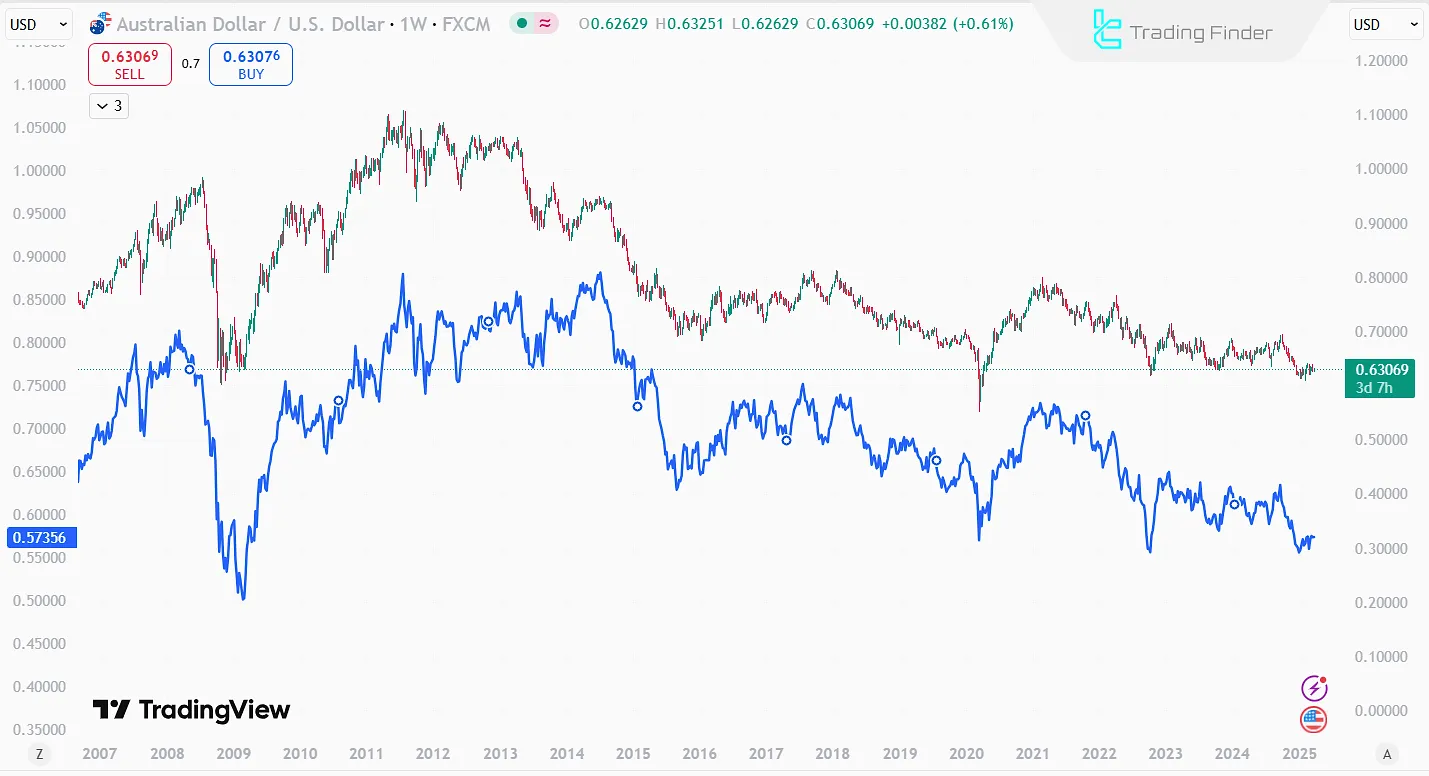
By identifying pairs with strong negative correlations, traders can avoid simultaneous trades on them. Pairs moving in opposite directions may cancel out each other’s profits/losses.
Example: Opening a long AUD/USD and a short NZD/USD will neutralize the positions’ effects.
The similar trend and correlation of AUD and NZD against the USD are evident
Why Positive Correlation Can Increase Hidden Trading Risk?
When two currency pairs have a strong positive correlation, opening same-direction trades on both pairs may seem like two separate trades, but it actually increases exposure to a single market move.
If the analytical scenario is wrong under these conditions, losses will occur simultaneously on both trades. Reviewing correlation before entering a trade helps the trader avoid these types of hidden risks and gain a more accurate view of how much of their capital is exposed to the market.
Profiting from Temporary Divergences
Occasionally, highly correlated pairs diverge due to political, geopolitical, or economic factors. Traders can capitalize on the expected reversion to correlation by entering positions aligned with the anticipated price reversal.
Example of Profiting from Divergence
During political uncertainty in Germany, EUR/USD weakens while GBP/USD remains stable or strengthens. Post-election, EUR/USD is likely reverts to its correlation with GBP/USD. A trader could profit by going long in EUR/USD.
If the selling pressure on the euro is accompanied by declining trading volume and, at the same time, the technical structure displays signs of consolidation or trend reversal, the probability of renewed convergence increases.
Examining the behavior of the US dollar index and comparing the intensity of its volatility with the pound’s reaction can make entry timing more precise.
For a deeper understanding of correlation and trading currency pairs, the educational video on the BKTraders channel on YouTube provides specialized and practical content, and interested traders can benefit from supplementary explanations and real-world examples.
Hedging Positions
Understanding the nature of assets and currency pair correlations is crucial for hedging and risk control.
For example, when market sentiment is risk-averse due to war, a trader may open long positions on gold and a safe-haven currency (such as the Swiss Franc).
However, since geopolitical risks are unpredictable and there is a possibility of a peace agreement, the trader also enters a long position in line with market risk appetite (Risk On assets).
In this scenario:
If the war continues, the Risk On positionwill hit its stop-loss, but this loss will be offset by the gold and Franc positions reaching their profit targets;
Conversely, if the war risk suddenly dissipates, the gold and Franc positionswill hit their stop-loss, but the hedging Risk On position will reach its target, compensating for part of the loss.
Impact of Timeframe on Currency Pair Correlation
Correlation between currency pairs is not the same across all timeframes. Two currency pairs may have a very high correlation on the daily timeframe, but show different behavior on shorter timeframes such as 15 minutes or one hour.
This issue is especially important for scalpers and day traders. If correlation analysis is performed solely based on long-term data, short-term decisions may become inaccurate. Therefore, correlation should be analyzed in alignment with the trading timeframe.
The table below practically illustrates the impact of different timeframes on currency pair correlation and can be used by scalpers, day traders, and swing traders:
Correlation Analysis Timeframe
Currency Pair Correlation Characteristics
Correlation Stability Level
Dominant Influencing Factors
Suitable Trading Style
Risk of Relying on Correlation
Long-term (weekly/monthly)
Structural and macro-level correlation
Very high
Monetary policies, macroeconomics, interest rates
Position trading
Low
Medium-term (daily)
Relatively stable but dynamic correlation
High
Major market trends, key news
Swing trading
Medium
Short-term (1-hour)
Unstable and variable correlation
Medium
Trading sessions, liquidity
Day trading
Medium to high
Very short-term (15 minutes and below)
Weak or intermittent correlation
Low
Short-term volatility, order flow, market noise
Scalping
High
Multi-timeframe comparison
Multi-layer (top-down) correlation
Analysis-dependent
Combination of macro and technical factors
Professionals
Lower (if analyzed correctly)
Testing Breakouts and Technical Confirmation
Comparing correlated pairs helps validate breakouts at key support/resistance levels. Evaluating the validity of breakouts becomes more accurate when the reactions of aligned currency pairs are examined adaptively.
The simultaneous price behavior of multiple correlated instruments when interacting with support or resistance levels is considered a sign of confirmation of real market pressure and increases the probability of continuation.
This behavioral alignment acts as a control filter, limits entries into deceptive breakout scenarios, and ultimately elevates the decision-making structure and risk control to a more professional level.
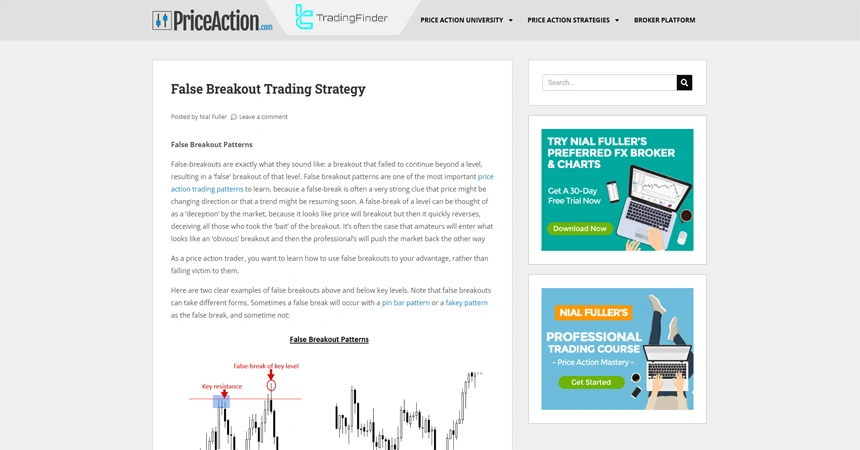
To gain a more precise understanding of false breakouts on price charts, studying the article on fake breakout education on the priceaction.com website is recommended for interested readers.
An educational article analyzing false breakouts in price charts using the price action method; source: priceaction.com
For example, the NZD/USD currency pair has a positive correlation with AUD/USD and a strong negative correlation with USD/CAD and USD/CHF; Now, the NZD/USD currency pair has broken a significant technical support. In this case, there are two scenarios:
Breakout Confirmation Scenario
In this scenario, the fluctuations of other currency pairs also confirm the breakout; for example, AUD/NZD is also likely positioned near a similar support level, while USD/CAD and USD/CHF are located near resistance levels.
Then, the trader should examine the breakout of support and resistance levels in currency pairs with strong correlation; in a confirmation scenario, other currency pairs also follow a similar trend and their key levels are broken as well.
Breakout Non-Confirmation Scenario
In this scenario, other currency pairs do not show weakness against the US dollar and their key technical levels remain unbroken, indicating that USD strength is not the driving factor. Instead, the decline in the NZD is likely caused by internal economic or political weakness specific to New Zealand.
In the “breakout non-confirmation” scenario, weakness in NZD/USD does not spread across the broader currency market, as other major currencies against the US dollar show no significant weakness and their key technical levels remain intact.
In such conditions, the decline of the New Zealand dollar is primarily rooted in internal fundamental factors such as weak macroeconomic data, political uncertainty, or negative monetary policy expectations, while the role of the US dollar remains secondary and non-driving.
This divergence between the behavior of the NZD and other currencies can serve as a warning sign of limited trend strength and the failure to form a broad, dollar-driven market wave.
Risk Diversification Through Using Correlations
With highly correlated currency pairs, risk can be diversified. Portfolio diversification only becomes meaningful when the open trades truly exhibit different price behavior. Opening multiple trades on currency pairs with strong correlation does not actually create diversification, even if the pair names are different.
By analyzing correlation, the trader can determine whether their trades are genuinely independent of one another or merely appear diversified on the surface.
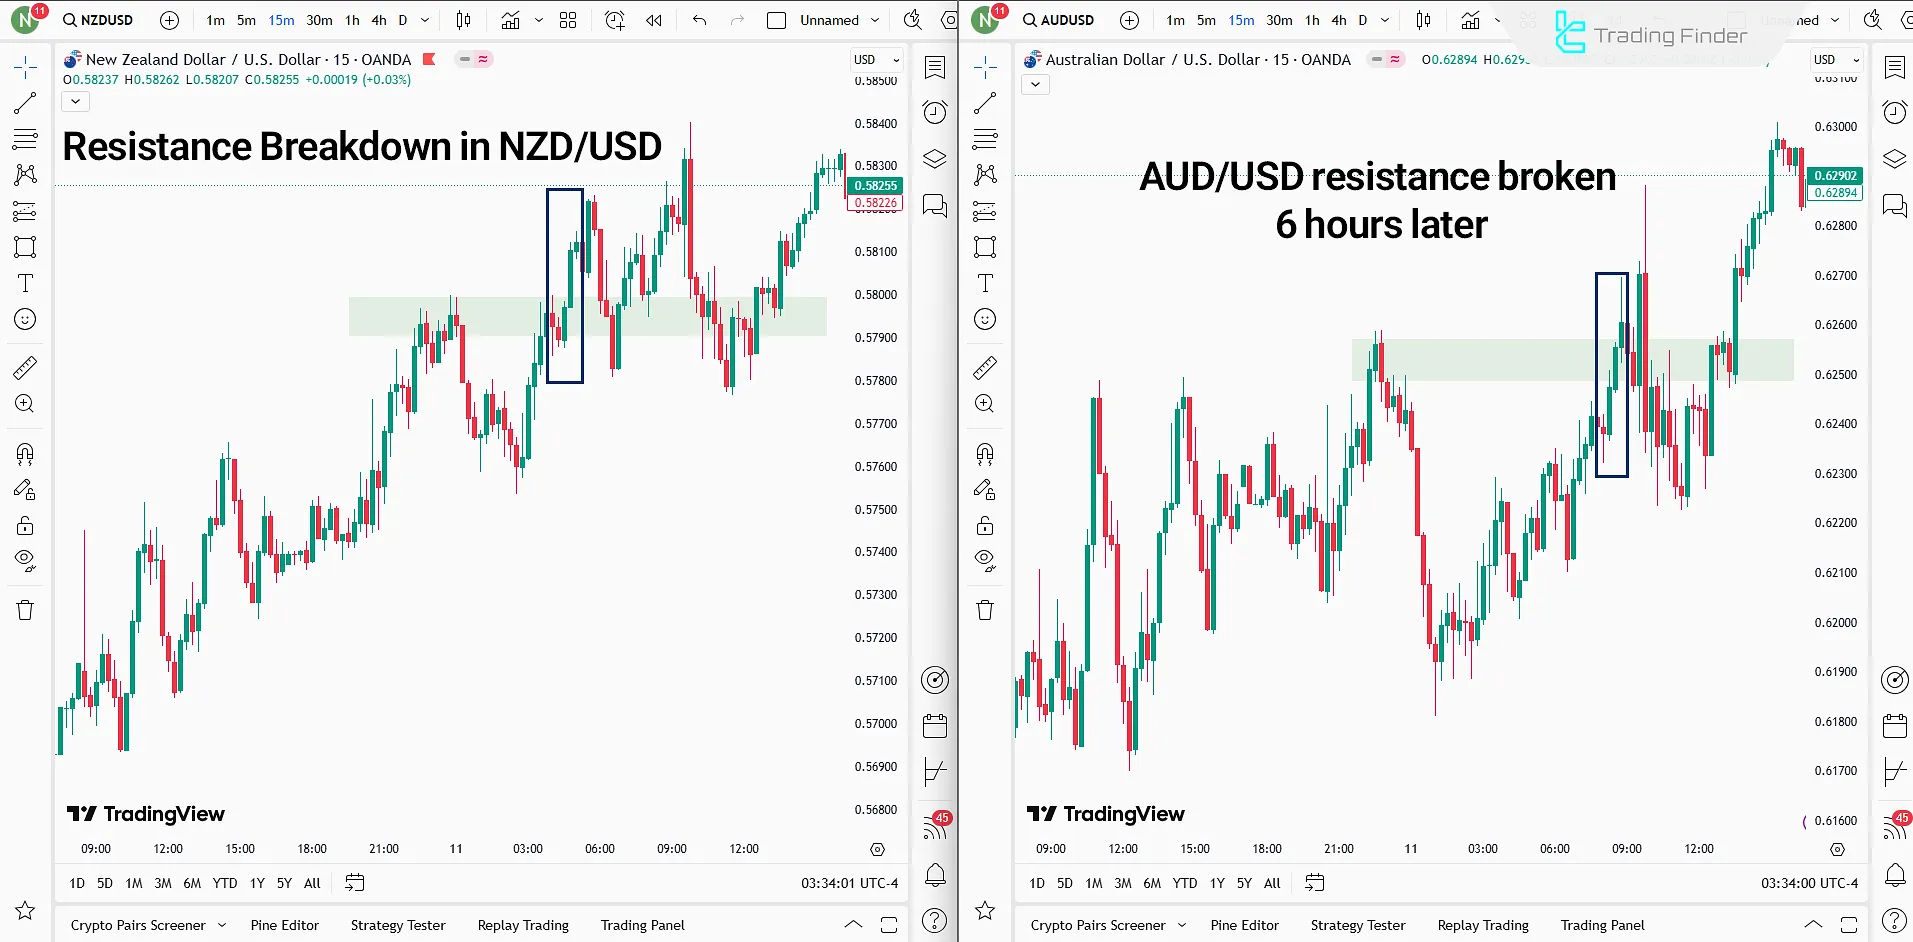
For example, in the image below, the similar fluctuations of the AUD/USD pair with the NZD/USD pair are highlighted; in the NZD/USD pair, a resistance level was broken, and three hours later, the AUD/USD pair also broke through a similar resistance level.
Breaking a similar resistance level in AUD/USD and NZD/USD
When Should Currency Pair Correlation Not be Trusted?
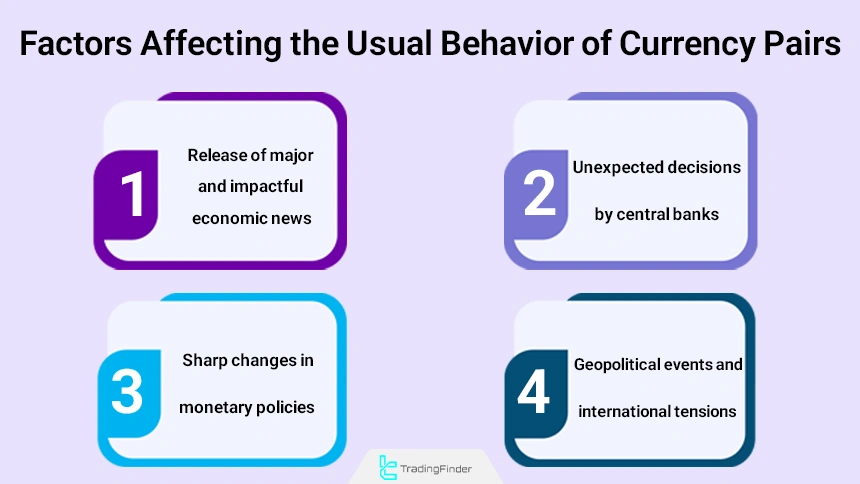
Correlation between currency pairs is not always constant and may weaken or even temporarily disappear under certain market conditions. Various factors can cause changes in the usual behavior of currency pairs, including:
Release of major and impactful economic news
Unexpected decisions by central banks
Sharp changes in monetary policies
Geopolitical events and international tensions
Factors that change the usual behavior of forex currency pairs and should be considered when relying on their correlation
In such an environment, relying solely on historical correlation data without considering current market conditions can lead to incorrect analysis and high-risk decision-making.
Therefore, it is recommended that currency pair correlation always be evaluated alongside other analytical tools such as technical analysis, fundamental analysis, and risk management to increase the accuracy of trading decisions.
Common Trader Mistakes in Using Forex Currency Pair Correlation
One of the most common mistakes traders make is treating correlation as a fixed and permanent rule, while financial markets are inherently dynamic and correlations between assets can weaken over time or even completely reverse.
Effective use of correlation requires a clear understanding of market conditions and its integration with technical and fundamental analysis and sound risk management, allowing it to function as a practical complementary trading tool.
Common Mistakes in the Improper Use of Correlation Include the Following:
Increasing actual trade risk by opening multiple same-direction trades on highly correlated currency pairs;
Excessive and unplanned use of hedging strategies without a proper understanding of their impact on capital management;
Ignoring current market conditions and relying solely on past statistical relationships.
The most common mistakes in using currency pair correlation for forex trading
False Breakout Indicator in TradingView for Trading Correlations
The false breakout or fake breakout indicator in the TradingView platform is recognized as an advanced technical analysis tool that can be used to identify false breakouts in highly correlated currency pairs.
Its primary focus is identifying breakouts that lack continuation and quickly become invalid.
In this structure, price briefly moves beyond key support or resistance levels but soon returns to the previous range; behavior that typically triggers stop-loss orders for impatient traders.
By detecting oscillation failure break patterns or swing high and low failure patterns (Swing Failure Pattern – SFP), this indicator identifies liquidity absorption zones; areas that often set the stage for reversal movements and justify entries against the initial price move.
This tool holds a special position in professional strategies and market psychology–based approaches and is used across various markets, including forex, cryptocurrency, and stocks.
Not being limited to a single timeframe allows for multi-timeframe analysis and makes it possible to simultaneously examine the overall market structure and more precise signals.
In uptrends, a rapid price return after a resistance breakout can indicate a buying opportunity, and in downtrends, a temporary support break followed by price recovery often generates a valid sell signal.
The indicator settings section includes Logical Setting, Display Setting, and Alert. Parameters such as Swing Period for measuring volatility, Max Swing Back for evaluating the depth of price pullbacks, and display options for distinguishing high and low breakouts allow for precise tool configuration.
The alert system also provides timely notifications of pattern formation without the need for continuous chart monitoring. Overall, a proper understanding of false breakouts and the correct use of the False Breakouts indicator focuses analysis on real price behavior and liquidity flow and prevents engagement with misleading signals; an approach that is highly important for professional traders.
Conclusion
Currency correlation is an effective tool for traders, helping to reduce unwanted losses and avoid unnecessary trades by eliminatingcountertrades, taking advantage of temporary divergences, and implementing smart hedging strategies. Considering the correlation between currencies, a trader can distribute their trading risk across two currency pairs that have a positive correlation.
Currency correlation delivers its highest analytical value when applied adaptively and based on up-to-date data; because changes in monetary policies, macroeconomic shocks, and shifts in capital flows can alter price relationships within a short period of time.
Within this framework, using normalized correlation matrices and aligning them with historical price behavior reveals tradable patterns, filters out low-credibility signals, and provides the trader with deeper insight into the hidden risk embedded in trades.
Currency pair correlation PDF
Currency pair correlation PDF
Click to download Currency pair correlation PDF
Quiz
5 Questions
Q1: What happens when a trader opens a long AUD/USD position and a short NZD/USD position simultaneously?
Q2: How can traders profit from temporary divergences in highly correlated currency pairs?
Q3: In a risk-averse market scenario due to war, what hedging strategy is described for managing geopolitical uncertainty?
Q4: What indicates a confirmed breakout versus a false breakout when using currency correlation analysis?
Q5: How can risk diversification be achieved using positively correlated currency pairs?
FAQs
Why is paying attention to currency pair correlations in forex important?
Paying attention to forex currency correlation and correctly understanding the relationship between currency pairs helps traders avoid opening positions that lead to identical or opposing outcomes.
It also enables more precise performance in risk management, diversification, and hedging.
How is breakout validation performed using correlation analysis in forex?
In the process of breakout validation, applying correlation analysis in forex helps traders examine whether other related currency pairs confirm the breakout, since correlated pairs often react simultaneously to key technical levels.
How does considering currency correlation achieve risk diversification and reduce trading risk?
To achieve reducing trading risk, capital can be allocated across multiple instruments through trading portfolio diversification, but this must be done with awareness of correlation to prevent concentrating risk on currency pairs that move in the same direction.
What is the currency pair correlation coefficient and its role in trading decisions?
The currency pair correlation coefficient is a numerical value between -1 and +1 that shows how strongly two currency pairs are related, allowing traders to measure dependency levels and make more informed strategic decisions.
How does currency pair correlation affect simultaneous trading of currency pairs?
When executing simultaneous trading of currency pairs, understanding forex pair correlation helps traders evaluate whether their combined positions amplify risk or create balanced exposure across the portfolio.
How does analyzing currency pair relationships help improve trading strategies?
Accurate analysis of the connection between currency pairs provides a broader view of market dynamics and enables traders to align individual trades with overall market behavior rather than isolated price movements.
How does currency pair correlation vary across timeframes and why should it be considered?
Currency correlations are not static; currency pairs with positive correlation may move closely together on higher timeframes while showing weaker alignment on lower timeframes, which is crucial for avoiding misleading signals in short-term strategies.
Is currency pair correlation reliable during major economic news events?
During major news releases, forex currency correlation can temporarily weaken or shift direction as market attention focuses on one specific currency, meaning traders should rely less on historical correlation data and apply stricter risk controls.
How can changes in currency pair correlation be used as warning signals in trading?
Sudden shifts in the relationship between currency pairs in forex may indicate changing market conditions or new liquidity entering the market, prompting traders to reassess open positions, adjust risk parameters, or exit trades earlier.