


- TradingFinder
- Education
- Interesting Financial Articles
- Indicators Financial Articles
Indicators Financial Articles
In technical analysis, indicators process price and volume data to display market behavioral patterns. These tools are divided into different categories such as trend identification, momentum, volume, and oscillators, and are used in various trading strategies. TradingFinder's website offers over 100 free indicators, including key ones like the Simple Moving Average (SMA), Exponential Moving Average (EMA), Relative Strength Index (RSI), Moving Average Convergence Divergence (MACD), Ichimoku Cloud, Bollinger Bands, On-Balance Volume (OBV), Accumulation/Distribution (A/D), and Average True Range (ATR). Each of these tools uses statistical calculations to analyze price behavior across different time frames and provides information about trend strength, overbought and oversold areas, divergences, trading volume, and market volatility. The indicator content section of TradingFinder's website features articles on the best technical analysis indicators, in-depth comparisons, and the pros and cons of each tool. It also covers key factors for selecting and combining indicators, the differences between Leading and Lagging indicators, and other related topics.
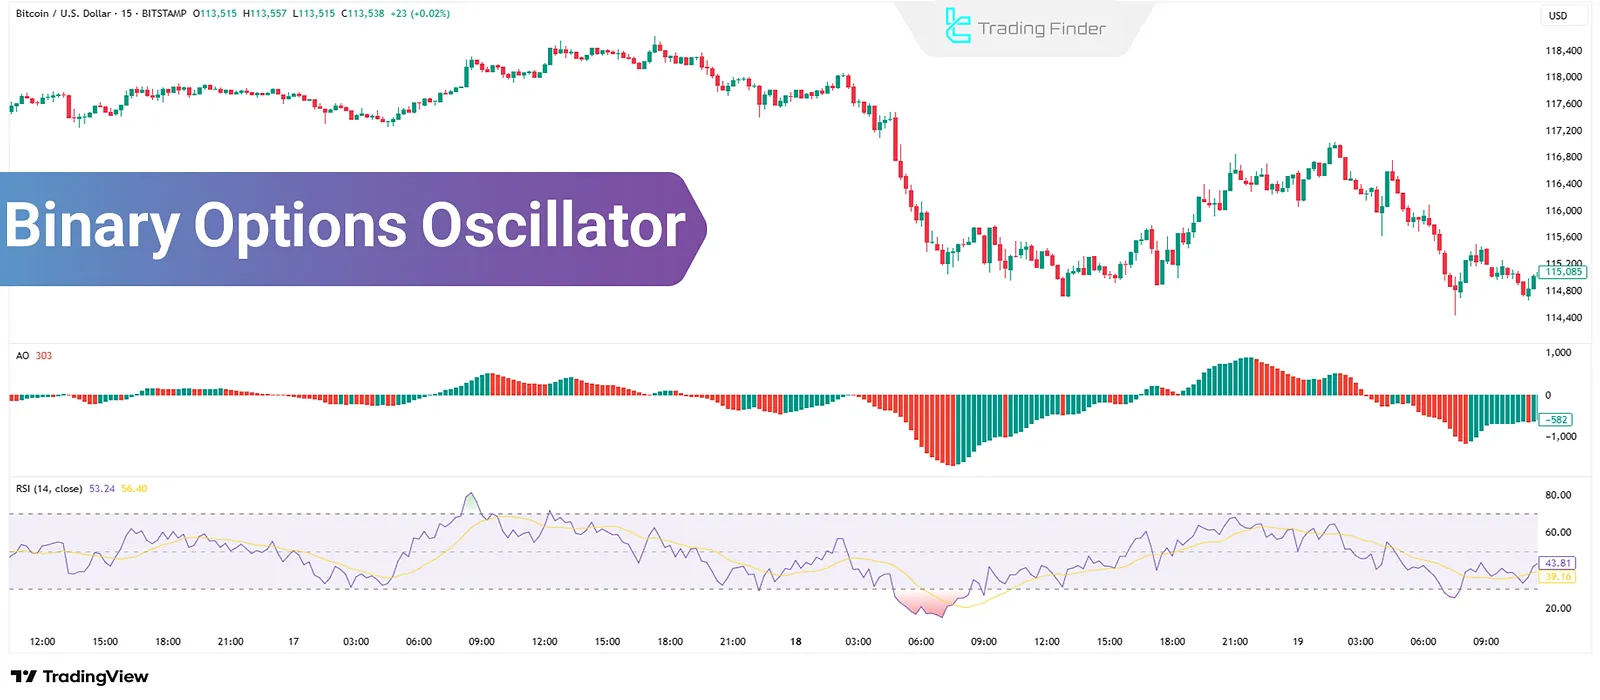
Types of Binary Options Oscillators: Identifying the Probability of Reversal
In binary options trading, decision-making often relies on short-term market movements. In such conditions, oscillators become highly...
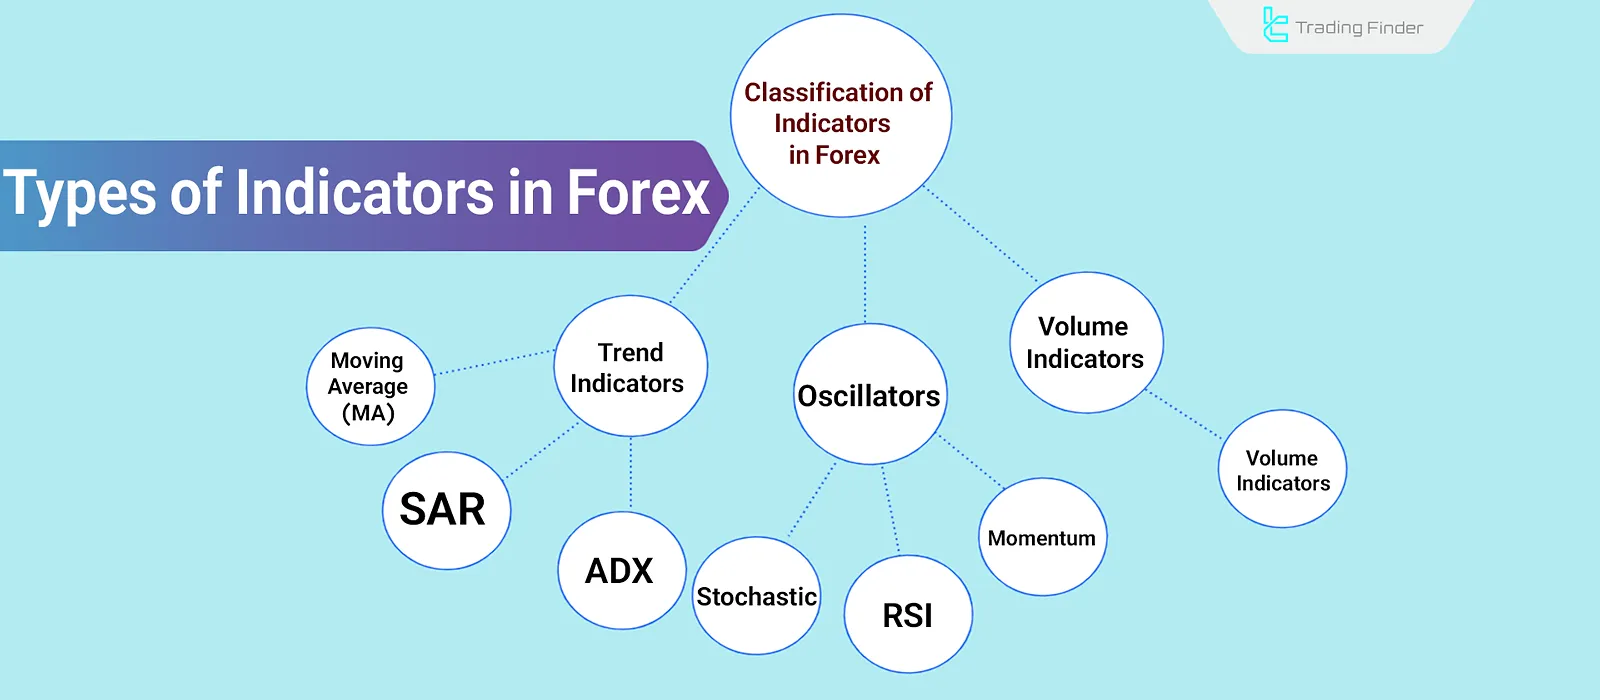
Types of Technical Analysis Indicators & Oscillators: Trend, Volume, & Momentum
Technical analysts in the Forex Market use indicators to measure trends,momentum, overbought and oversold levels, and the...

Capital Management Expert Advisor; 5 Best EAs for Prop and Standard Accounts
One of the essential tools for precise risk and capital management in forex trading accounts is the Capital Management Expert...
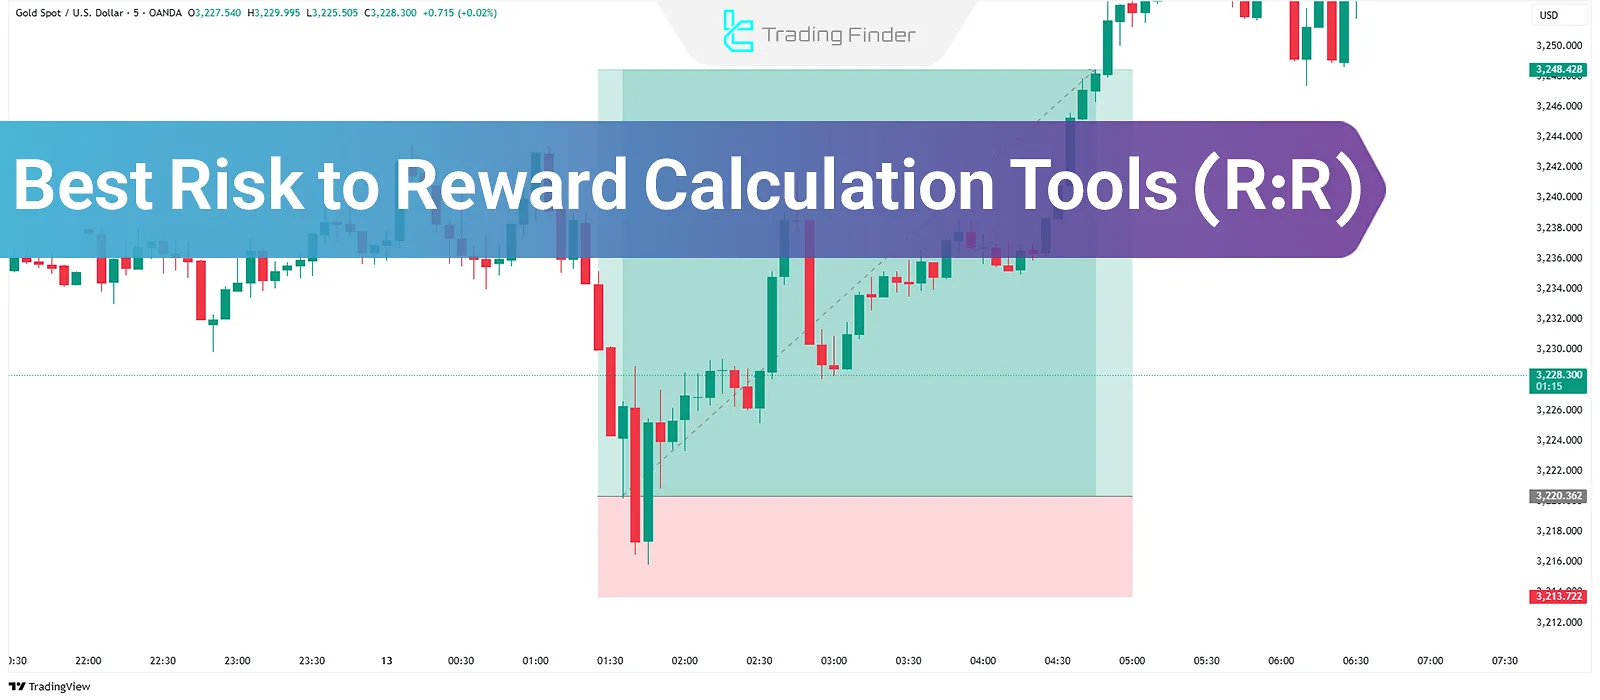
Risk to Reward Calculator Tools + Calculation Formula
Using accurate tools for Risk to Reward Calculation (R:R) not only minimizes analytical errors but also plays a vital role in...
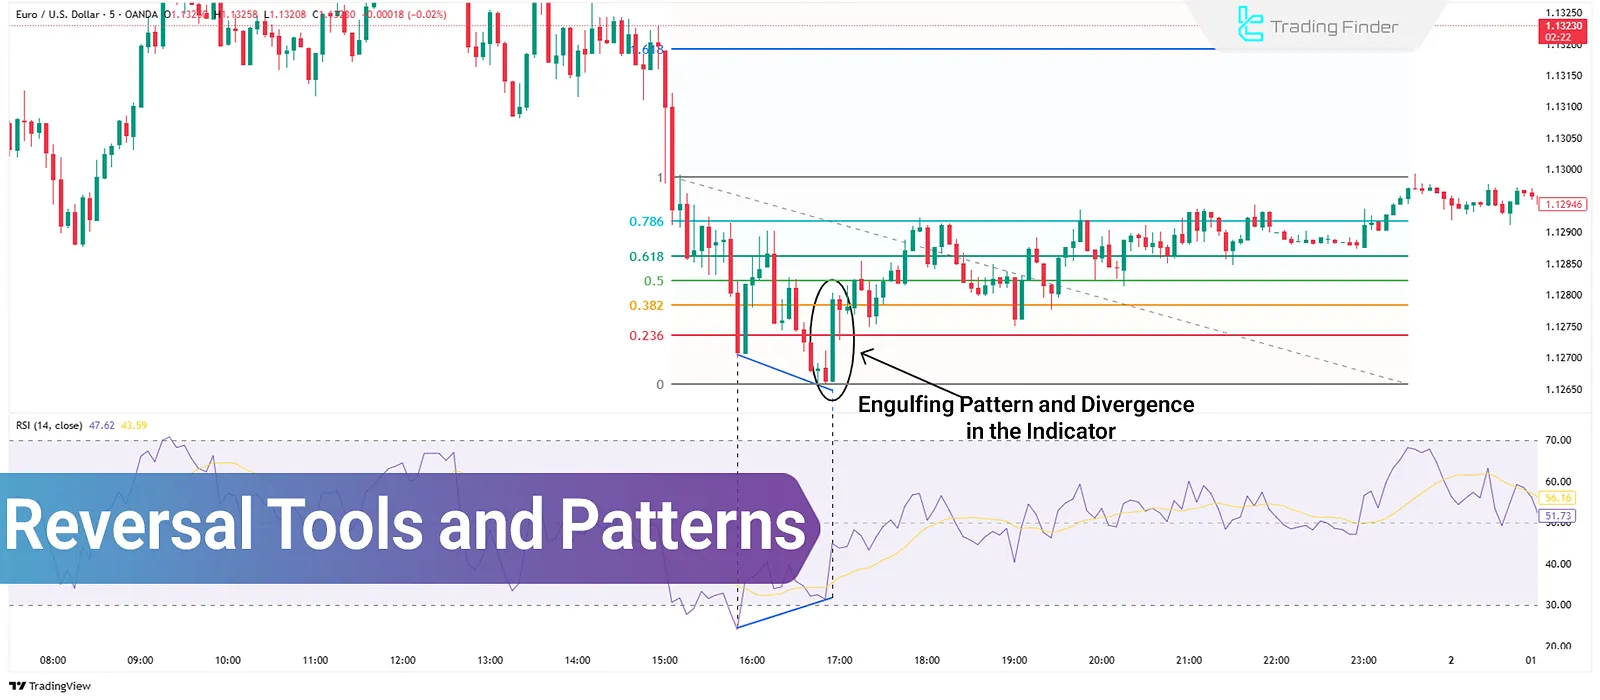
Trend Reversal Detection Tools & Patterns in Trading: RSI, MACD, Stochastic
Identifying trend reversal points is a key concept in price action and technical analysis, as these areas are often associated...
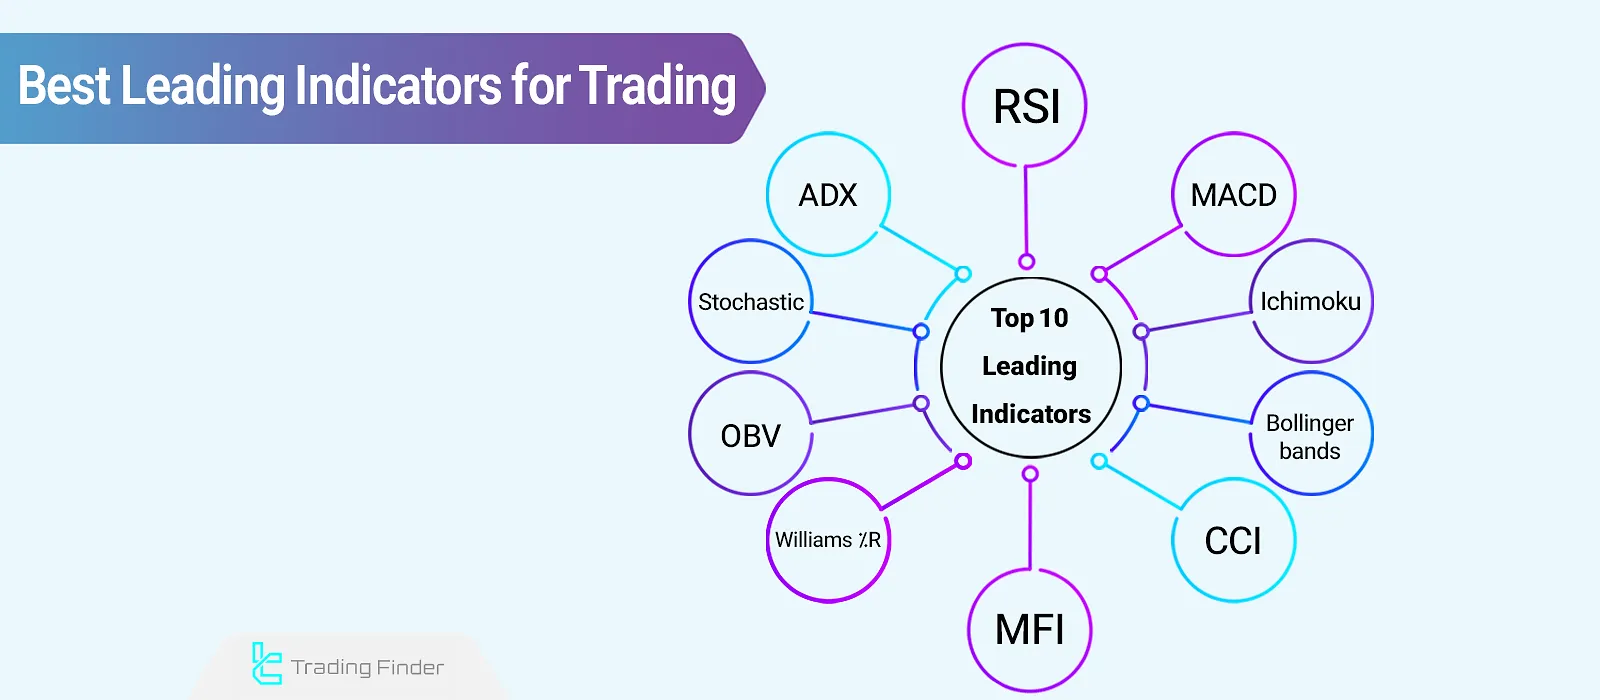
Best leading indicators in trading; Top 10 Leading Technical Indicators
Leading indicators in technical analysis use historical price data to generate early signals about potential market direction...
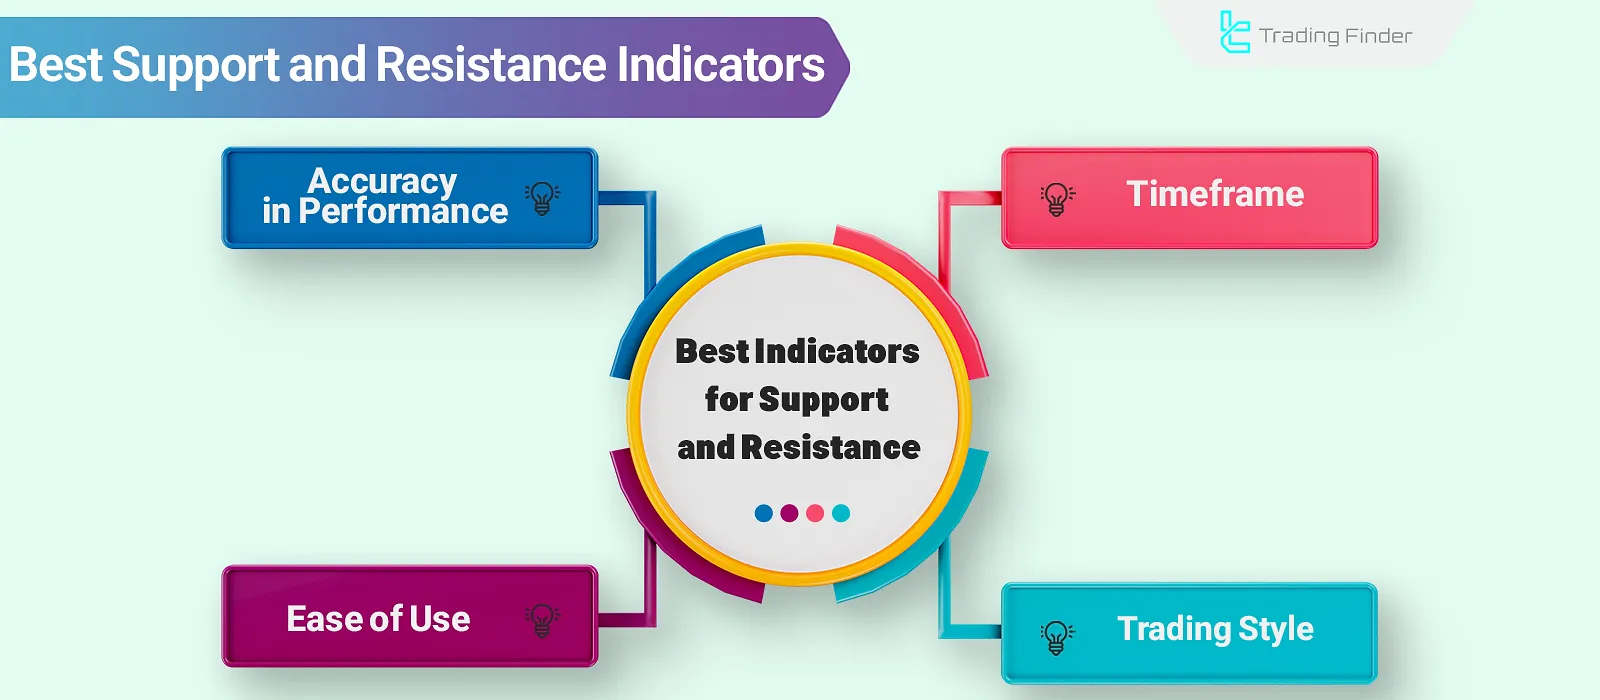
Best Support and Resistance Indicators; top 13 indicators
In technical analysis, support and resistance levels represent zones of supply and demand where significant price reactions often...
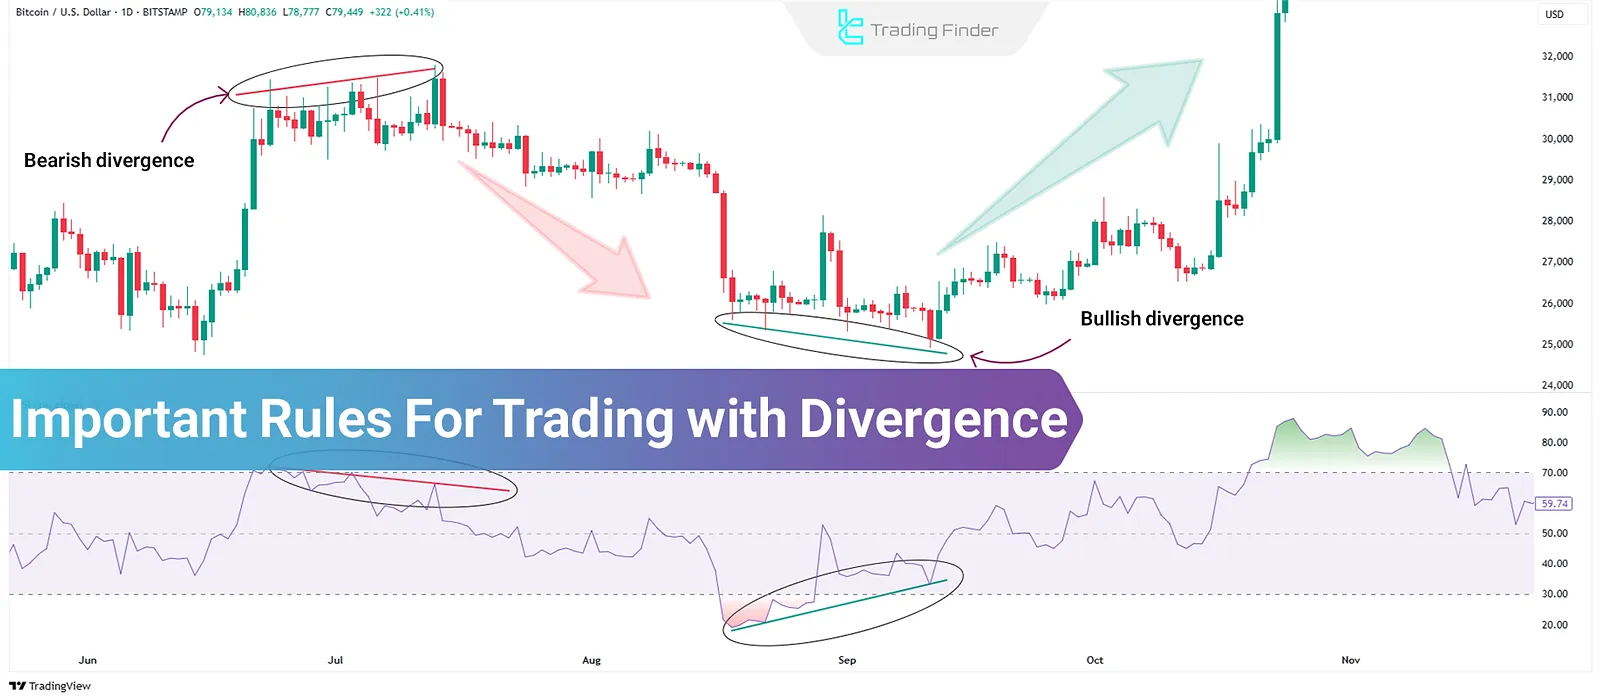
10 Essential Rules for Trading with Divergences in Technical Analysis
One of the techniques that traders use in technical analysis to assess potential trend weakening and identify key price levels...
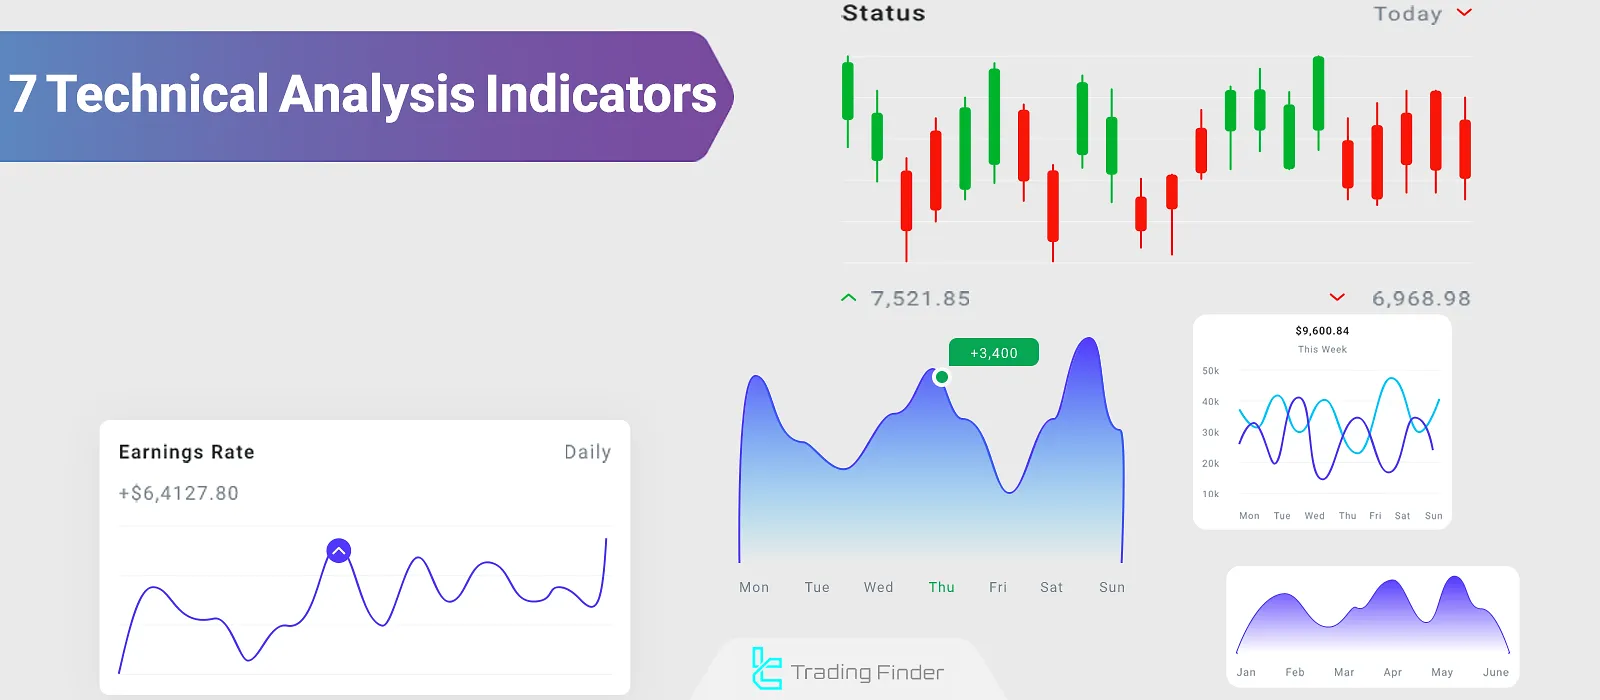
Introduction to 7 Technical Analysis Indicators – MACD, RSI, Ichimoku & More
Technical Analysis Indicators, based on historical market data, help identify the next potential price movement. These tools analyze...
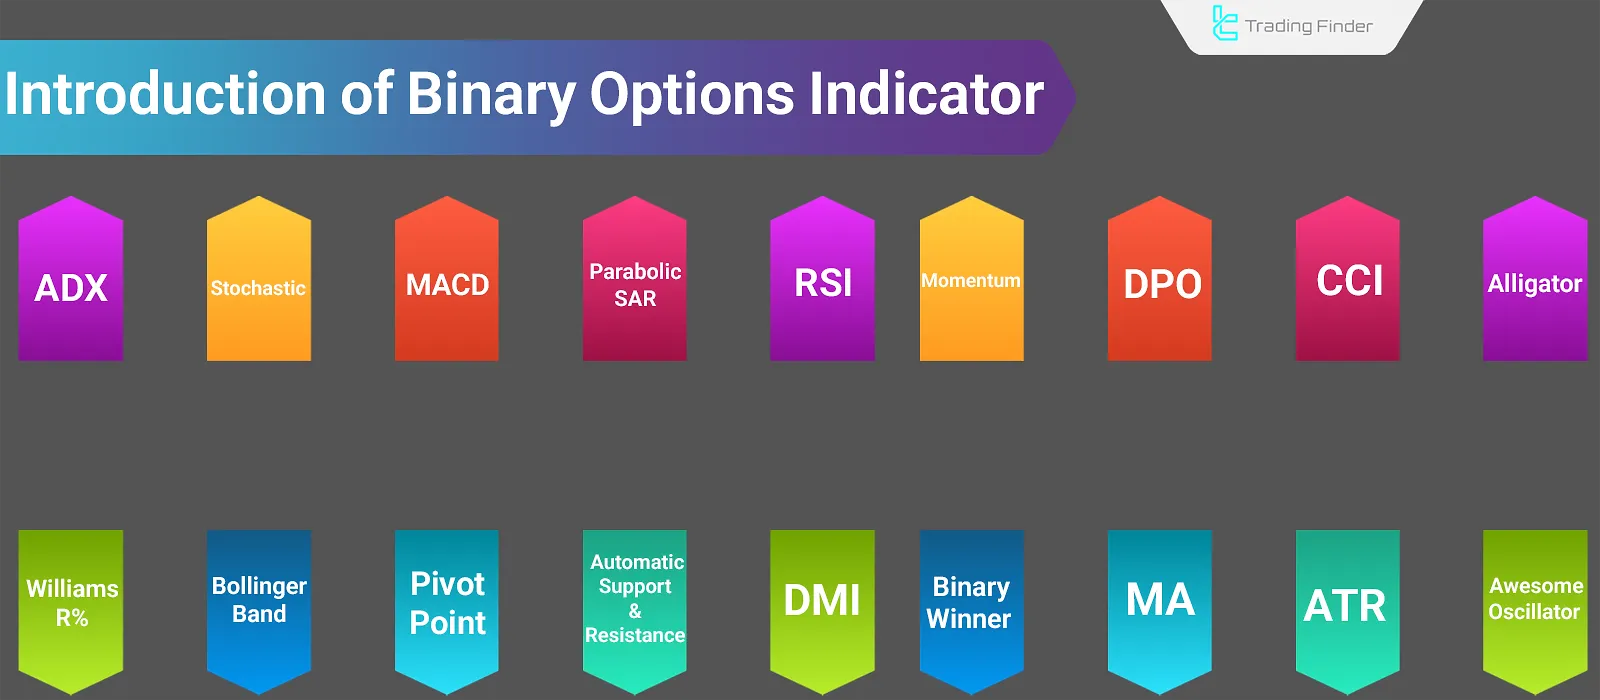
Indicators for Binary Options; Using MACD, Momentum, ATR, RSI for Binary Trading
In binary options trading, by electing the right indicator, you can identify entry zones and choose the appropriate expiration...


