


The Alligator Indicator in Binary Options is one of the well-known tools in technical analysis, specifically used to identify trending and consolidation phases of the market.
This indicator, inspired by the behavior of an alligator, illustrates the sleeping and waking moments of the market, allowing for a more precise analysis of price flow.
In this trading tool, three Smoothed Moving Averages (SMMA) with Fibonacci level settings are combined within its structure, creating a suitable analytical framework.
What Is the Alligator Indicator in Binary Options?
The Alligator Indicator, designed by Bill Williams, aims to identify market trends and price consolidation phases.
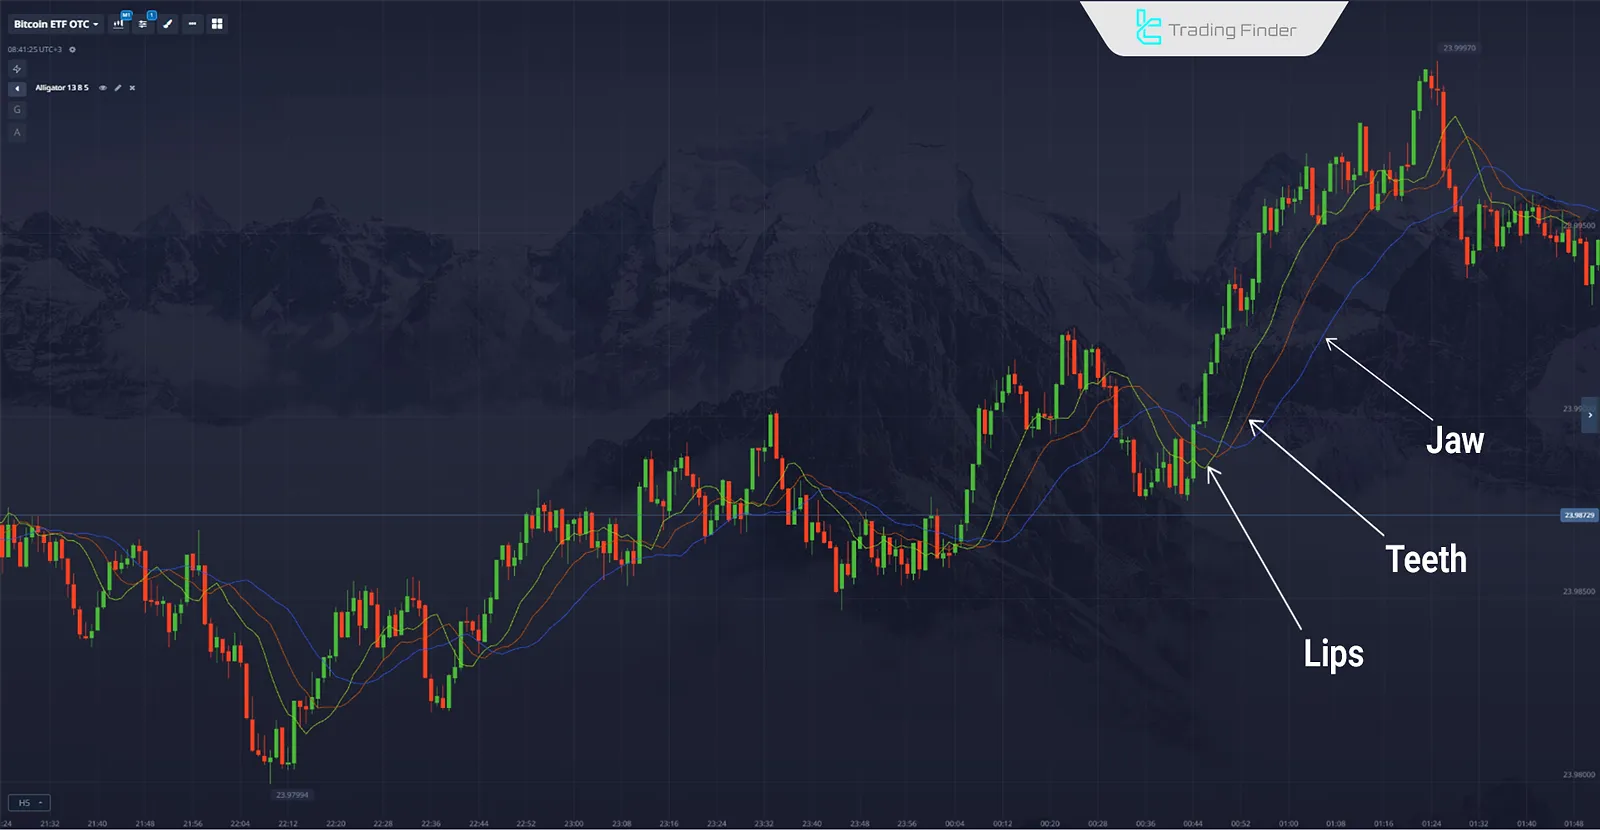
It is made up of three Smoothed Moving Averages (SMMA), each serving a different function as follows:
- Jaw: Represents the long-term trend
- Teeth: Represents the medium-term phase
- Lips: Represents the short-term trend
When these lines intertwine, the market is in a non-trending state or the alligator’s “sleep.” When the lines open apart, the market “wakes up” and a trend begins.
Beyond trend detection, the Alligator provides a visual framework to better understand momentum and identify important entry or exit points.
For this reason, it holds a significant place in markets such as Forex, stocks, commodities, and especially binary options trading.
Advantages and Disadvantages of the Alligator Indicator in Binary Options
The Alligator Indicator in Binary Options combines both strengths and weaknesses. On the one hand, it identifies major trends and presents dynamic levels; on the other, it generates false signals in ranging phases.
To observe these features more precisely and review their practical application, the table below summarizes the key advantages and disadvantages of this indicator:
Advantages | Disadvantages |
Trend and momentum confirmation | Lagging nature due to moving averages |
Clear and easy-to-understand signals | Potential for false signals in consolidation phases |
Usable across different timeframes in all financial markets | Over-reliance on a single tool, ignoring other factors |
Dynamic support and resistance display | Requires additional input filters |
High flexibility when combined with indicators like RSI and MACD | Excessive risk in specific market conditions |
Ability to enter the market in early trend formation | - |
Application of the Alligator Indicator in Binary Options
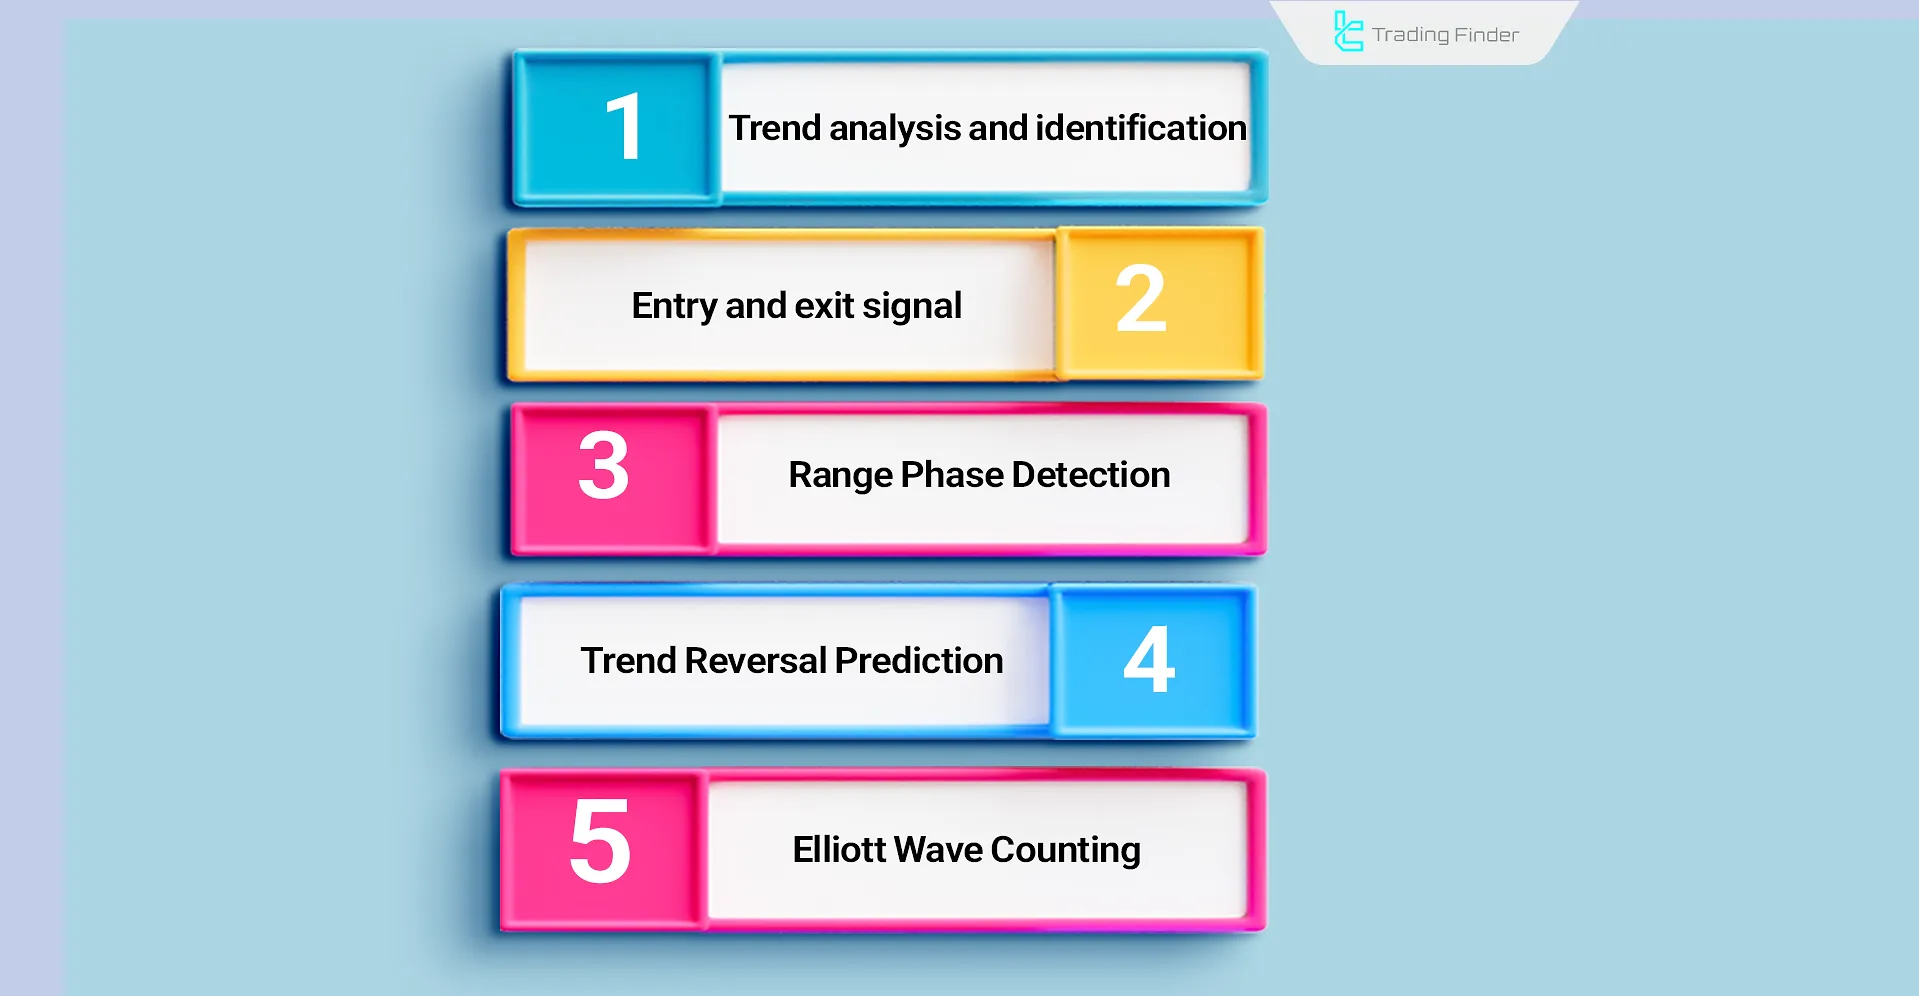
The Alligator Indicator is a practical tool for identifying trends and analyzing market structure. Its main uses include:
- Trend Analysis and Identification: The positioning of the blue, red, and green lines enables recognition of bullish or bearish trends, allowing traders to adjust their trading scenarios accordingly;
- Entry and Exit Signals: When the green line (Lips) crosses above the other two, it signals a buy; when it crosses below them, it signals a sell;
- Range or Consolidation Detection: When the lines are intertwined or close together, the market is in a non-trending or ranging phase;
- Trend Reversal Prediction: Lines moving apart indicate trend strength, while re-convergence suggests a possible reversal;
- Elliott Wave Counting: Thanks to its three-line structure, the Alligator helps identify Elliott Waves more precisely, complementing wave analysis.
Market Analysis Training with the Alligator Indicator in Binary Options
The Alligator consists of three Smoothed Moving Averages that form a mouth-like structure on the chart:
- Green Line – Lips: Calculated with a 5-period and 3-bar shift, closest to current price, highly sensitive to short-term changes, and signals early reversals;
- Red Line – Teeth: Defined with an 8-period and 5-bar shift, representing the medium-term phase, often acting as a balance point between short and long-term trends;
- Blue Line – Jaw: Calculated with a 13-period and 8-bar shift, representing long-term market direction, further from price, acting as the backbone of the indicator.
Signaling with the Alligator Indicator in Binary Options; Alligator Indicator Training
The Alligator Indicator is based on three Smoothed Moving Averages (SMMA) and creates a dynamic structure that transparently and reliably displays market trends.
It organizes price movements into three distinct parts, with each line playing a specific role in analyzing price behavior.
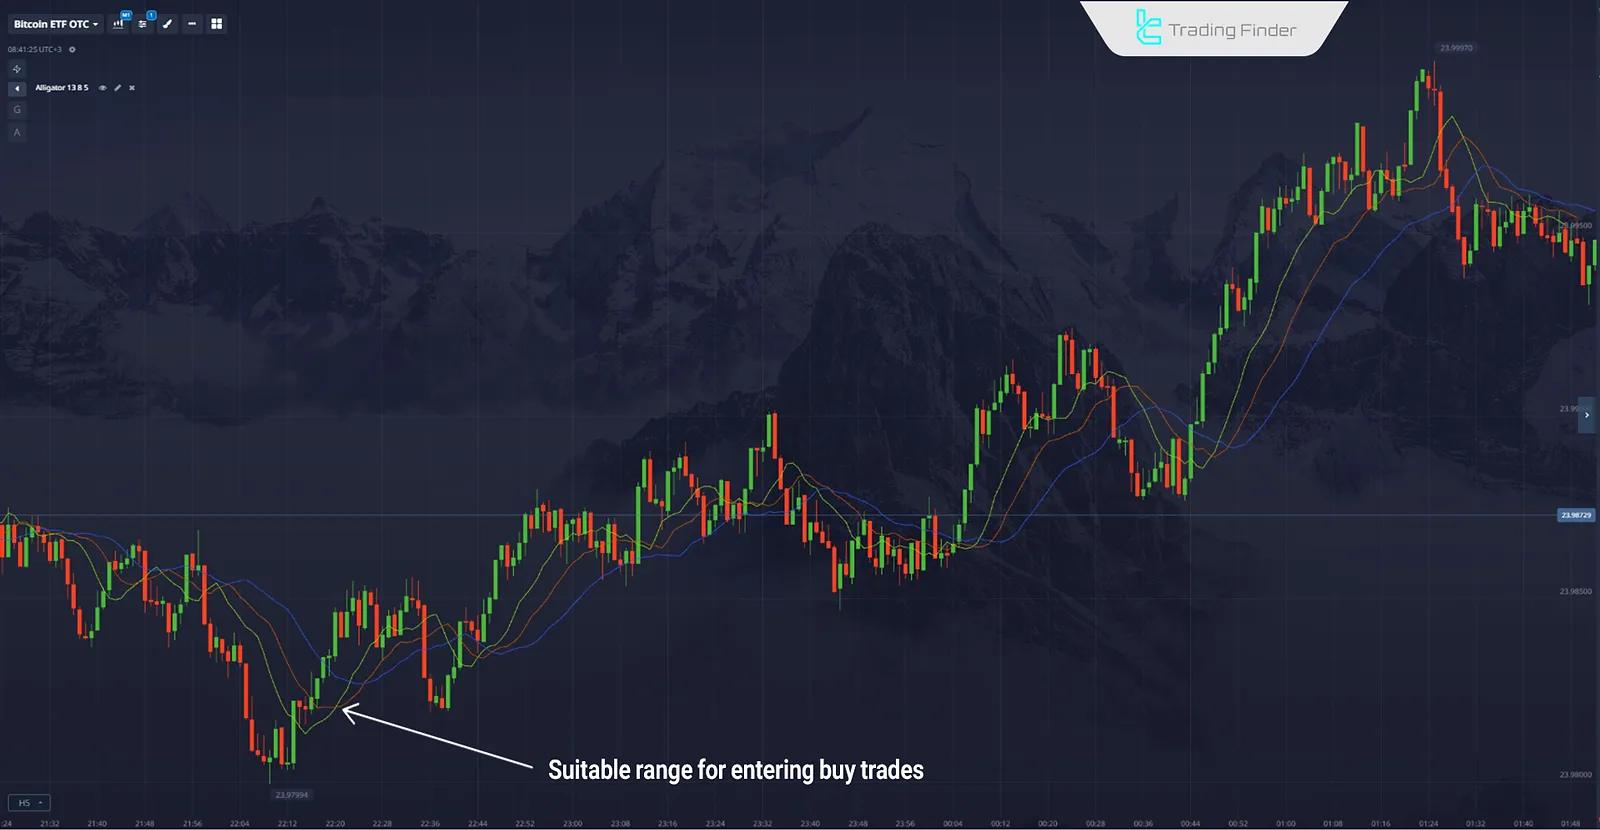
Alligator Indicator Signals in a Bullish Market (Binary Options)
In an uptrend, when the green line (Lips) is above the red line (Teeth), and the Teeth are also above the blue line (Jaw), the market offers a suitable zone for entering buy trades.
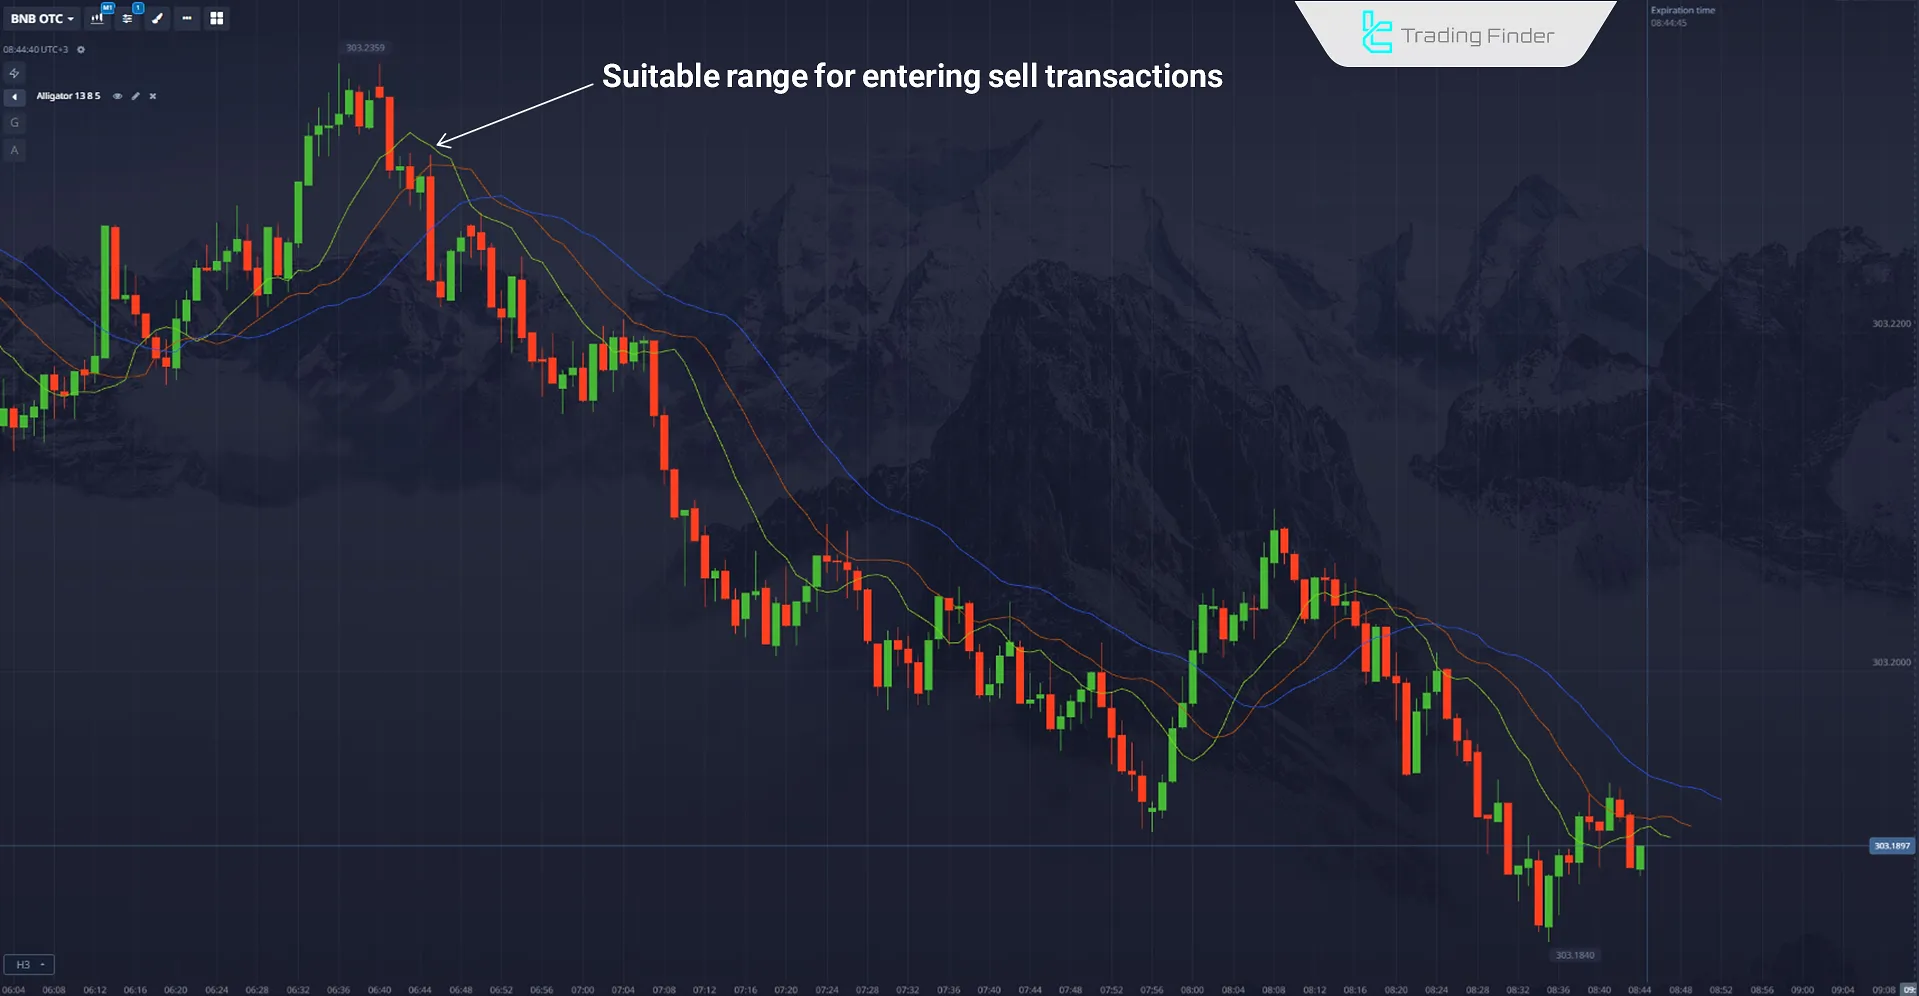
Alligator Indicator Signals in a Bearish Market (Binary Options)
In a downtrend, the Alligator Strategy shows the following line sequence, Jaw on top, Teeth in the middle, and Lips at the bottom.
This arrangement signals a bearish phase. When the three lines come closer or intertwine, the market enters consolidation, lacking a clear trend.
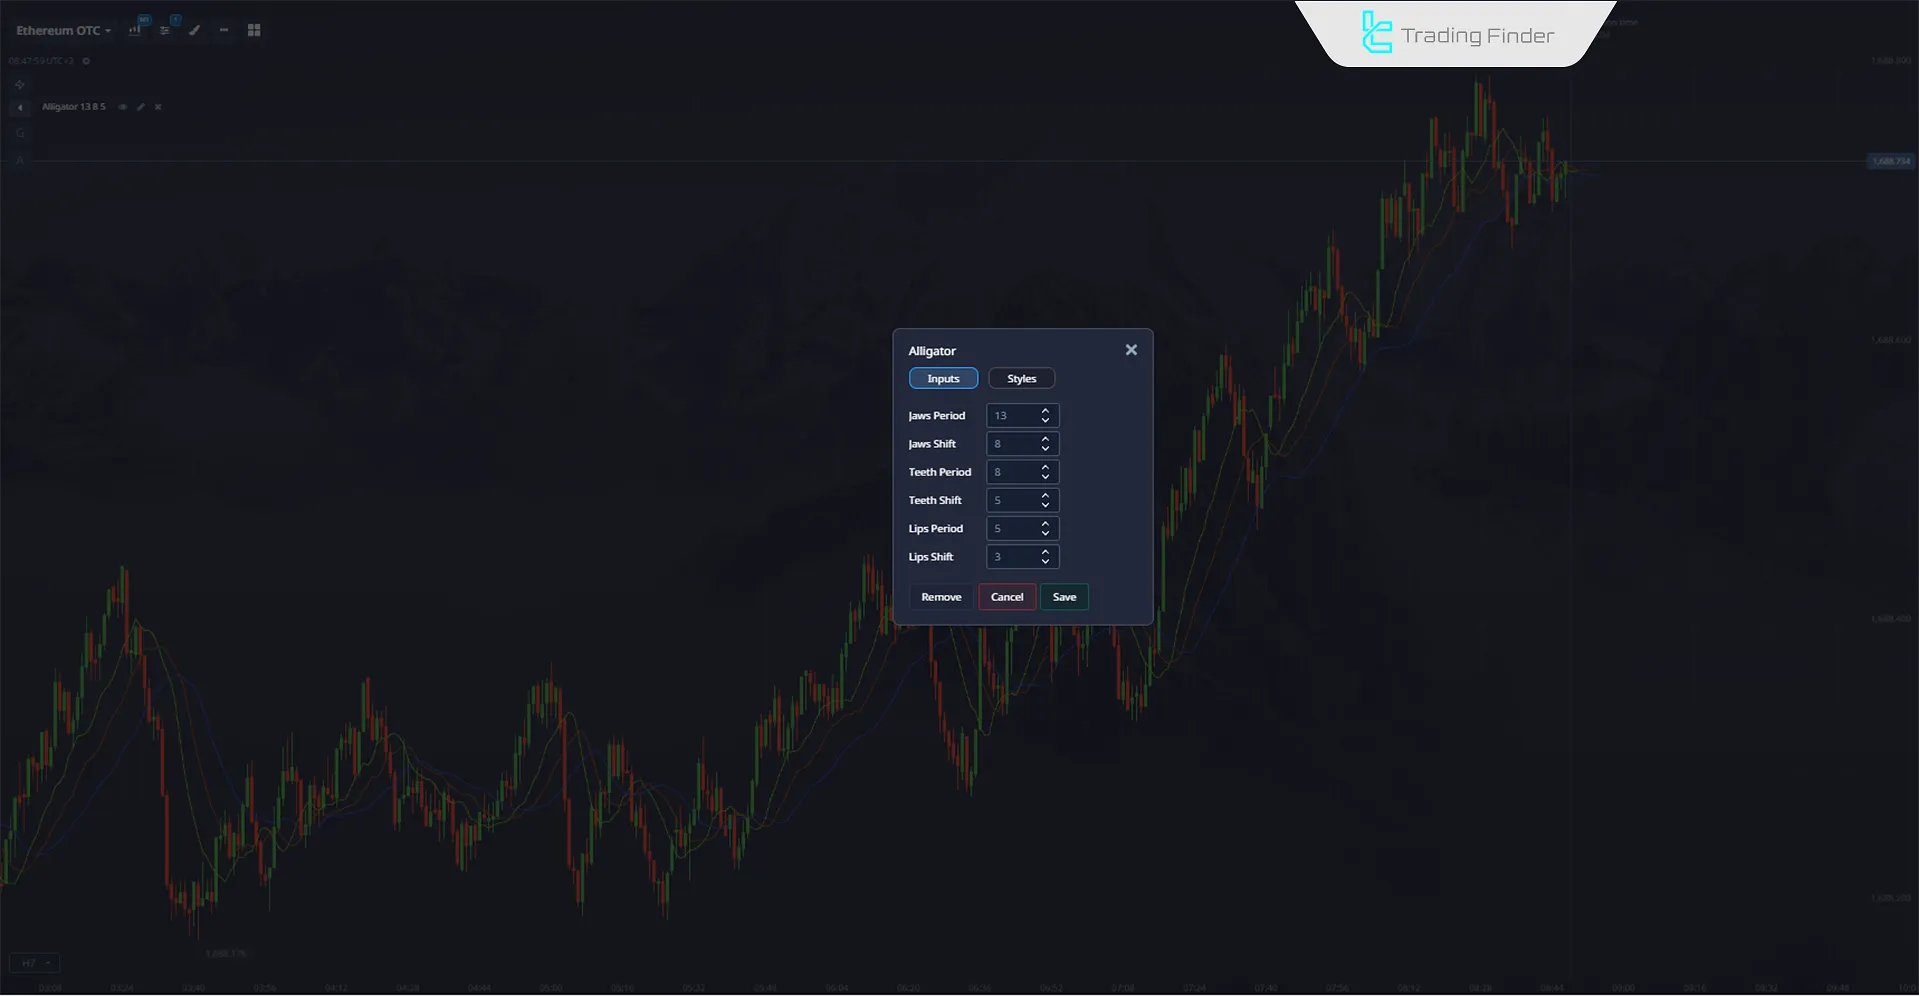
How to Apply and Configure the Alligator Indicator in Binary Options؟
To use the Alligator Indicator Training in Binary Options, select it from the indicators section of your trading platform and activate it on the chart. After execution, the three main lines (Jaw, Teeth, Lips) appear, each calculated based on moving averages.
Calculation Formula of the Williams Alligator Indicator in Binary Options
The Alligator is calculated using the Smoothed Moving Average (SMMA).
Each line is derived from the same formula but with different periods and shifts:
- Jaw (blue line): SMMA (Median Price, 13) shifted 8 bars ahead
- Teeth (red line): SMMA (Median Price, 8) shifted 5 bars ahead
- Lips (green line): SMMA (Median Price, 5) shifted 3 bars ahead

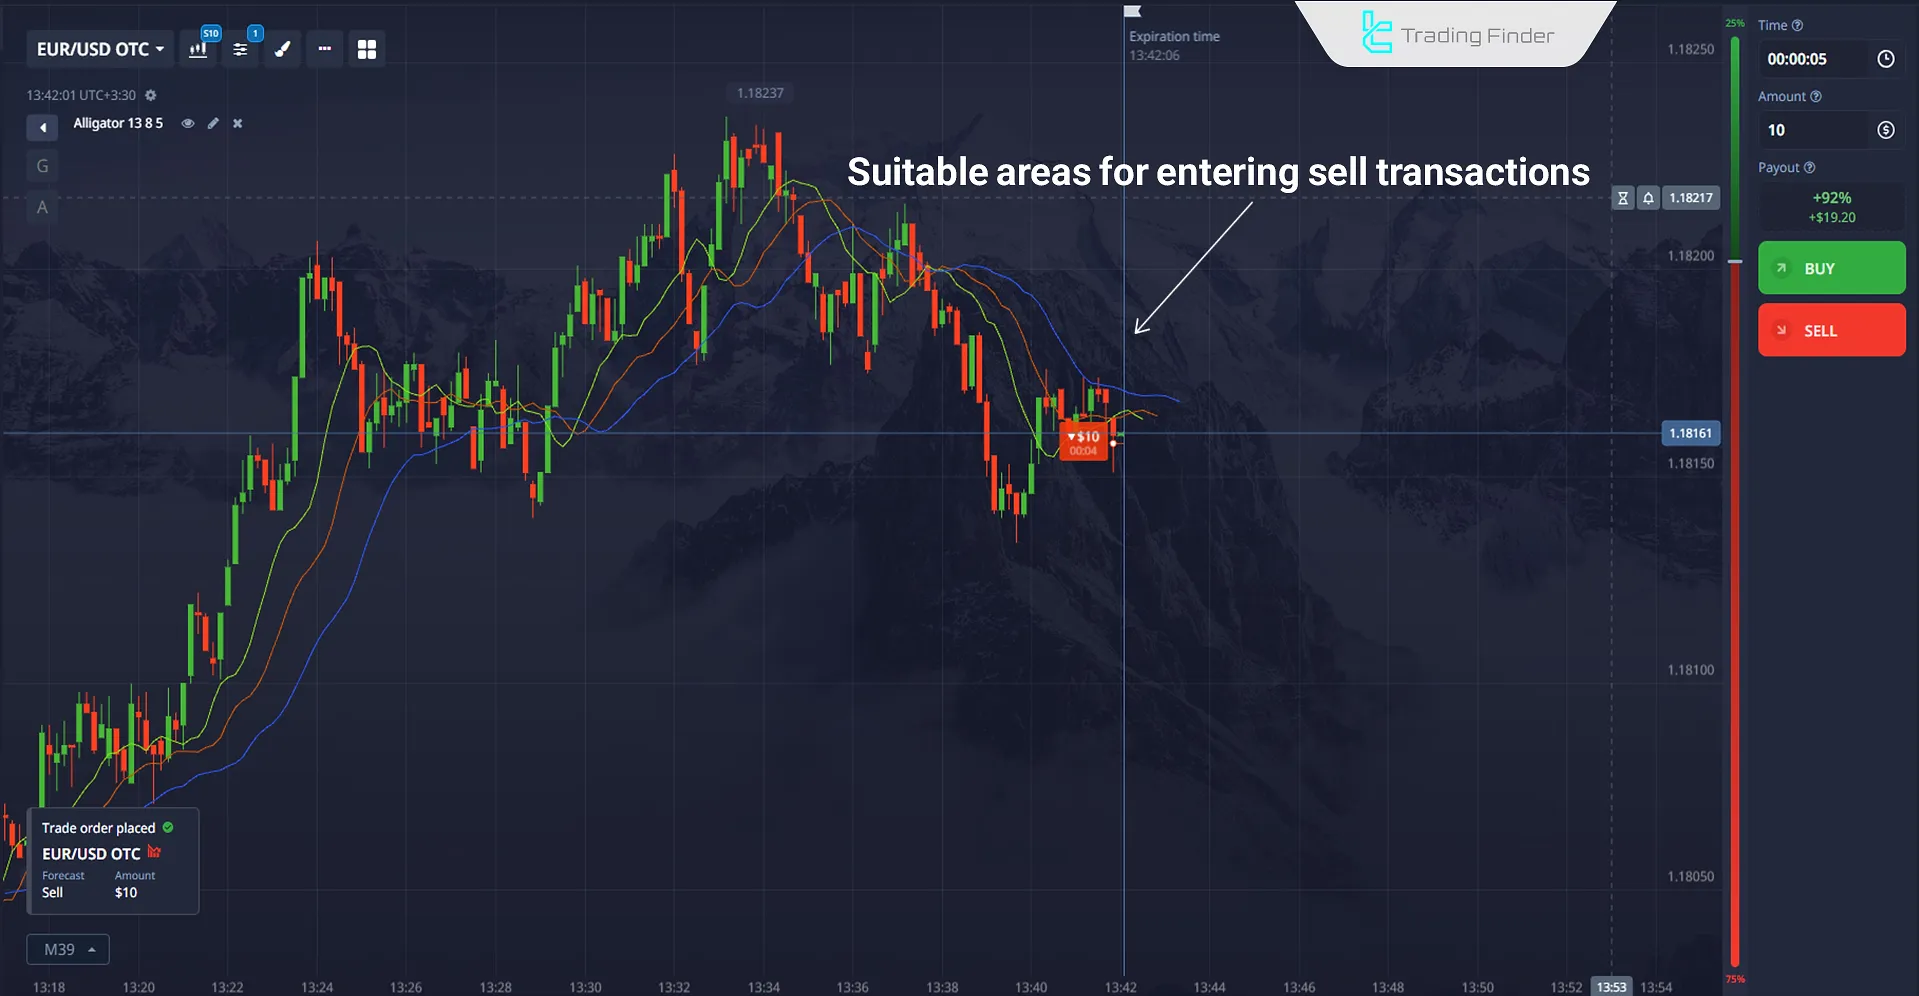
Example of the Alligator Indicator in Binary Options
The chart below shows the EUR/USD currency pair on a 10-minute timeframe.
Here, the Lips, Teeth, and Jaw lines are intertwined, and as the Jaw line diverges, a valid zone for sell trades is formed.
Alternatives to the Alligator Indicator in Binary Options
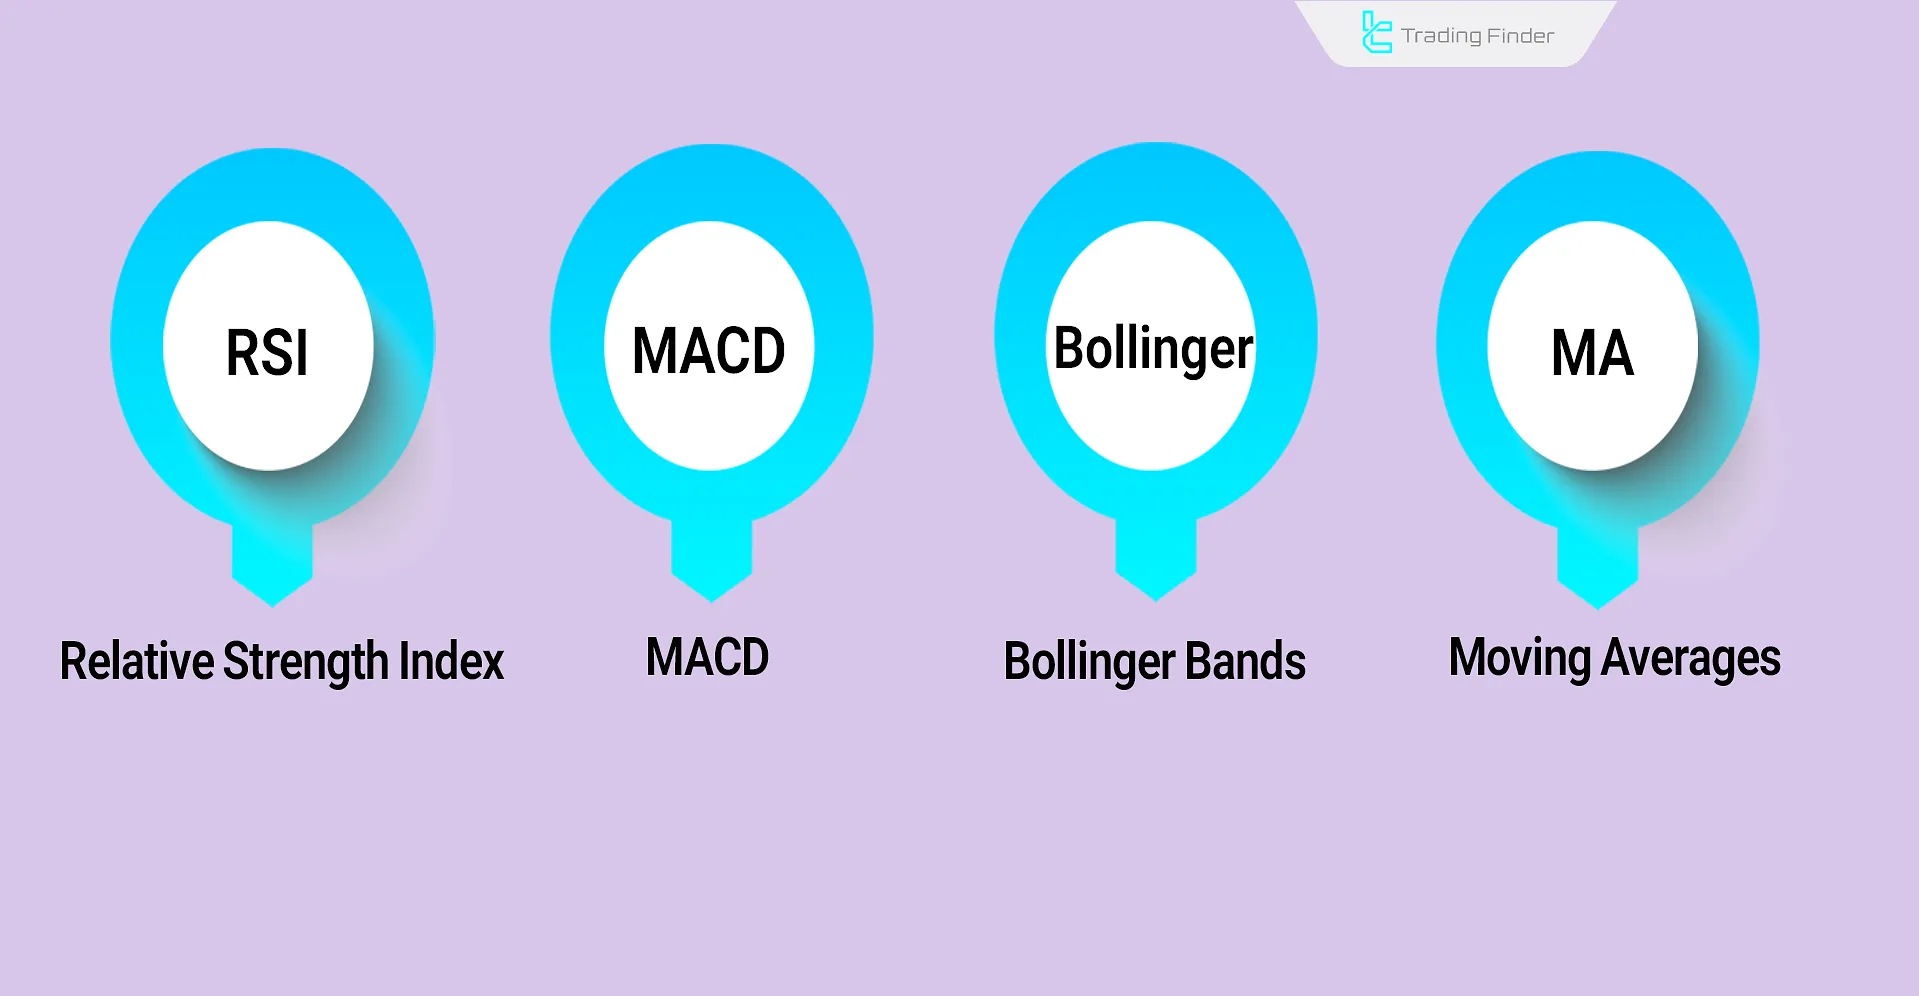
Although the Alligator is useful, binary options traders can use other indicators as alternatives or complements:
- Relative Strength Index (RSI): Momentum oscillator that highlights overbought and oversold zones;
- MACD: Popular tool for detecting momentum shifts, moving average crossovers, and confirming bullish/bearish trends;
- Bollinger Bands: Volatility tool showing overbought and oversold conditions through upper and lower bands;
- Simple & Exponential Moving Averages: Basic tools for trend recognition and short-term noise filtering.
Replacing the Alligator Indicator with RSI in Binary Options
The Relative Strength Index (RSI) is a practical alternative to the Alligator Indicator in binary trading. It measures the speed and magnitude of price changes, identifying overbought and oversold zones.
Signals from RSI provide potential reversal points and optimal trade entries/exits. Key levels 30 and 70 offer precise benchmarks for gauging buyer and seller strength.
RSI Multi Length Indicator
The RSI Multi Length Indicator on MetaTrader 4 and 5 is one of the advanced versions of the Relative Strength Index, providing a multidimensional approach to market analysis.
Unlike the classic version, which only evaluates a single period, this tool simultaneously calculates multiple RSI periods and displays the results in the form of a dynamic histogram.
This multilayered structure enables the identification of overbought and oversold conditions across different market levels, offering traders a clearer picture of trend strength.
The internal histogram of the indicator shows the intensity of buying or selling pressure with distinct color coding:
- In shorter timeframes such as M30, a red color indicates seller dominance and the possibility of a price rebound upward after leaving the oversold zone.
- Conversely, in longer timeframes such as H4, a green histogram in the overbought zone often signals weakening bullish momentum and a potential reversal to the downside.
The multi-timeframe capability of this indicator allows analysts to examine overlapping signals across different intervals, leading to more precise decision-making.
The settings section of this tool offers high flexibility: the user can adjust the minimum and maximum RSI lengths, customize the colors of lines and overbought/oversold levels, and align the signal intensity with their own trading strategy.
- Download RSI Multi Length Indicator for MetaTrader 4
- Download RSI Multi Length Indicator for MetaTrader 5
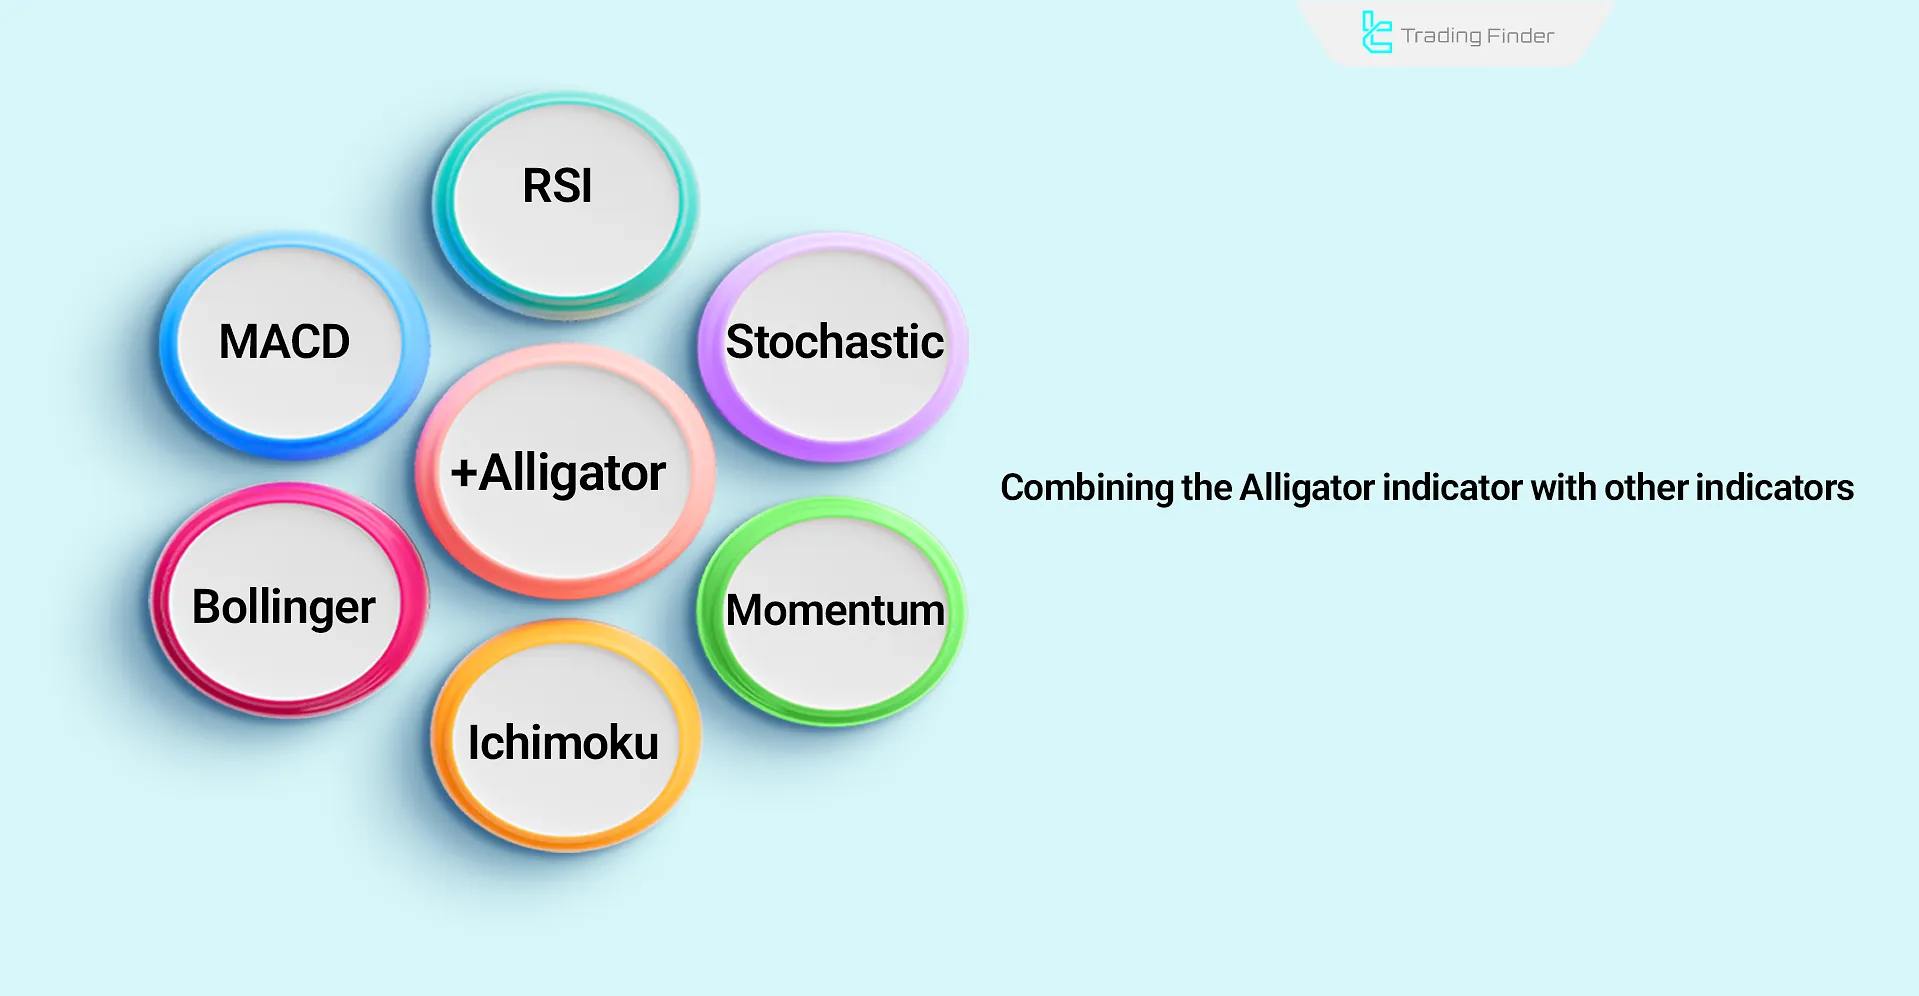
Combining the Alligator Indicator with Other Indicators
The Alligator Indicator alone identifies trends and consolidations, but combining it with other indicators reduces false signals and improves accuracy:
- Alligator + RSI: Identifies trends and simultaneously monitors overbought/oversold levels;
- Alligator + MACD: Enhances bullish/bearish signals by adding momentum confirmation;
- Alligator + Bollinger Bands: Evaluates both volatility and trend strength, suitable for short-term binary trades;
- Alligator + Ichimoku: Creates a multi-layered analytical framework combining trend, momentum, and support/resistance;
- Alligator + Momentum: Confirms market direction with Jaw/Teeth/Lips structure and momentum strength;
- Alligator + Stochastic: Adds reversal signal identification to trend detection.
Those interested in using the combination of the Alligator Indicator in Binary Options with the RSI Indicator can refer to the training video on the "TRADE EMPIRE" YouTube channel:
Best Time frame to Use the Alligator Indicator in Binary Options
The Alligator Indicator in Binary Options delivers the highest accuracy when the market is on the verge of exiting a consolidation phase and starting a new trend.
The best timeframes for using this indicator in Binary Options are short intervals such as 1 minute to 15 minutes, as line movements occur more quickly and trading signals form with greater clarity.
Moreover, in highly volatile markets such as major currency pairs or high-volume assets, the generated signals carry greater reliability.
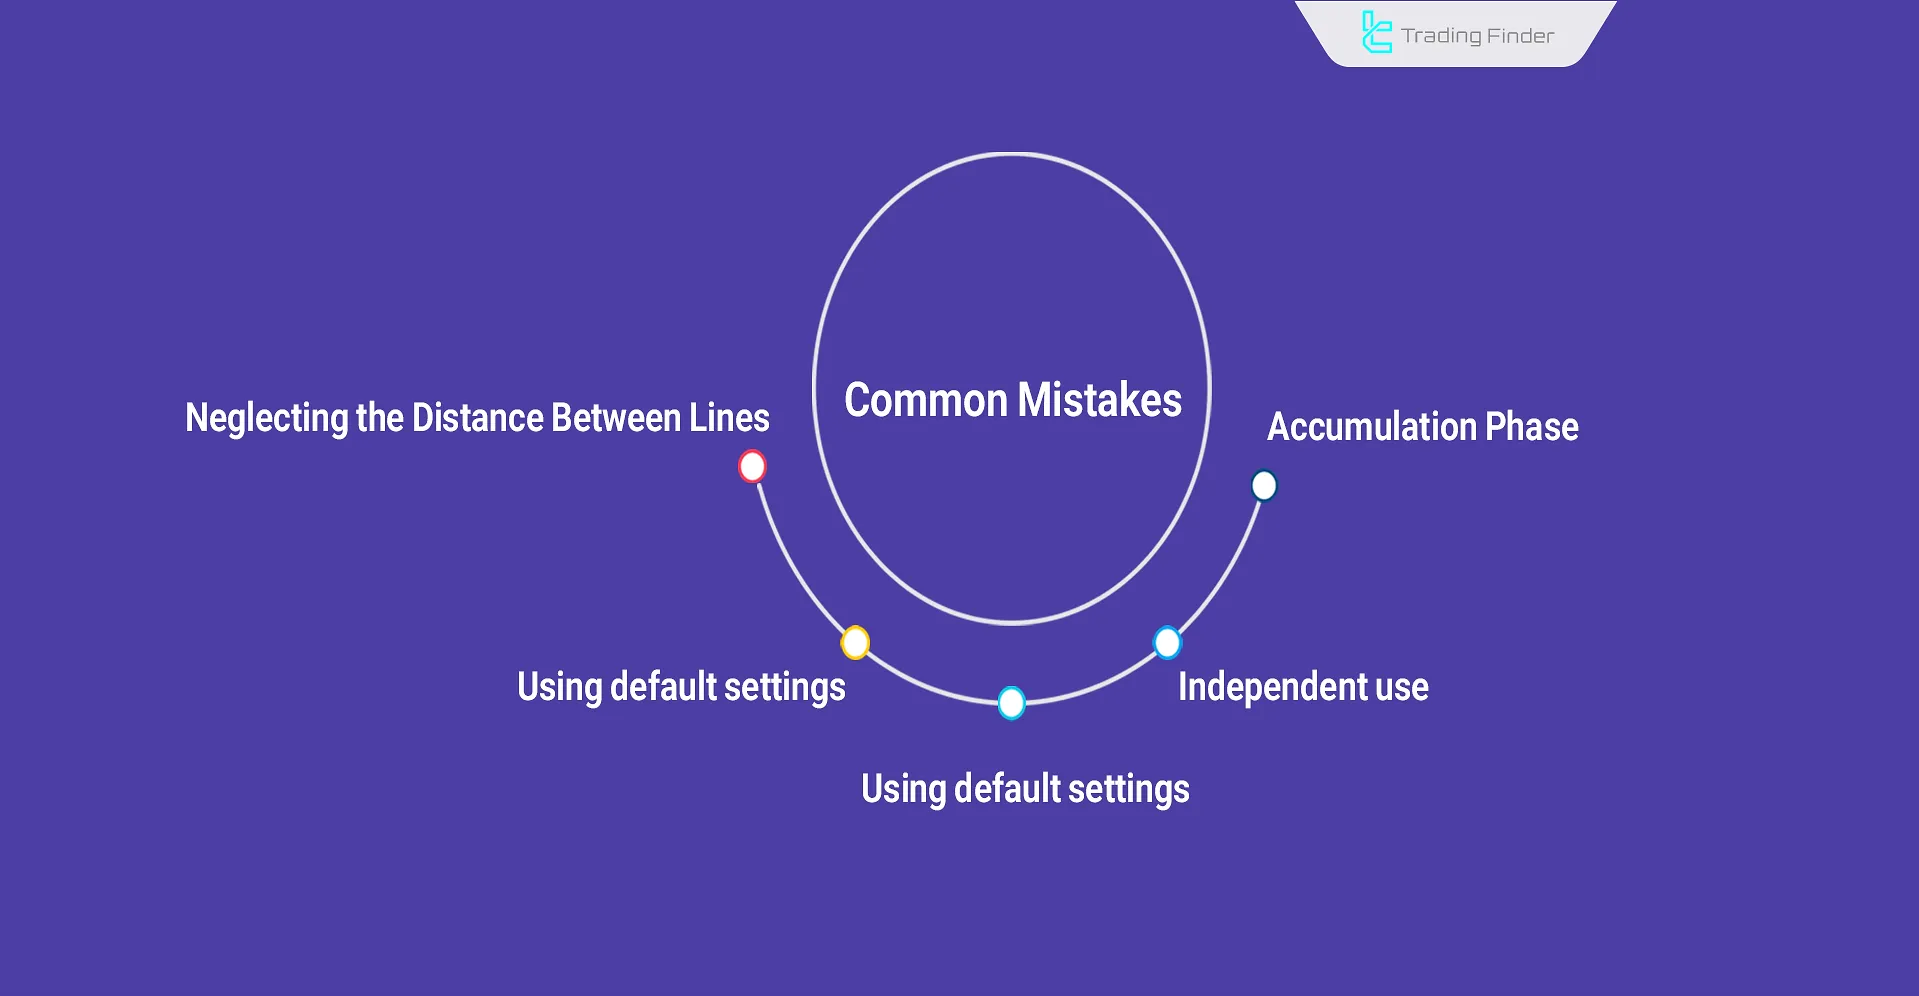
Common Mistakes in Using the Alligator Indicator in Binary Options
Common mistakes in using the Alligator Indicator often include entering trades during consolidation phases, ignoring trend strength, and relying on default settings, as outlined below:
- Trading during consolidation: The lines are intertwined, and the market has no clear trend; therefore, the signals lack sufficient validity;
- Using the indicator independently: Due to the lagging nature of the Alligator, using it without combining it with momentum indicators such as MACD or RSI leads to errors;
- Applying default settings across all timeframes: Each asset and timeframe requires parameter customization, and failing to adjust them can reduce signal accuracy;
- Ignoring risk management: Entering trades solely based on one signal without setting a stop loss may result in heavy losses;
- Overlooking line spacing: The sequence of lines alone is not enough; the distance between them must also be considered to measure trend strength.
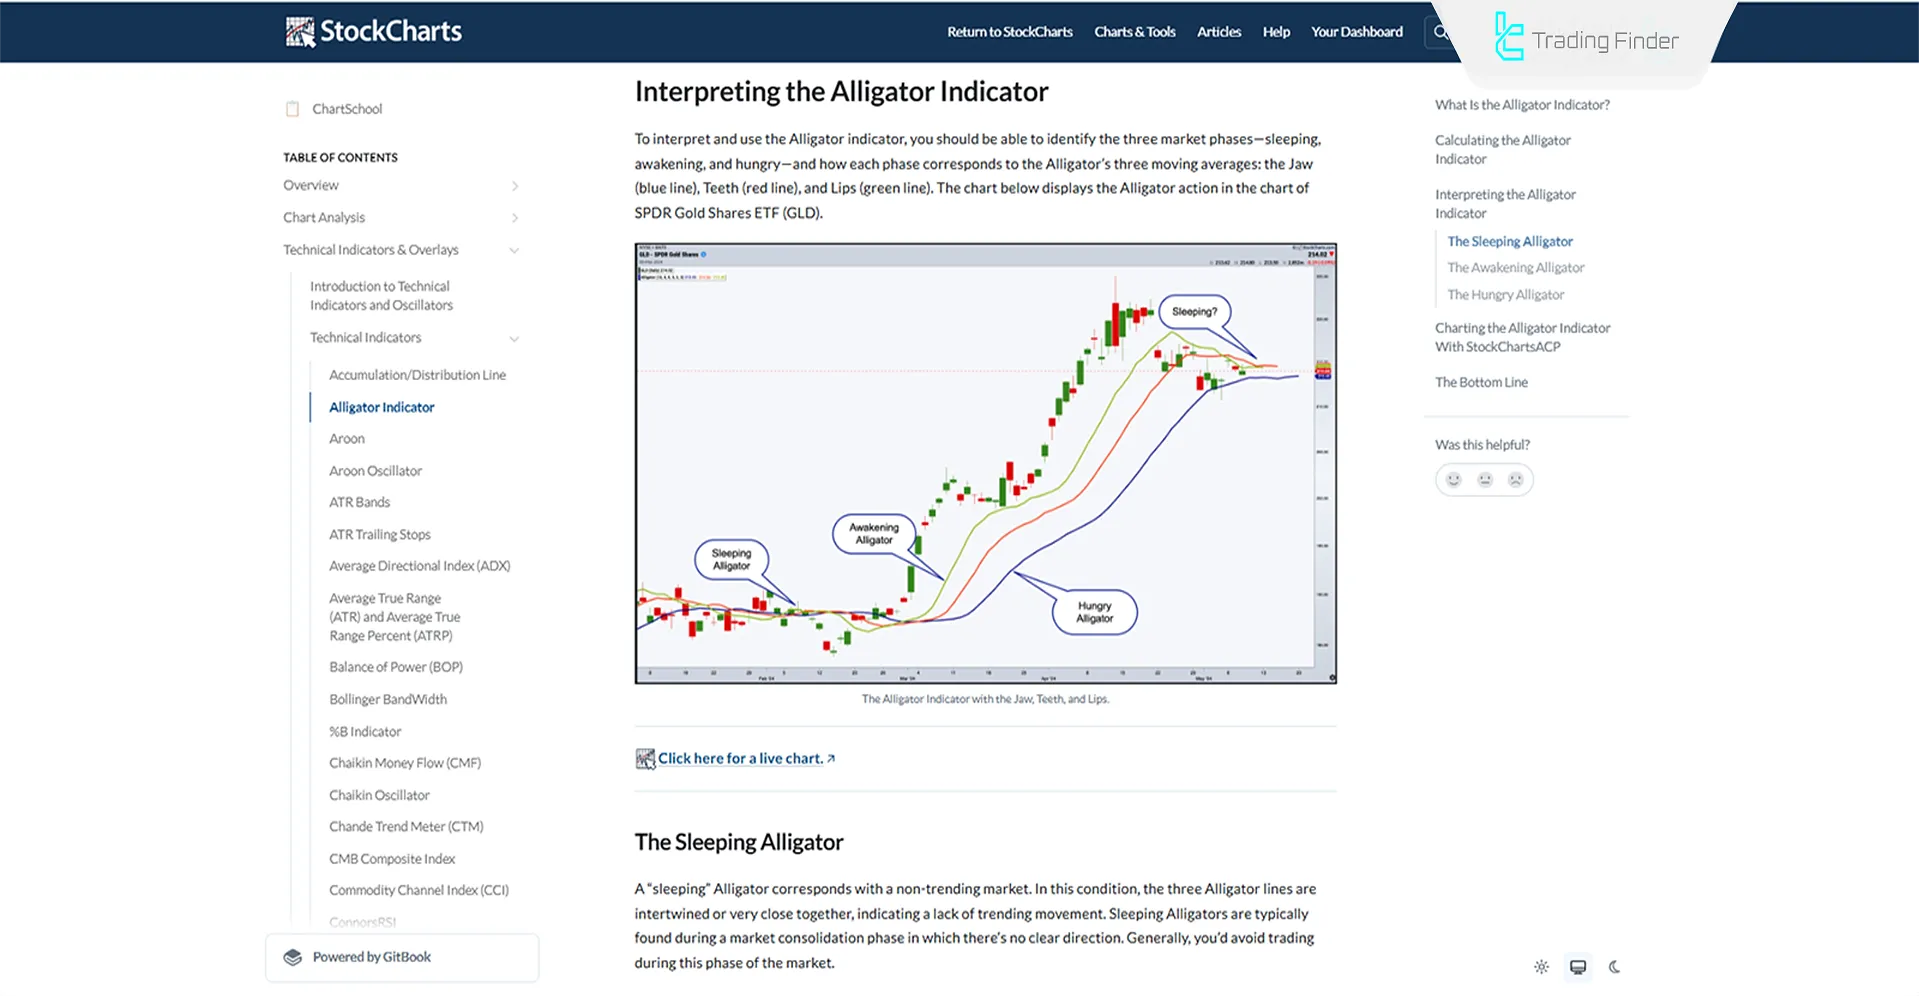
For more information and guidance on how to use the Alligator Indicator in Binary Options, you can also refer to the Alligator Strategy Training in Binary training article on chartschool.stockcharts.com.
Conclusion
The Williams Alligator trading indicator in Binary Options is one of the widely used tools in technical analysis that, with its three-line structure, illustrates market conditions in the form of trends or consolidations.
By combining the Jaw, Teeth, and Lips, this indicator enables the identification of entry and exit points in Binary Options trading.
The primary application of the Alligator is in confirming trends and analyzing momentum strength; however, during non-trending phases, there is a possibility of generating false signals.
Additionally, to increase accuracy, it is recommended to combine this indicator with tools such as MACD and the Relative Strength Index (RSI) to filter and validate signals.


