


- TradingFinder
- Education
- Forex Education
- Candlestick Charts Education
Candlestick Charts Education
Candlestick charts are among the most widely used technical Analysis tools, displaying open, close, high, and low prices within a specific timeframe. Candlestick patterns enable traders to detect market sentiment changes and identify potential reversal or continuation points. Candlestick patterns fall into two categories. Reversal patterns such as Pin Bar, Engulfing, Hanging Man, and Doji typically appear at key support and resistance levels, signaling trend reversals. Continuation patterns such as Three White Soldiers and Three Black Crows indicate trend continuation. Integrating candlestick patterns with volume Analysis, liquidity zones, and price action confirmations improves analytical accuracy. On TradingFinder, traders have access to free training on correctly identifying candlestick patterns, integrating them with other technical methods, and applying them in different timeframes.
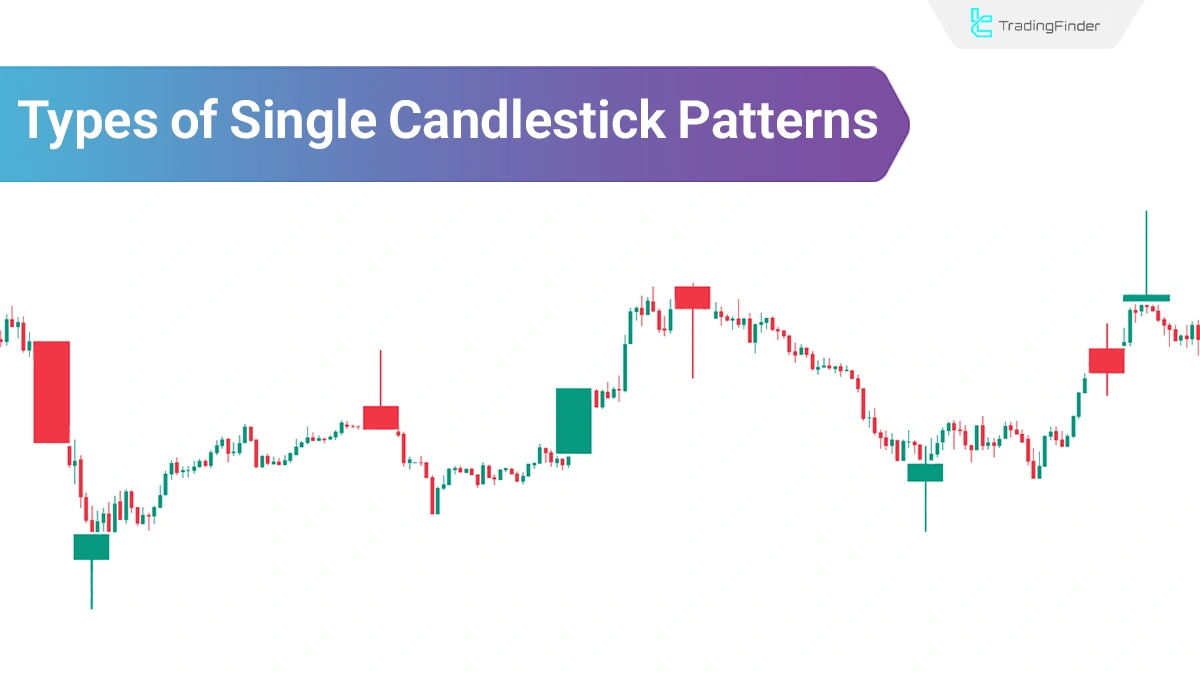
Single Candlestick Patterns Explained: Bullish & Bearish (Beginner Guide)
Single candlestick patterns are recognized as basic yet impactful tools in technical analysis, and with the formation of just one...
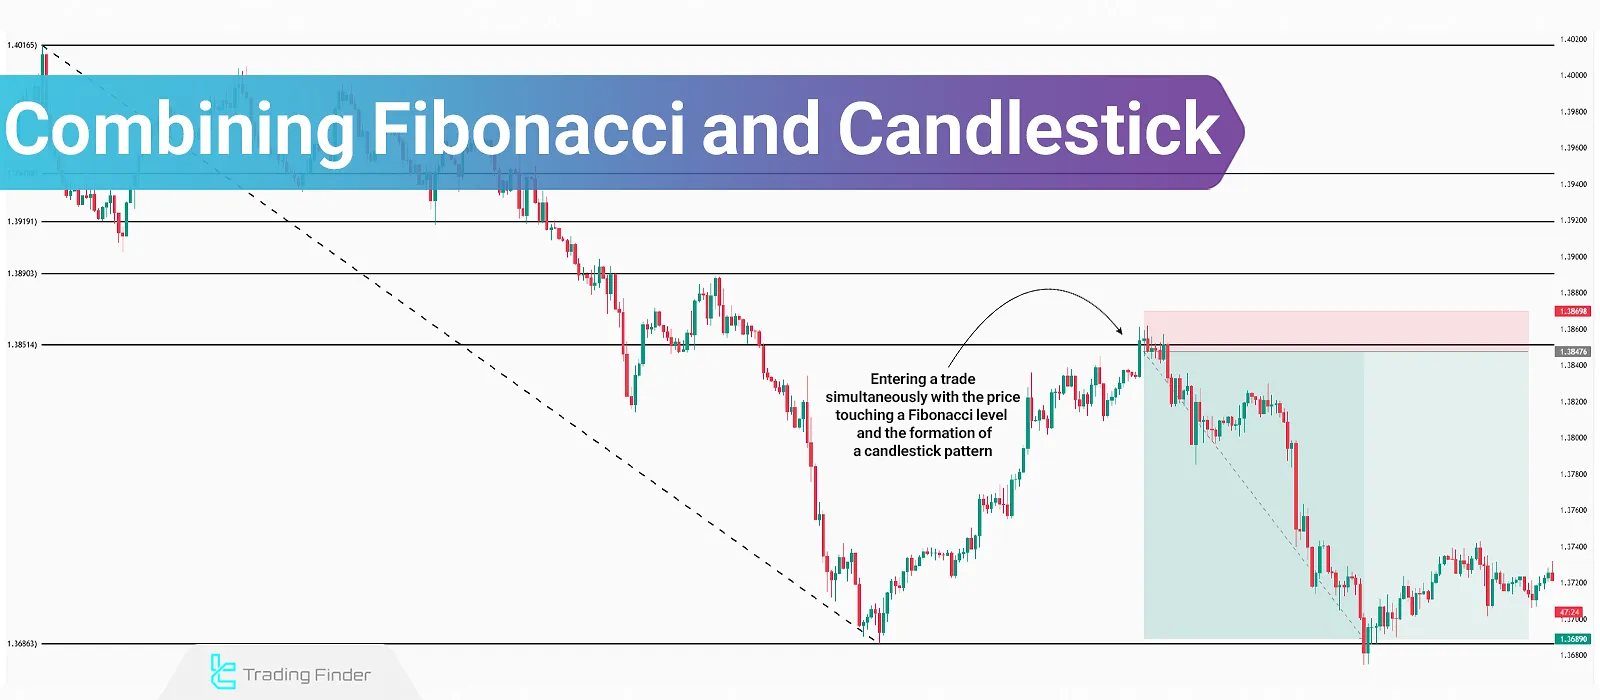
Combining Fibonacci and Candlestick – Best Candlestick Patterns for Fibonacci
The Fibonacci tool offers high compatibility with other technical analysis concepts such as support and resistance, classic...
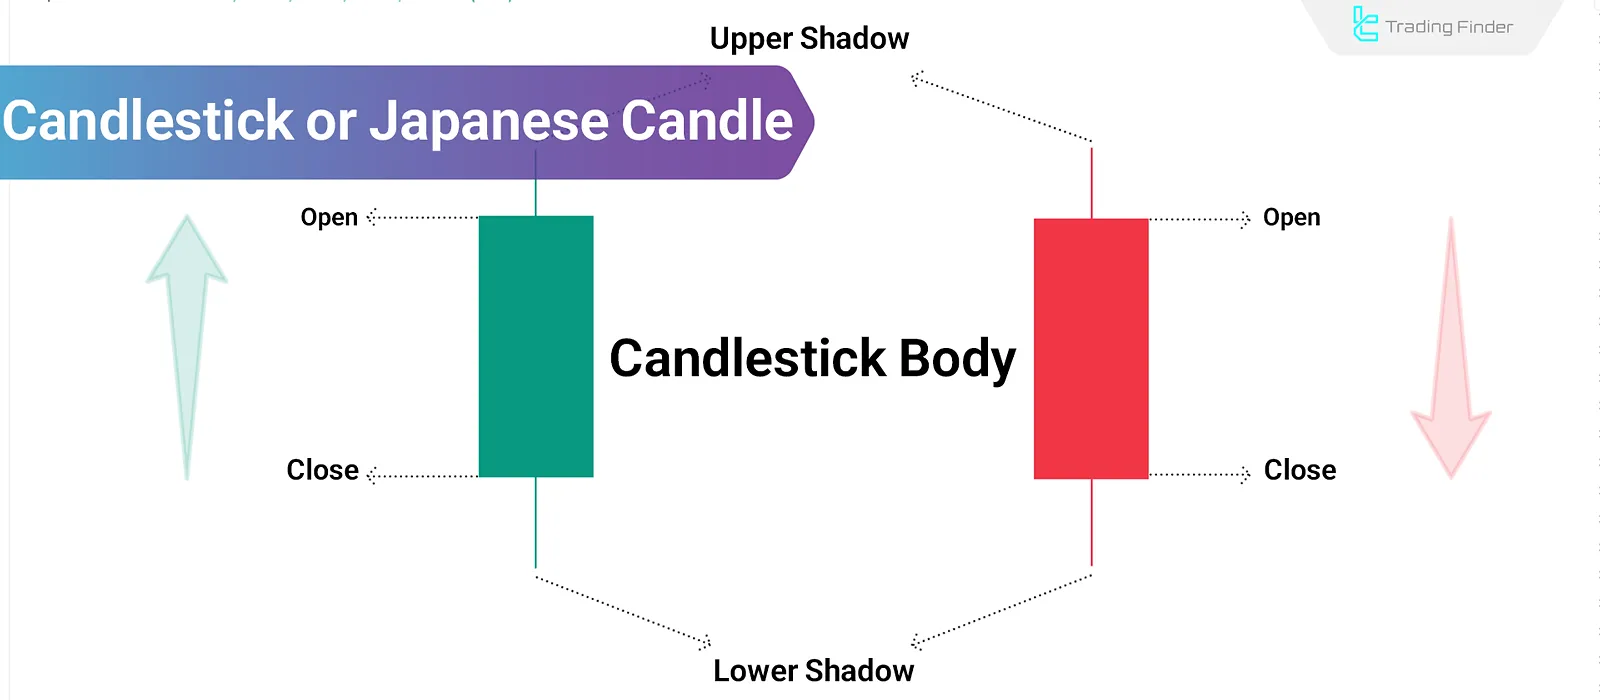
Candlestick or Japanese Candlestick Chart: Visual Language of Financial Markets
Candlesticks or Japanese Candlestick Charts are the foundation of technical analysis in financial markets. These charts visually and...
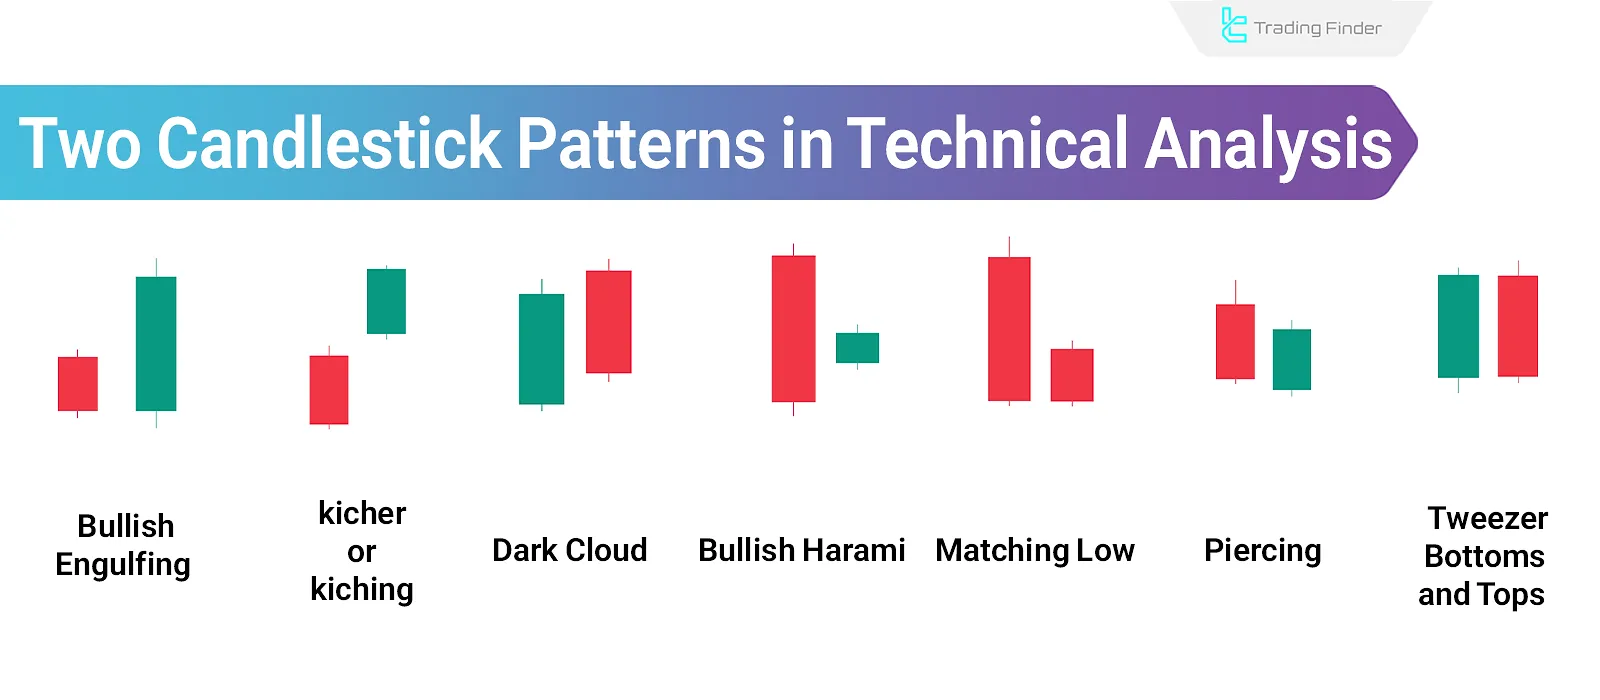
Dual Candlestick Patterns; 9 Important Two-Candle Patterns in Technical Analysis
Dual Candlestick Patterns represent potential trend reversals in the market based on the relationship between two adjacent candles....
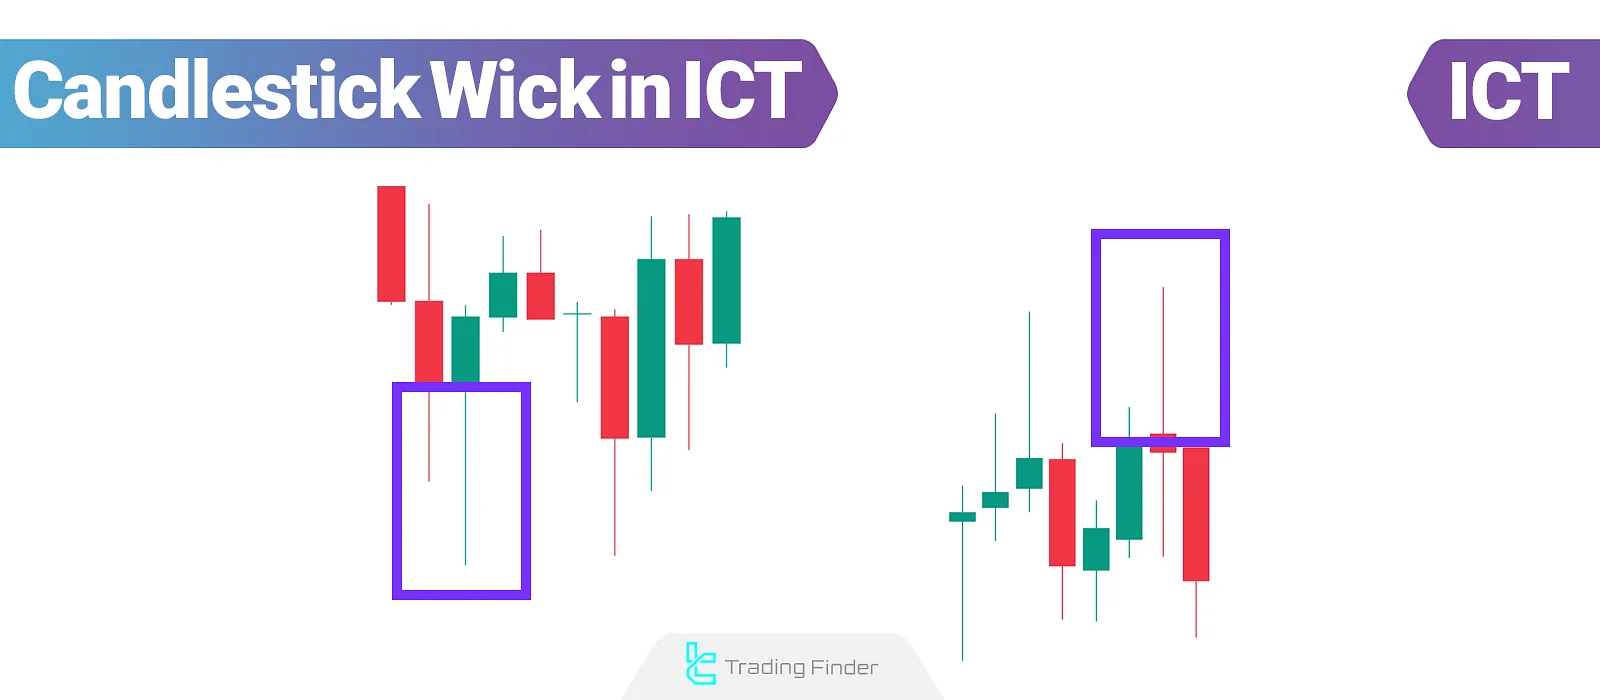
Candlestick wicks in ICT; a Guide to Identifying Market Reversals
The candlestick shadow in ICT reveals is a precise depiction of the market's reaction to key levels and its behavior relative to...
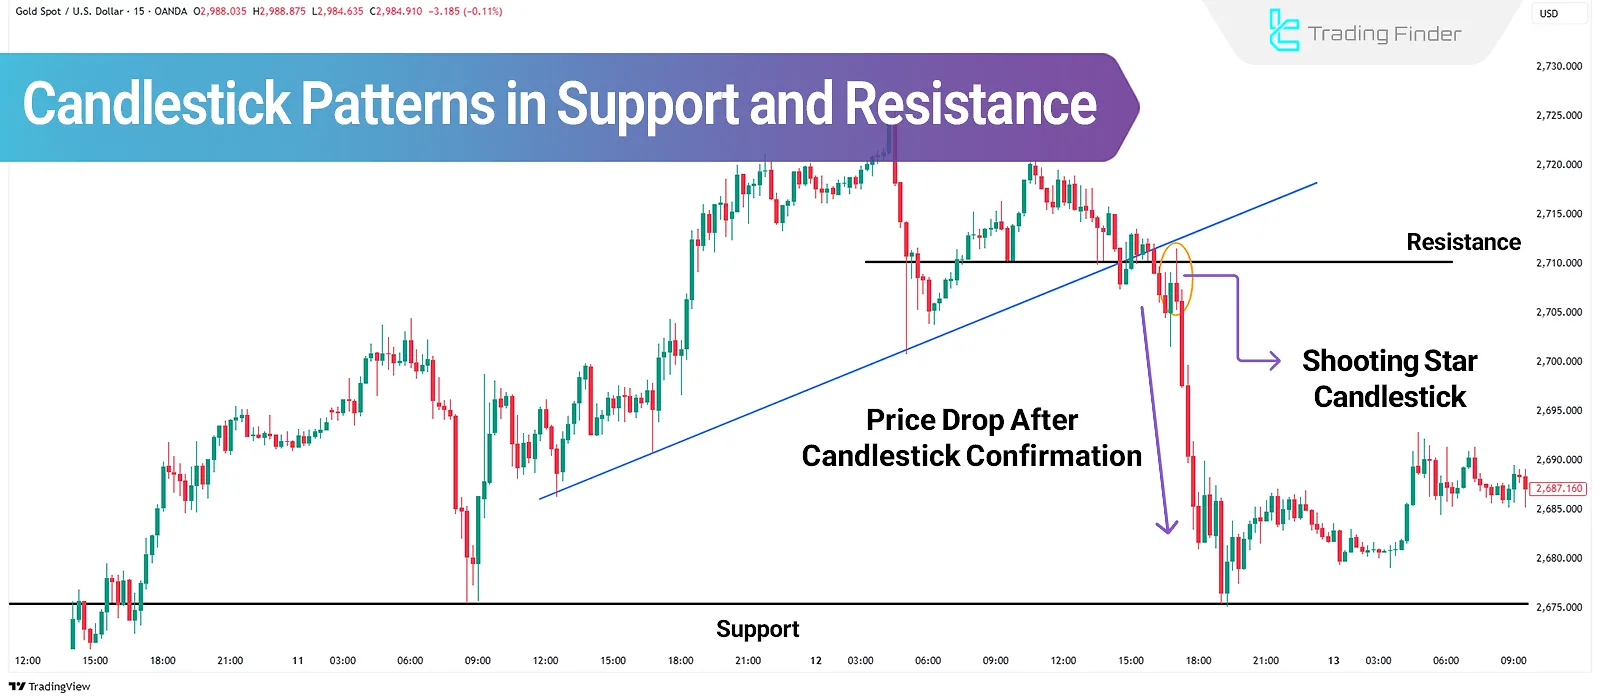
Candlestick Patterns in Support and Resistance; Candle Pattern Trading at S/R
Candlestick patterns, as the foundation of Price Action analysis, reflect order behavior at key supply and demand zones. Combining...
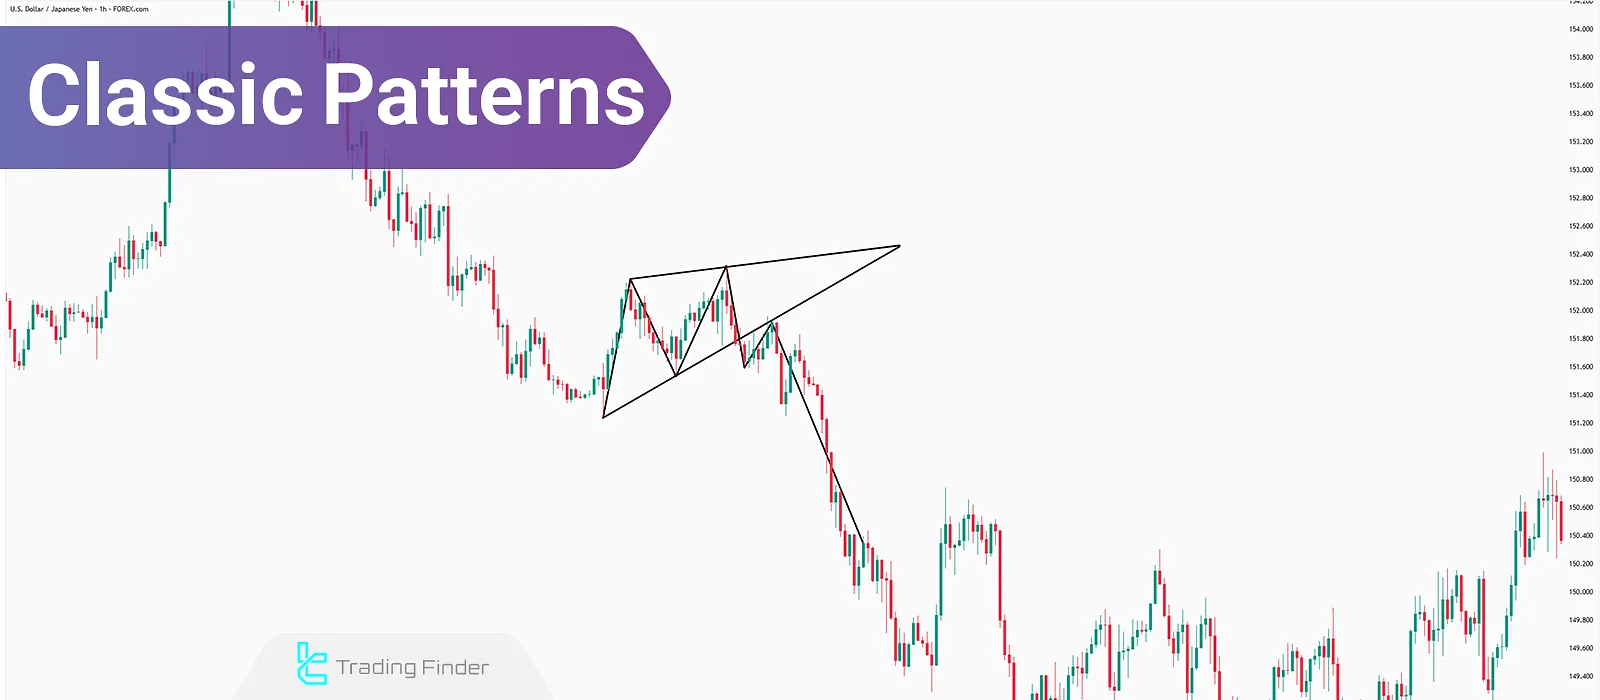
Classic Patterns – The Use of Different Classic Patterns in Technical Analysis
From the alignment of several candlesticks on the price chart, shapes are formed that are known as classic chart pattern in...


