


Harmonic pattern traders use the Deep Crab Pattern to anticipate price reversals. By calculating and identifying points B, A, X, and C using Fibonacci ratios, it's possible to forecast the potential D point and use it as an area for trade entry or exit.
In the Deep Crab pattern, precise identification of Fibonacci ratios is highly important; its structure is based on the XA leg extending to levels between 2.24 and 3.618, and the BC retracement forming between 0.382 and 0.886.
When the price reaches the Potential Reversal Zone (PRZ) or point D, traders look for confirmation signals such as RSI divergence, candlestick patterns, and trading volume.
This area is usually the most probable point of trend reversal, and by placing the stop loss below point X, a trading opportunity with a favorable risk-to-reward ratio is created.
What Is the Deep Crab Pattern?
The Deep Crab Pattern is a reversal pattern in technical analysis that uses Fibonacci ratios to identify price turning points. While it functions similarly to the standard crab pattern, its key distinction lies in the level of B point retracement relative to X.
In the Deep Crab Harmonic Pattern, the B point must retrace 88.6% of the XA leg, whereas in a standard crab pattern, this ratio ranges between 38.2% and 61.8%. This pattern typically forms at the end of trends.
To identify this pattern, don’t insist too rigidly on exact Fibonacci levels. Be flexible with prices hovering near key levels to avoid missing trading opportunities based on this pattern.
Pros and Cons of the Deep Crab Pattern
Using the Deep Crab Harmonic Pattern provides traders with very favorable risk-to-reward ratios (R:R). However, like all patterns, it comes with both advantages and disadvantages.
Pros and Cons of the Deep Crab Harmonic Pattern:
Pros | Cons |
Defines accurate entry and exit levels | Requires experience and skill |
Uses Fibonacci levels for confirmation | Needs confirmation from other indicators/tools |
Usable across various financial markets | Prone to misidentification |
How to Identify the Deep Crab Pattern on a Chart?
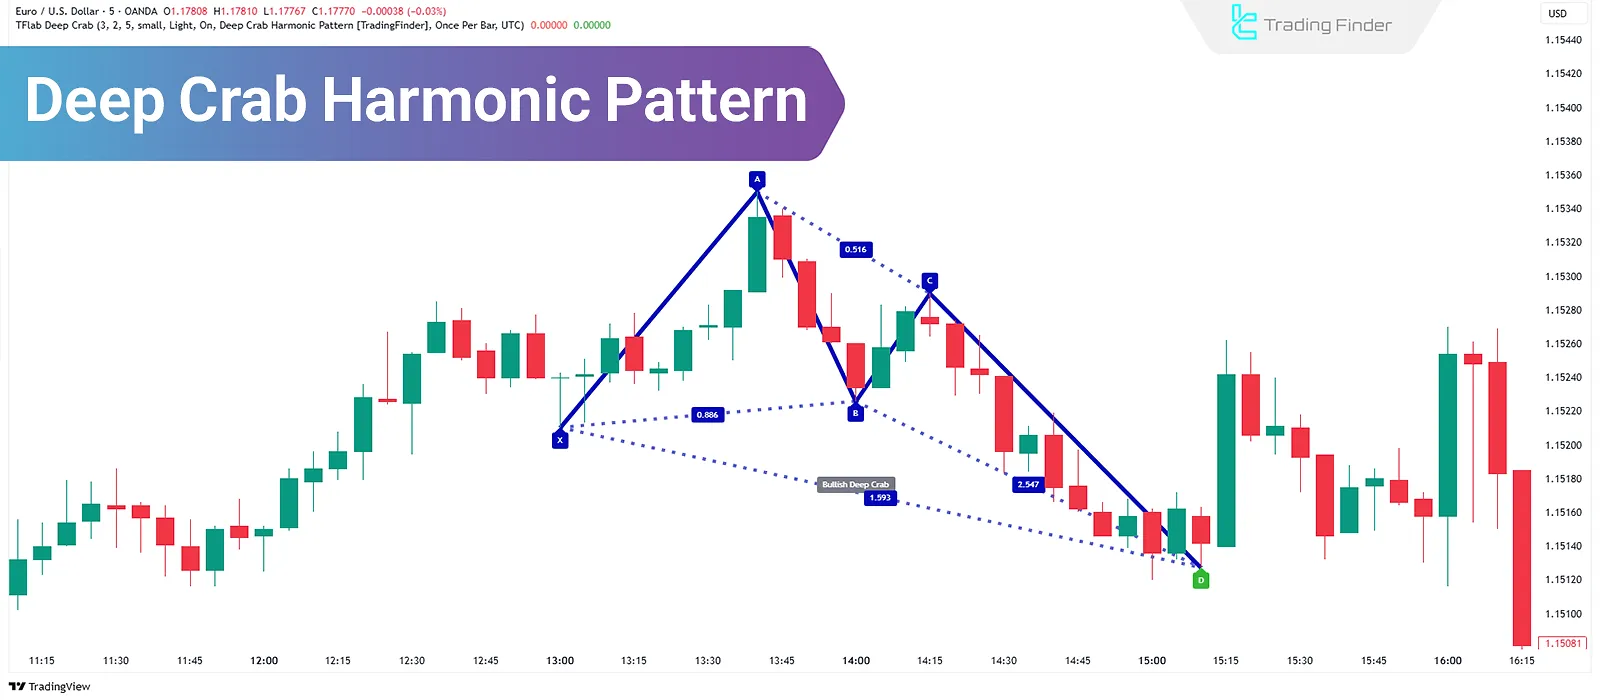
The Deep Crab harmonic pattern structure is identified by five key points including X, A, B, C, and D; It adheres to specific Fibonacci ratios.
Key Ratios for Identifying the Deep Crab Pattern:
- Point B must retrace 88.6% of XA;
- The BC leg may extend 2.24 to 3.618 times the AB leg;
- The CD leg is typically 1.618 times XA or 2.24 to 3.618 times BC.
Flexibility in Identifying the Deep Crab Pattern in Real Markets
In real market conditions, finding a pattern that perfectly adheres to all Fibonacci ratios with mathematical precision is practically difficult.
Therefore, during analysis, the focus should be on Fibonacci zones rather than exact levels. Allowing a small degree of numerical deviation provides greater flexibility in decision-making and helps prevent missing valid trading opportunities.
For better understanding and more accurate identification of the Deep Crab pattern on the chart, you can also refer to the educational video from the Harmonic Patterns YouTube channel:
Example of Identifying the Deep Crab Pattern
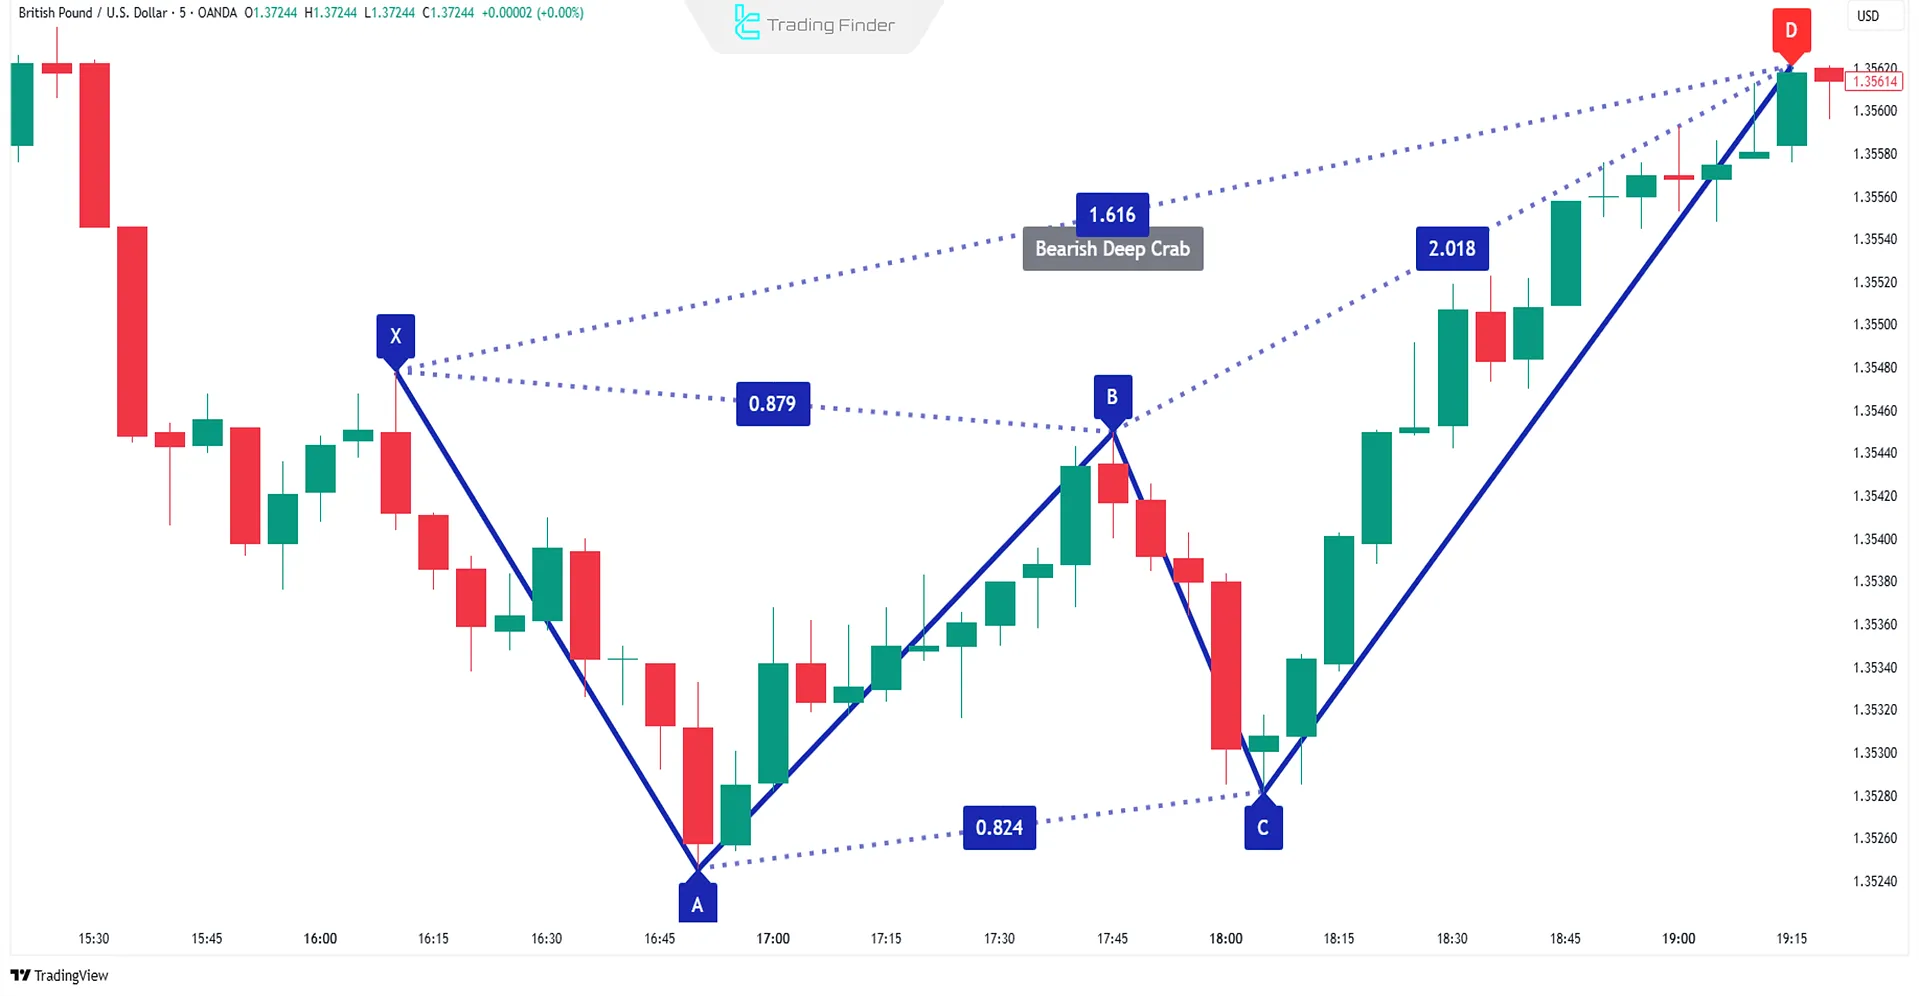
Imagine that on a currency pair chart, a bearish Deep Crab pattern has been identified.
In this pattern, point B is located at the 88.6% retracement level of the XA leg, and point D falls within the 261.8% extension zone of the BC leg. After confirming a reversal candlestick at point D, a sell position is opened.
The stop loss is placed above point D, and the take profit target is set near points A or B.
This example demonstrates that even without perfect alignment of Fibonacci ratios, one can still benefit from the advantages of the pattern by applying proper risk management.
For more information on identifying the Deep Crab pattern, refer to the article 7 harmonic patterns explained on the ig.com website.

Bullish and Bearish Forms of the Deep Crab Pattern
The Deep Crab pattern appears in two variations Bullish Deep Crab and Bearish Deep Crab and is considered one of the most precise patterns in harmonic analysis.
The following table provides a detailed comparison between the bullish and bearish Deep Crab patterns:
Feature | Bullish Deep Crab | Bearish Deep Crab |
Market Direction | Downtrend undergoing correction | Uptrend undergoing correction |
CD Leg Direction | Downward | Upward |
Point D | Located in a support zone below point X | Located in a resistance zone above point X |
XA to D Ratio | Between 2.24 and 3.618 times XA | Between 2.24 and 3.618 times XA |
BC to AB Ratio | Between 0.382 and 0.886 | Between 0.382 and 0.886 |
PRZ Zone | Overlap of Fibonacci levels and a support area | Overlap of Fibonacci levels and a resistance area |
Entry Signal | Price reversal from point D activating a buy position | Price reversal from point D activating a sell position |
Entry Confirmation | Bullish reversal candlestick or positive divergence | Bearish reversal candlestick or negative divergence |
Stop Loss | Slightly below point D | Slightly above point D |
Price Targets | Fibonacci retracement ratios from the CD leg | Fibonacci retracement ratios from the CD leg |
Interpretation | End of a corrective downtrend and start of a bullish trend | End of a corrective uptrend and start of a bearish trend |
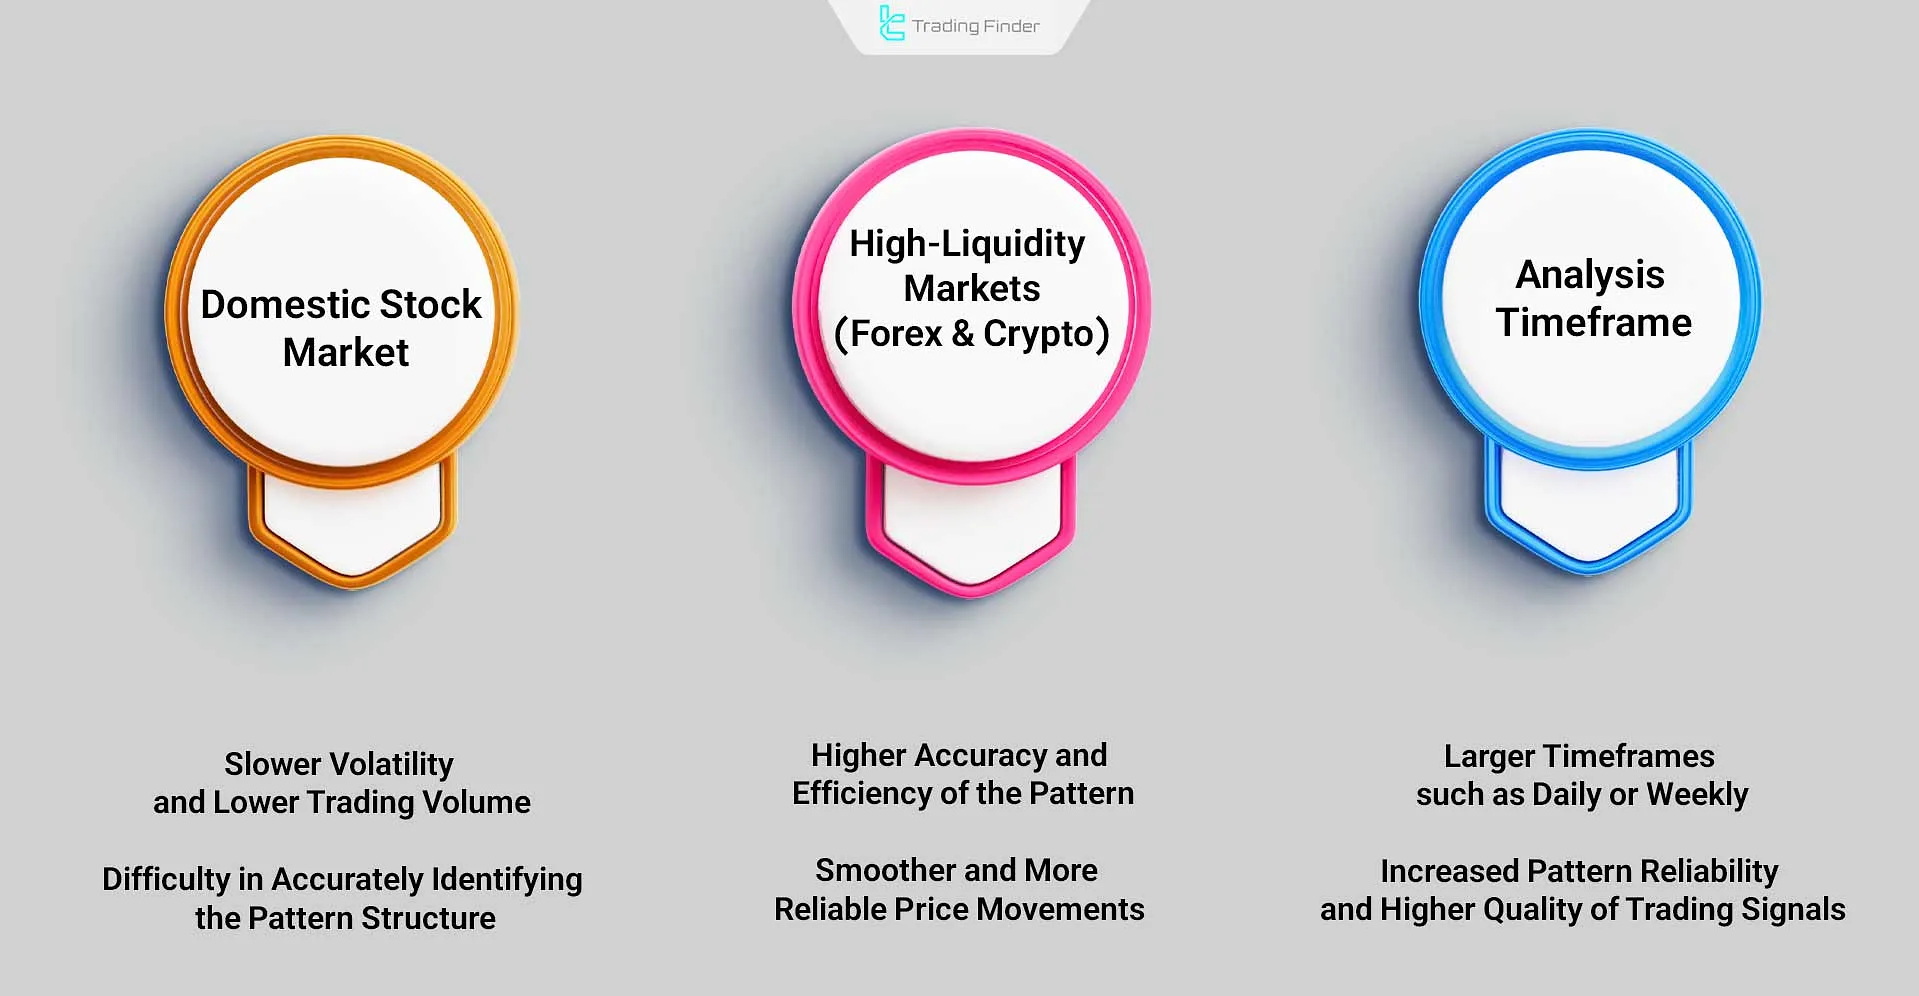
Reliability and Margin of Error of the Deep Crab Pattern in Different Markets
The reliability of the Deep Crab pattern depends on market volatility conditions. This pattern tends to show higher accuracy and effectiveness in highly liquid markets such as Forex and cryptocurrency, where price movements are smoother and more consistent.
In contrast, in domestic stock markets where price fluctuations are usually slower and trading volumes are lower precisely identifying the pattern’s structure becomes more challenging.
However, the larger the timeframe used for analysis (such as daily or weekly charts), the greater the likelihood of detecting a valid pattern and improving the quality of trading signals.
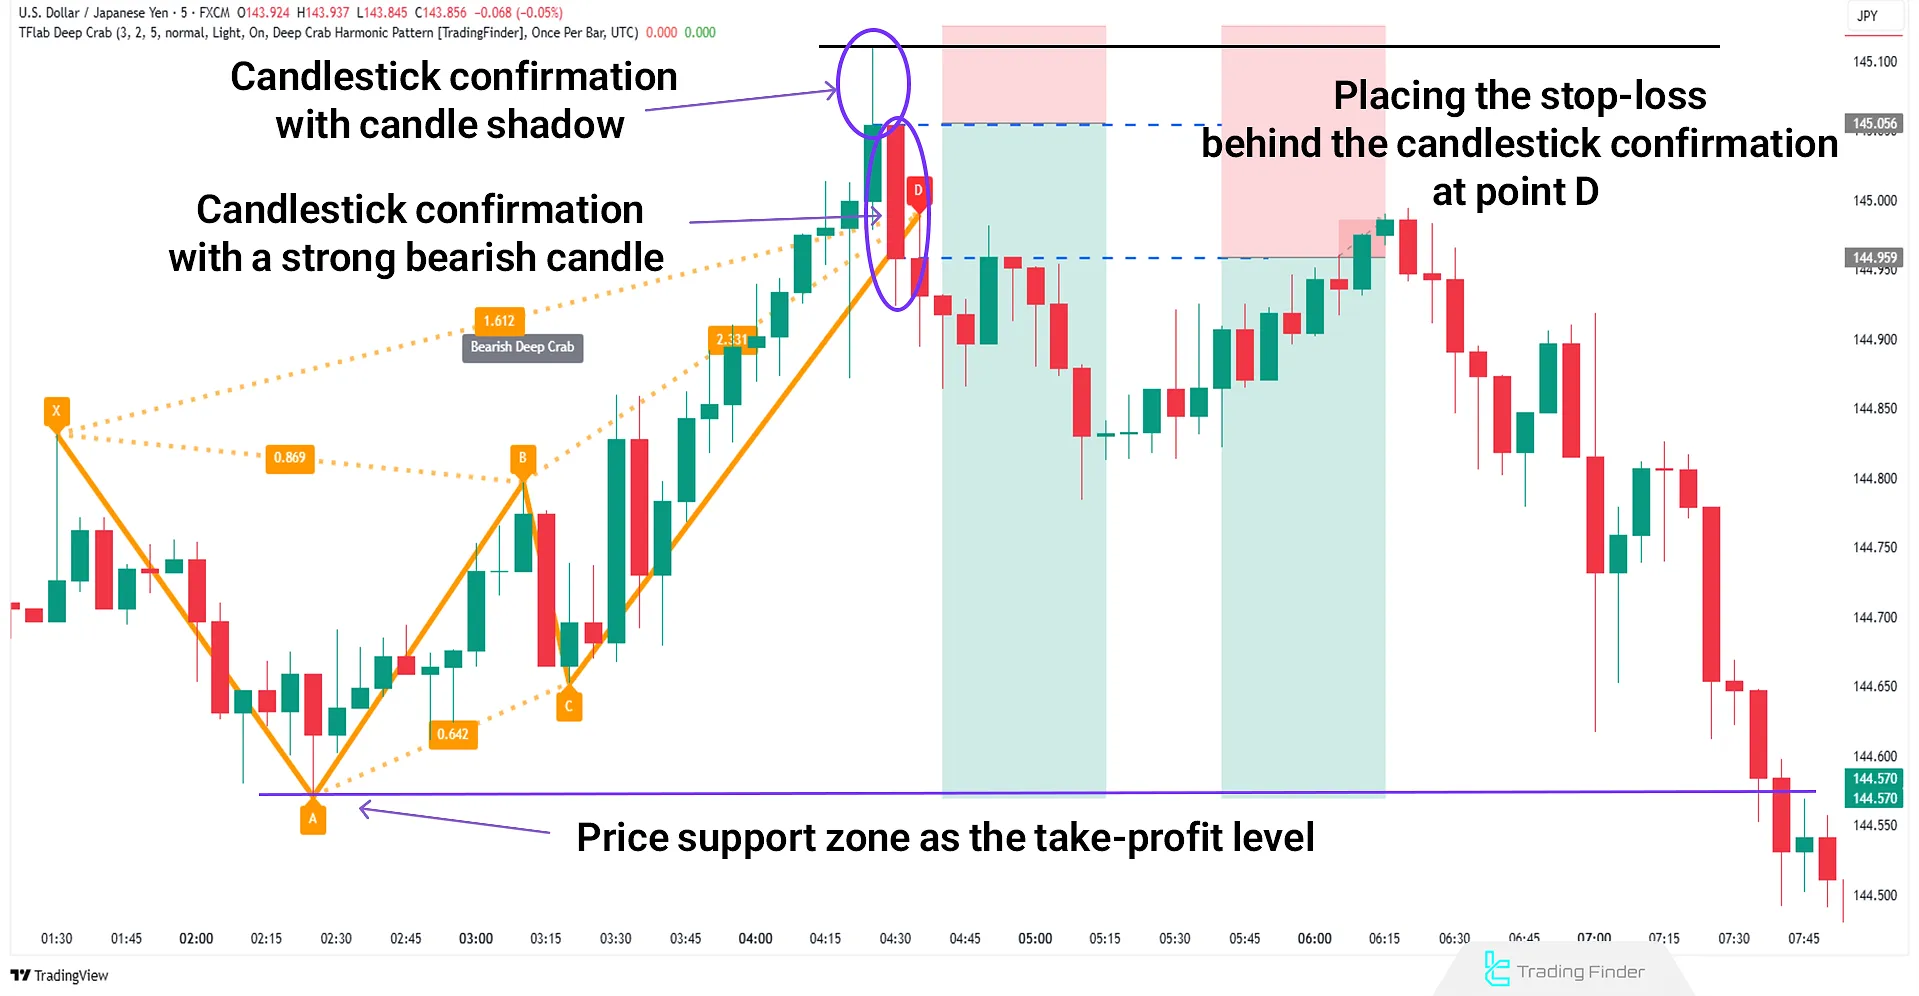
How to Trade Using the Deep Crab Pattern?
Once the Deep Crab structure is confirmed, mark points X, A, B, C, and D. The D point represents a potential reversal zone. Upon candlestick confirmation at point D, the trade can be initiated.
The stop-loss is placed below point D, and the take-profit is usually set at Fibonacci retracement levels or key support and resistance zones.
Deep Crab Harmonic Pattern Indicator
The Deep Crab Harmonic Pattern Indicator is an advanced analytical tool available on both MetaTrader and TradingView platforms, designed to automatically detect harmonic patterns of the Deep Crab type on price charts.
This tool combines price data, pivot points, and Fibonacci ratios to calculate a zone known as the Potential Reversal Zone (PRZ) and displays it directly on the chart.
The main function of the indicator is to identify potential trend reversal areas points where the price structure aligns with Fibonacci ratios and the probability of a reversal increases.
Using this tool allows traders to determine entry and exit points with greater precision and confidence, basing their analysis on more objective data.
- Deep Crab Harmonic Pattern Indicator on TradingView
- Download Deep Crab Harmonic Pattern Indicator for MetaTrader 5
- Download Deep Crab Harmonic Pattern Indicator for MetaTrader 4
This indicator can be used across Forex, stock, and index markets and is particularly useful for traders employing intraday, scalping, or multi-timeframe analysis strategies.
For example, on a four-hour currency pair chart, once the pattern structure completes, the indicator identifies the bullish variation and highlights the potential buy zone.
Conversely, on a 15-minute chart of another pair, upon detecting a bearish Deep Crab pattern, it determines the potential reversal zone and activates a sell signal.
Within the settings menu, several customization options are available, including:
- Minimum Length of Wave (candle): Defines the minimum wave length;
- Num of Previous Candle: Specifies the number of past candles to be analyzed.
Visual settings include Style of Line, Width of Line, and Custom Color Lines, allowing users to adjust the color, thickness, and style of the pattern lines. Additionally, users can independently enable or disable the display of bullish or bearish patterns.
Overall, the Deep Crab Harmonic Pattern Indicator on MetaTrader and TradingView is a powerful, precise, and visually intuitive tool for technical analysts.
By detecting reversal patterns and displaying the PRZ zone, it provides a deeper understanding of market structure and trend reversal points, significantly enhancing the quality of trading decisions.
Conclusion
The Deep Crab Harmonic Pattern is rarely observed on charts, and manually detecting it according to all its rules may cause traders to miss profitable setups. Therefore, it is recommended to use automatic pattern recognition tools for detecting the Deep Crab structure.
The difference between the Crab and the Deep Crab patterns lies solely in the retracement level of point B relative to point X. In addition, this pattern can be used for trades offering high risk-to-reward (R:R) ratios.


