


In technical analysis, various tools and patterns are used to identify price reversal zones, determine entry and exit points, and understand the market’s price action.
One of these analytical tools is Fibonacci Retracement, which operates based on the mathematical ratios derived from the Fibonacci sequence.
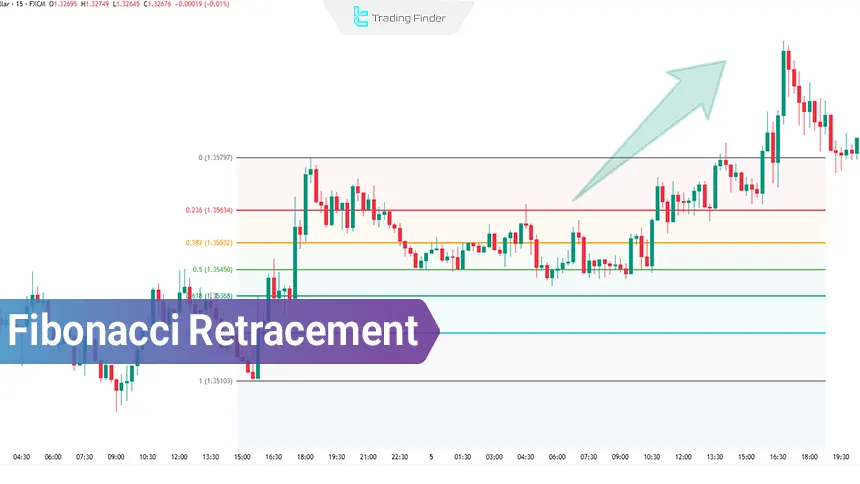
Fibonacci Retracement, by plotting horizontal levels on the price chart, identifies zones where there is a probability of a trend reversal or pause. This tool, especially in markets with a clear trend plays an important role in identifying hidden support and resistance zones.
What is Fibonacci Retracement?
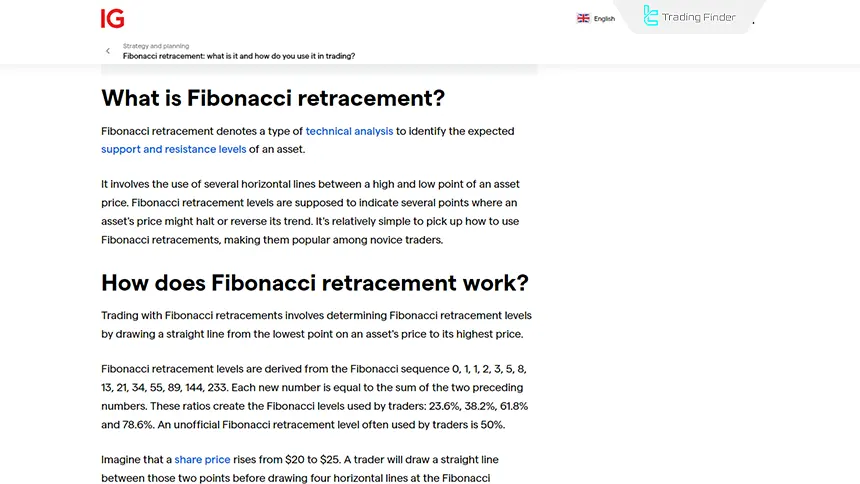
The Fibonacci Retracement tool is based on the Fibonacci number sequence; a sequence in which each number is the sum of the two preceding numbers (1, 1, 2, 3, 5, 8, 13, ...). The ratios are derived from this sequence.
Especially the ratios 23.6%, 38.2%, 50.0%, 61.8% and 76.4%, form the basis for calculating and plotting Fibonacci retracement levels in technical analysis. Fibonacci retracement training from IG.com:
These levels are drawn as horizontal lines on the price chart and mark potential areas where price may reverse or pause. The main use of this tool is when the market is moving in a clear trend and the price enters a temporary correction.
In such conditions, these levels can act as support zones in uptrends or resistance zones in downtrends.
Advantages and Disadvantages of Fibonacci Retracement
Fibonacci Retracement is one of the most widely used tools in technical analysis.
Knowing the strengths of this tool allows better use of retracement levels, and being aware of its weaknesses prevents overreliance on it. Table of the advantages and disadvantages of Fibonacci Retracement:
Advantages | Disadvantages |
Identifying potential support and resistance zones during price corrections | Creating false signals in ranging or non-trending markets |
Helping to determine suitable entry and exit points in clear trends | Full dependence on the precise selection of major swings (High/Low) |
Ability to increase analysis accuracy when combined with complementary tools | No guarantee of price reaction and only usable as a probabilistic tool |
Ease of use and suitable for beginner to intermediate traders | Subjective identification and different drawing of levels by various analysts |
Helping to set stop loss and manage risk during price corrections | Levels can be easily broken in very strong trends |
Usable in all financial markets such as forex, stocks, and crypto | Low effectiveness when there is no trend or when strong horizontal volatility is present |
How to Draw the Fibonacci Retracement Tool
Correctly drawing the Fibonacci Retracement tool requires accurately identifying the main price swings within the trend structure.
The starting and ending points of the initial price move form the basis for calculating the retracement levels. Educational video on how to use and draw Fibonacci Retracement from the YouTube channel “The Moving Average”:
Identifying Key Swing Highs and Swing Lows
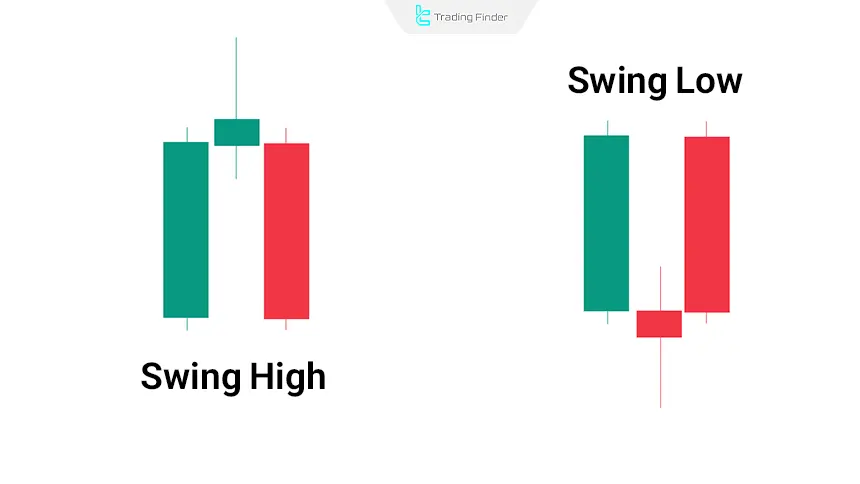
Accurately identifying important points such as Swing Highs and Swing Lows is the foundation of correctly drawing Fibonacci Retracement and determining the most valid price reversal levels. Methods for identifying Swing Highs and Swing Lows:
- Swing High: a point where price has reached a peak, and before and after it there are two candles with lower highs;
- Swing Low: a point where price has reached a trough, and before and after it there are two candles with higher lows.
These points indicate the relative end of a move and the start of a correction or a reversal move.
Drawing Fibonacci in Different Trends
Understanding the trend direction is an essential condition for correctly drawing the Fibonacci tool and interpreting the behavior of retracement levels in the market.
- In an uptrend: first, the bottom point (Swing Low) is selected, and then the tool is drawn up to the top point (Swing High). In this case, Fibonacci levels act as support zones during the price pullback from top to bottom;
- In a downtrend: first, the top point (Swing High) is identified, and the tool is extended downwards to the bottom point (Swing Low). In this case, the Fibonacci levels show potential resistance zones during the corrective move upward.
Important Points in Using the Fibonacci Retracement Tool
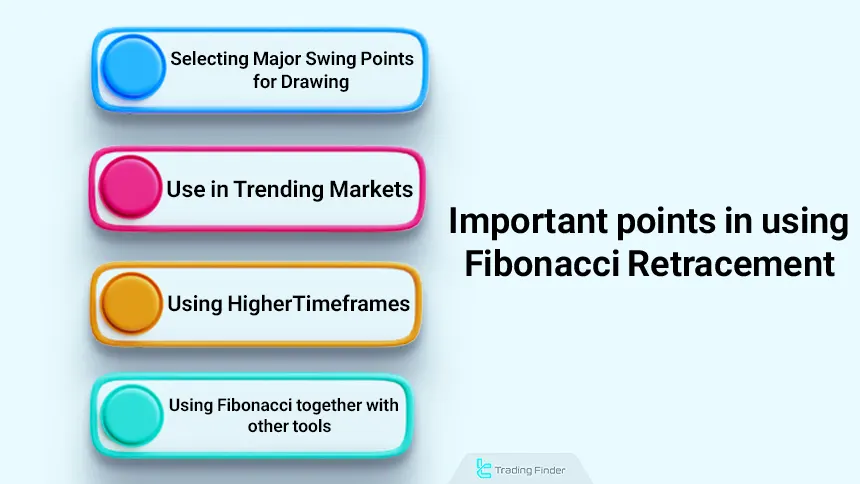
Following key guidelines when using Fibonacci plays an important role in increasing analysis accuracy and reducing false signals. Important points of Fibonacci retracement:
- Fibonacci should only be used in clear trends (uptrend or downtrend); in non-trending (ranging) markets, false signals are generated;
- Accurate selection of the main swing points for drawing is decisive in the precision of the retracement levels;
- Higher timeframes should be used to determine the drawing points so that the levels gain more validity;
- It is better to analyze Fibonacci levels together with other confirming tools such as candlestick patterns, divergences, or moving averages.
Using Fibonacci Retracement in an Uptrend
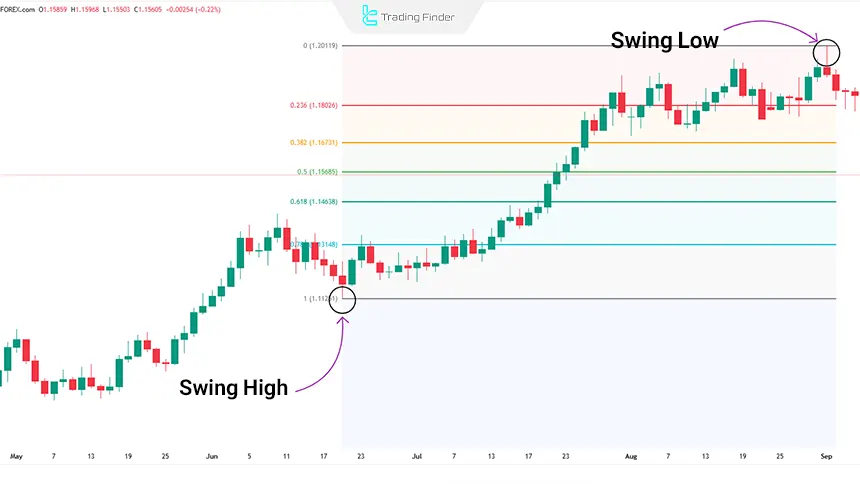
To examine the actual performance of Fibonacci retracement levels in an uptrend, the daily chart of the EUR/USD pair in the daily timeframe has been selected. Drawing the retracement levels:
- Starting point (Swing Low): 11620
- End point (Swing High): 20159
By plotting the Fibonacci tool between these two points, the following retracement levels were obtained:
- 6% = 1.18144
- 2% = 1.16897
- 0% = 1.15890
- 8% = 1.14882
- 4% = 1.13448
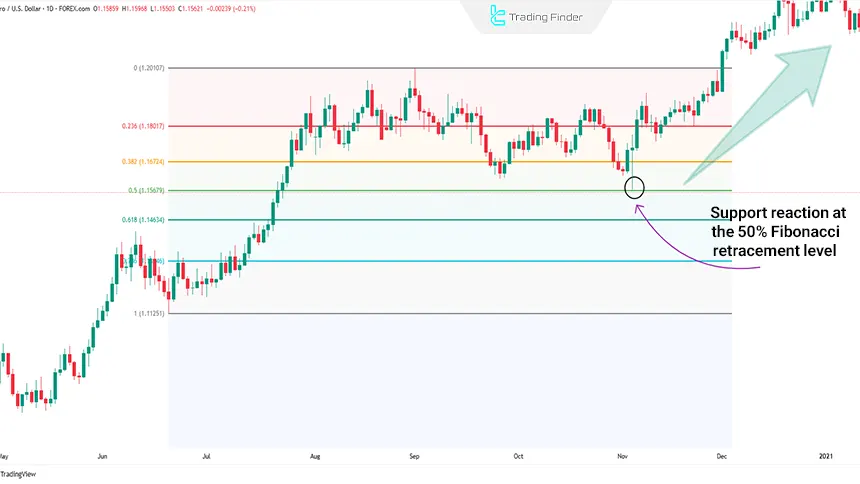
Example of Using Fibonacci Retracement in an Uptrend
After forming the top at 1.20159, the price entered a corrective phase and passed through the 23.6% and 38.2% levels without any meaningful reaction.
The downward move continued until it encountered support at the 50% zone (1.15890). Price consolidated in this area and, while maintaining the uptrend, eventually broke above the previous high.
In this example, the 50% level acted as a dynamic support. Entering at this level with a logical stop loss placed below it created a low-risk and high-reward trading opportunity.
This behavior confirms the validity of Fibonacci retracement levels in conditions where the trend is clear and the swing points are correctly selected.
Using Fibonacci Retracement in a Downtrend
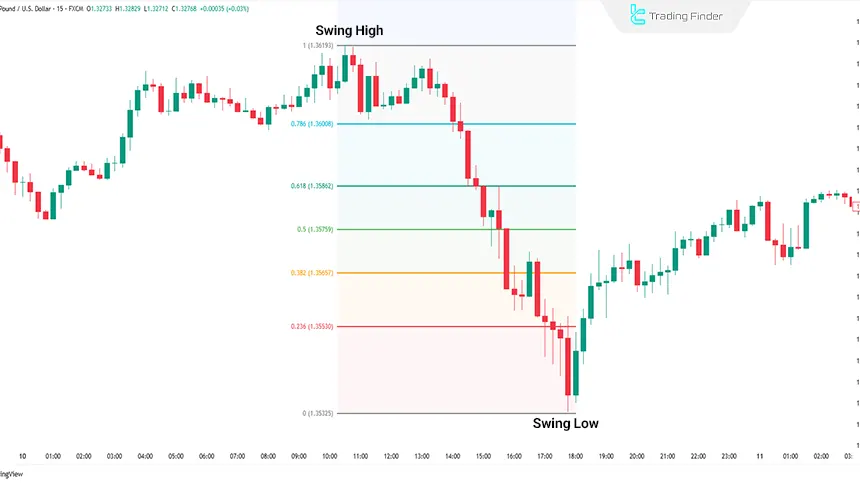
To examine the performance of Fibonacci retracement in a downtrend, the GBP/USD pair on the 15-minute timeframe has been selected. Drawing the retracement levels:
- Starting point (Swing High): 1.36193
- End point (Swing Low): 1.35323
By drawing the Fibonacci tool from top to bottom, the following retracement levels were obtained:
- 6% = 1.35528
- 2% = 1.35655
- 0% = 1.35758
- 8% = 1.35861
- 4% = 1.36007
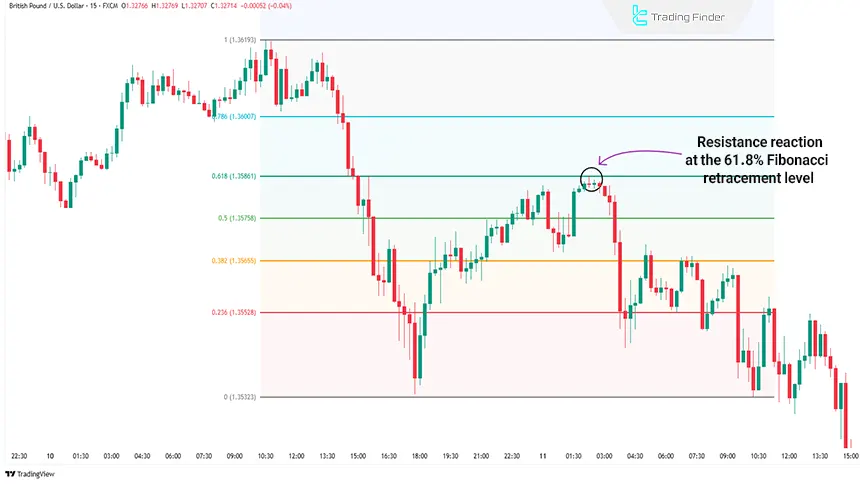
Example of Using Fibonacci Retracement in a Downtrend
After reaching the bottom at 1.35323, the price entered a corrective phase. It first rose to the 50% level but failed to break through it and oscillated around that zone for a while.
Then, with another upward move, it tested the 61.8% level but could not sustain above it. From that area, sellers regained control of the market, and the downtrend resumed.
Fibonacci Retracement Indicator
The Fibonacci Retracement assistant indicator is one of the practical tools for identifying market reversal zones and analyzing corrective price movements. This indicator automatically draws the key Fibonacci levels between two main points of a wave.
Key ratios including 23.6%, 38.2%, 50%, 61.8%, 78.6%, and 100% are included in this tool, and each level can act as a static support or resistance.
The indicator’s operation is based on selecting two points from a specific market move; the trader first determines the Swing High and Swing Low of the main wave, and the indicator immediately plots the retracement levels on the chart.
Educational video on how to use the Fibonacci Retracement indicator:
This increases the speed of analysis and reduces the probability of error in manual drawing.
The indicator is suitable for different trading styles such as scalping, day trading, swing trading, and multi-timeframe analysis and is applicable in all markets including forex, stocks, commodities, indices, and crypto.
The analytical examples provided in the indicator’s description show how this tool performs in both uptrends and downtrends.
In various scenarios, when price reaches the 61.8% or 78.6% level in confluence with complementary structures (such as price channels or level flip zones), attractive buy or sell opportunities are created.
These overlaps increase the probability of a valid price reversal and reduce false signals. In the settings section, the indicator allows changing the line colors according to the chart background; other level settings are standardized by default and do not need adjustment.
Overall, the Fibonacci Retracement assistant indicator is a reliable tool for identifying key market zones and analyzing corrective price behavior.
By automatically plotting important levels, this tool not only increases analysis accuracy but also simplifies the process of identifying entry and exit points and plays an effective role in pullback- and retracement-based strategies.
Download links for the Fibonacci Retracement indicator:
Combined Strategies with Fibonacci Retracement
Combining Fibonacci Retracement with complementary structures significantly increases analysis accuracy and the quality of reversal zones. Each retracement level gains practical validity when it aligns with other independent data, such as:
- Prevailing trend
- Historical levels
- Price behavior signals
Using complementary tools alongside Fibonacci prevents relying on a single structure and defines entry and exit conditions in an objective and reliable manner. Combining Fibonacci Retracement with different strategies:
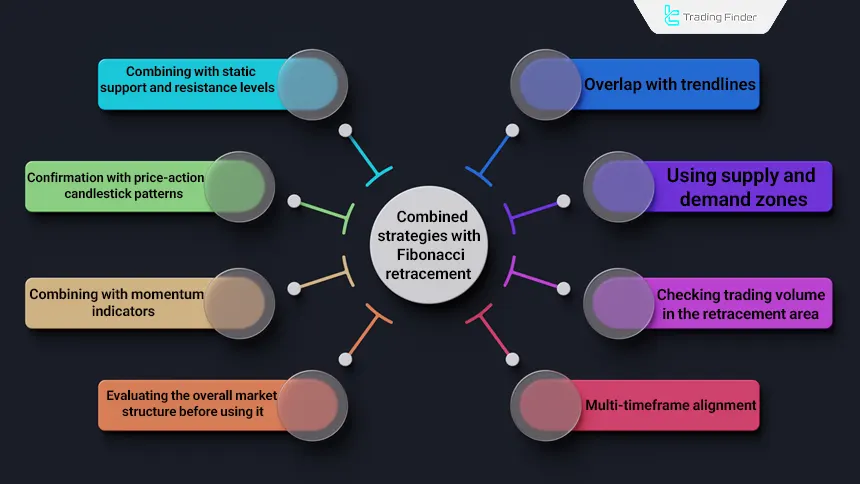
- Overlap with trendlines: the validity of a retracement level increases if it aligns with the main trendline;
- Combining with static support and resistance levels: the overlap of a Fibonacci level with a historical low or high creates a powerful decision zone;
- Using supply and demand zones: placing retracement levels inside high-order-flow zones increases the probability of price reversal;
- Confirmation with price action candlestick patterns: the appearance of patterns such as Pin Bar, Engulfing, or Morning Star at a retracement level signals a shift in order flow and confirms the new direction;
- Checking trading volume in the retracement area: declining volume during correction and rising volume on the bounce from a key level signal valid order flow and the start of a new wave;
- Combining with momentum indicators: RSI or MACD divergence at a retracement level confirms trend weakness and the likelihood of a reversal move, suitable for low-risk entries;
- Multi-timeframe alignment: identifying the main Swing on a higher timeframe and searching for entry signals on a lower timeframe increases accuracy and reduces error;
- Evaluating the overall market structure before use: the tool is most effective in clear trends; using it in ranging environments increases analytical error.
Conclusion
Fibonacci Retracement is an accurate tool for identifying price reversal zones during temporary market corrections, provided it is drawn within clear trends and with correct selection of swing points.
The data examined in the charts show that key levels such as 38.2%, 50.0%, and 61.8% can act as valid support or resistance, provided that they are confirmed by price behavior.
Using this tool in non-trending markets or without complementary confirmations increases analytical error. Fibonacci Retracement has practical value as a complementary tool within a coherent analytical strategy.


