


In short-term trading, seeing the “battle between buyer and seller” inside each candle can make the difference between a precise entry and arriving late to the move.
The Footprint Orderflow indicator in NinjaTrader, by simultaneously displaying executed volume at Bid/Ask, Delta, and Imbalances, turns the microstructure of the market into an understandable picture.
Instead of relying on lagging averages, this tool shows order flow data at the price levels inside the candle so the trader can identify Absorption, real breakouts, and momentum turning points faster.
What is the Order Flow Footprint indicator?
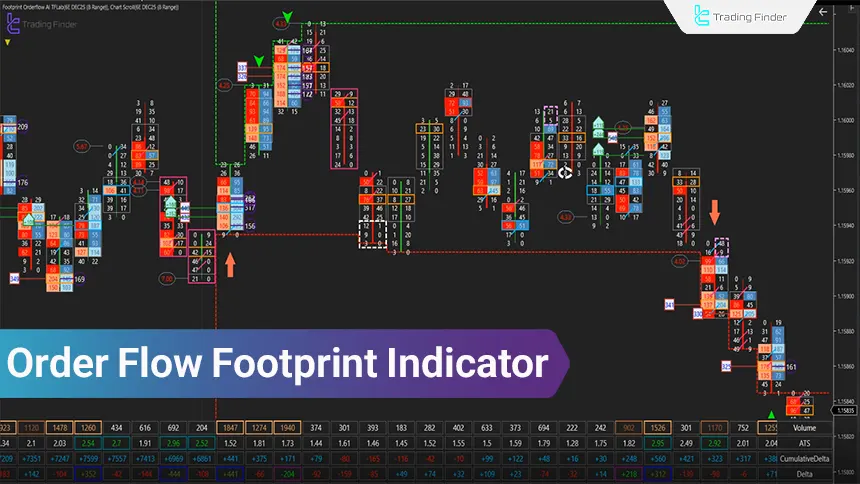
The Order Flow Footprint indicator is an advanced indicator for analyzing “order flow” on the NinjaTrader platform that, using real-time Bid/Ask data, executed volume, and volume Delta, reveals supply and demand conditions within each candle.
In the Footprint structure, instead of a simple candle body, a “numeric map” of volume at different price levels is displayed. This shows exactly at which prices buying and selling pressure has been active.
Advantages and disadvantages of the Order Flow Footprint indicator
The Footprint Orderflow indicator, by providing an accurate picture of order flow, has its own advantages and limitations, understanding which is essential for professional use.
Understanding the strengths of this tool helps the trader use its capabilities at the right time while also being aware of its limitations. Advantages and limitations table of the Order Flow Footprint indicator:
Advantages | disadvantages |
Real display of Bid/Ask and Delta at the price level | High dependency on data quality |
High-accuracy identification of Absorption and Imbalance | Requires skill and experience in reading |
Suitable for validating breakouts and reversals | High noise in low-volume markets |
Helps with entry and exit timing on lower timeframes | Complex for beginners |
Usable across most markets | Many settings and need for optimization |
Analytical applications of the Order Flow Footprint indicator
The Footprint Orderflow indicator, focusing on real-time trade data and the actual flow of orders, enables reviewing market liquidity behavior at a level beyond price charts.
By combining executed volume, delta, and volume imbalances, this tool reveals points where decisions of large market participants directly impact price movement.
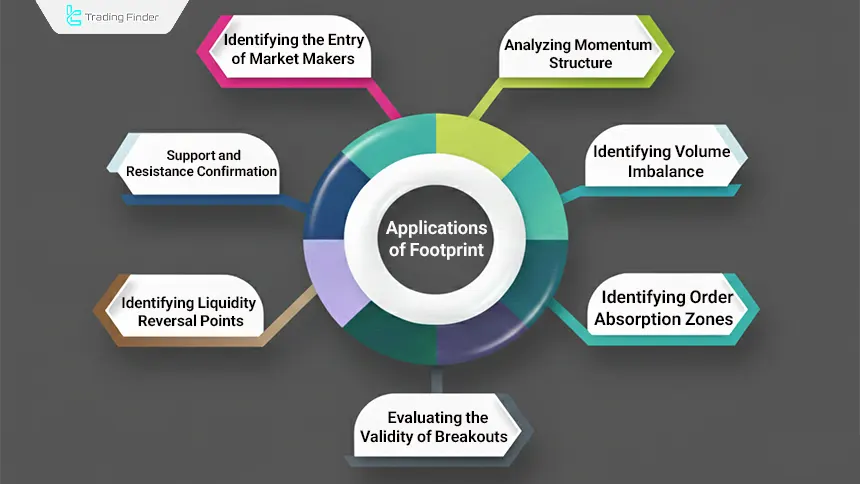
- Identifying order absorption zones (Absorption Zones);
- Identifying volume imbalance (Volume Imbalance);
- Analyzing momentum structure with Delta Divergence;
- Evaluating the validity of breakouts (Breakout Validation) by comparing volume and the direction of order flow;
- Determining Liquidity Reaction Levels at local highs and lows;
- Confirming dynamic support and resistance with real trade volume;
- Identifying large player entries (Whale Entries) through a sudden volume spike at a specific level.
Note: Many of these conditions are displayed with numbers, colors, and geometric symbols (arrow/diamond) to maintain readability in real time.
Traders can download the Order Flow Footprint indicator for the NinjaTrader platform from the Trading Finder indicators section.
How to trade with Footprint Orderflow in NinjaTrader
Trading with Footprint is essentially reading the relationship between price and volume at each price level. A good entry forms when price movement aligns with delta and imbalances and shows a valid reaction at a key point (support and resistance or a liquidity zone).
In this process, instead of predicting, the trader observes the real behavior of aggressive orders and liquidity absorption and makes decisions based on the strength or weakness of order flow. For this reason, Footprint is more of a market-structure confirmation tool.
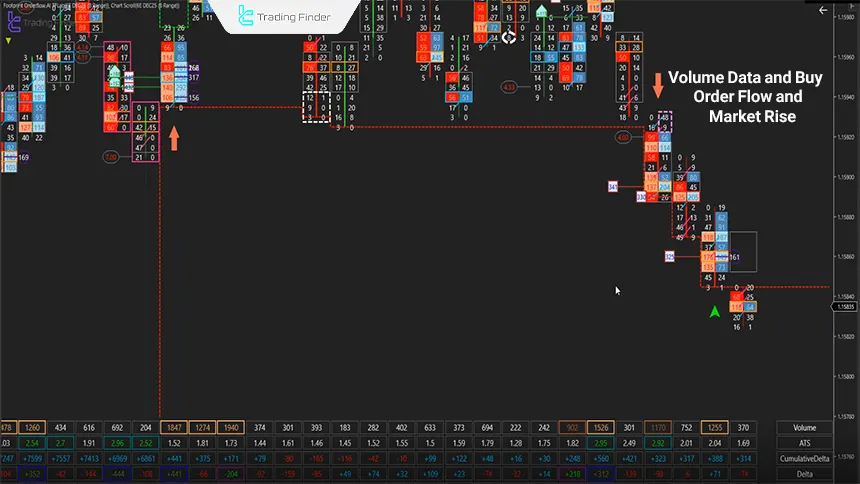
Bullish example buy in an uptrend with Footprint
In a bullish market structure, a buy signal becomes valid when price behavior aligns with volume data and order flow. The Footprint Orderflow indicator reveals this alignment numerically through delta, imbalances, and signs of liquidity absorption. Suitable factors for a buy signal in an uptrend:
- The appearance of positive Delta in an area where selling volume rises but price does not drop (a sign of seller absorption);
- Formation of a Bullish Imbalance; meaning buy volume at the Ask is at least 2 to 3 times the sell volume at the Bid at the same price level;
- The presence of Sell Absorption at the bottom of the bar and price holding above the volume zone;
- Confirmation by Cumulative Delta turning positive and ATS increasing in subsequent candles;
- Recording a Max Delta higher than the average of the last few candles.
In such conditions, Footprint shows that sellers at the low have been “absorbed” and buyers have taken short-term control.
Sell signal in a downtrend with Footprint
In a bearish structure, a sell signal is more valid when buyer weakness and seller dominance are seen in the data; especially when this dominance forms near resistance levels or prior liquidity zones and matches price behavior. Suitable factors for a sell signal in a downtrend:
- Formation of strong negative Delta near resistance or a reversal zone;
- Occurrence of a Bearish Imbalance with heavy volume on the Bid side;
- Stopping of the upward move despite high buying volume but without price growth (buyer absorption);
- Negative divergence between price and Cumulative Delta;
- Activation of a bearish candle with Min Delta lower than the average of the recent range.
Setting Stop Loss based on the Order Flow Footprint structure
In order flow trading, the stop loss is better to be structural, not fixed; because the exit logic should follow the same data that the entry was based on.
In Footprint, delta invalidation, disappearance of imbalance, or a break of the absorption zone is a clear signal of a violated trade scenario and should be the basis for triggering the stop.
- In buys (Long): the stop is placed below the zone where seller absorption occurred or below the lowest level where bullish imbalance formed;
- In sells (Short): the stop is set above the buyer absorption zone or above the level where strong negative delta started.
If after entry, delta reverses against the trade direction and imbalances neutralize, the probability of scenario failure increases and management should be done faster.
Exit timing (Exit Strategy) with Delta and ATS
Exiting in Footprint is usually logical when the quality of the move decreases. In summary, exits in this system are more qualitative; meaning based on weakening order flow power, the trade should be exited. Steps for exiting a trade in the Order Flow Footprint indicator:
- Delta decreasing compared to previous candles;
- ATS decreasing and the size of aggressive trades shrinking;
- Decrease in the number of imbalances (Imbalance Fade);
- Formation of divergence between price and Cumulative Delta
Executing multiple positions with consecutive signals.
Executing multiple positions with consecutive signals
In strong trends, Footprint may show several consecutive bars with aligned imbalances and synchronized delta. In this case, a "Position Scaling" approach can be used:
- Each time with a new confirmation (aligned Imbalance + Delta), part of the size is added;
- The distance to the overall stop and the risk-to-reward ratio should be controlled;
- For better management, using a "Trailing Stop" based on the latest absorption zone and imbalance is more logical.
Counter-trend trading with Delta Divergence
Counter-trend trading in Footprint is usually built on divergence. In this method, one should enter with smaller size and a shorter target, because the goal is to capture quick corrections. Methods of counter-trend trading in the Order Flow Footprint indicator:
- Price makes a new high or low but "Cumulative Delta" does not confirm;
- Or at a level, buy and sell volume rises but price has no sustained move (Absorption).
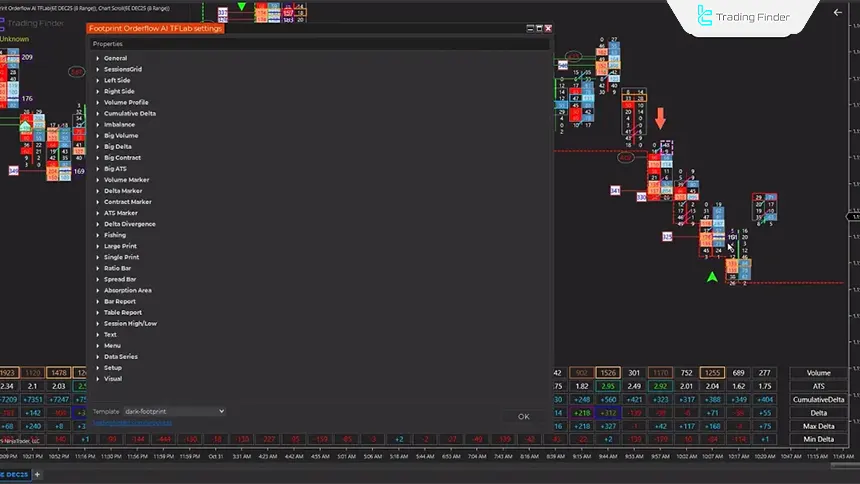
Footprint Orderflow indicator settings in NinjaTrader
The Footprint Orderflow indicator settings are designed to increase data readability and reduce market noise, and must be aligned with the symbol, trading session, and trading style.
In the General section, Manual, Automatic, and AI modes determine how order flow data is filtered and processed.
Bid/Ask, Delta, Cumulative Delta, and Imbalance settings help ensure that only meaningful buying and selling pressures are highlighted. Also, the Big Volume, ATS, and visual settings sections are used to identify large trades and maintain Footprint clarity in lower timeframes.
Risk management in Footprint trading
Because this tool displays real-time trade data, decisions become faster and risk management becomes more critical; because even the smallest mistake in interpreting order flow can lead to emotional entries.
When using Footprint, controlling position size, adhering to structural stops, and avoiding increasing risk in noisy market conditions play a key role in maintaining result stability. Risk management parameters table in the Order Flow Footprint indicator:
Risk Management Parameter | Description |
Fixed risk per trade | Defining a specific risk for each trade (for example, a fixed percentage of total capital) |
Reducing size in noisy markets or during news times | Reducing position size in volatile conditions or when major news is released |
Not increasing size due to multiple signals | Preventing position size increases solely due to a high number of Footprint signals |
Recording and evaluating trade results | Reviewing the performance of different settings, such as Imbalance, to identify the best settings for each symbol |
Compatibility of the Order Flow Footprint indicator with NinjaTrader
The Order Flow Footprint indicator (Footprint Orderflow) is designed for the NinjaTrader platform and runs directly based on this platform’s real-time data structure, Bid/Ask, and executed volume.
This indicator uses NinjaTrader’s internal processing engine, analyzes data simultaneously with market movement, and displays the result on the chart with minimal delay.
Proper execution of Footprint Orderflow in NinjaTrader depends on connecting to a Real-Time Data Feed, because the accuracy of delta, imbalance, and absorption directly depends on the quality of real-time data.
In the simulation environment, due to limited depth of data, some volume details may be displayed with slight differences.
After activation, the indicator runs directly on the chart and visual changes such as candle colors, Imbalance, and volume markers are applied almost instantly.
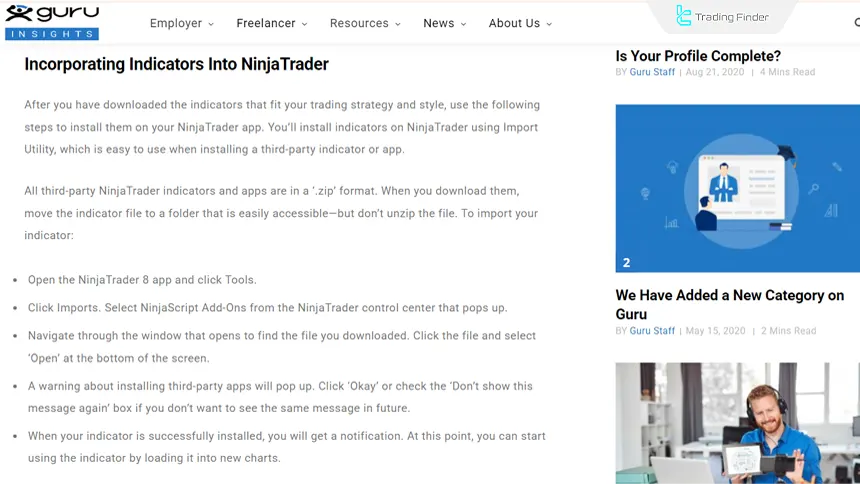
This feature makes Footprint fully suitable for fast trading and day trading in NinjaTrader. Tutorial for activating the indicator on NinjaTrader from guru.com:
Tips for better use of Footprint Orderflow
The effectiveness of the Footprint Orderflow indicator is not only dependent on data accuracy, but also directly depends on how the trader uses it and makes decisions. Complementary and key tips for using the Order Flow Footprint indicator:
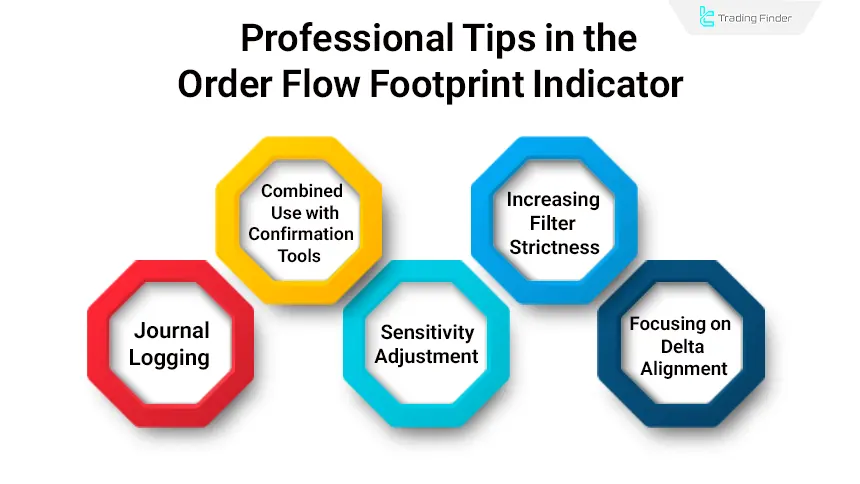
- Combined use with confirmation tools such as VWAP and Volume Profile;
- Increasing filter strictness or limiting trading during highly volatile news times;
- Logging a multi-day journal for each symbol and comparing Delta and ATS behavior;
- Conservative adjustment of sensitivity and imbalance in low-volume markets;
- Focusing on the alignment of delta, volume imbalance, and price structure instead of a fixed number.
Conclusion
The Order Flow Footprint indicator (Footprint Orderflow) in NinjaTrader, by displaying Bid/Ask, Delta, and Imbalance as real-time trade data, helps the trader see behind the scenes of candles and set entries/exits based on the real flow of orders.
This tool has high application in day trading and short-term trading for identifying absorption, confirming breakouts, and identifying momentum turning points; however, it requires high-quality data and numeric reading skill.
If settings are aligned with the symbol and session conditions, Footprint can make decision-making faster and more accurate.


