


The Footprint Price Action Pro indicator is an advanced tool for microstructure market analysis used within the NinjaTrader platform.
This trading tool, by precisely processing order flow at the Bid and Ask levels, provides information on the behavior of buyers and sellers within each price block.
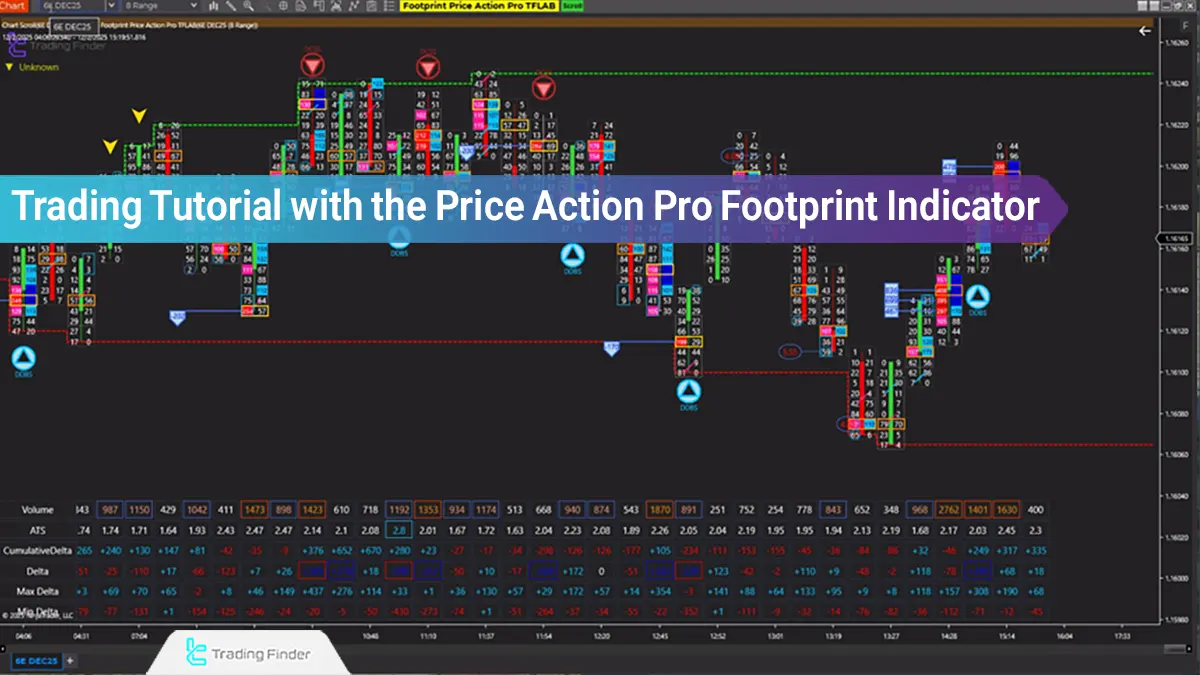
What Is the Footprint Price Action Pro Indicator?
The Footprint Price Action Pro indicator is an analytical tool based on the simultaneous processing of price, volume, and order flow data that displays market structure through the direct interaction of buyers and sellers.
This indicator relies on OrderFlow and Delta data to decode volume imbalance changes at each price level and translates the nature of liquidity engagement inside the market into numerical and volume-based language.
The analytical core of this tool is formed based on the precise reading of trade execution frequency, capital inflow intensity, and the real distribution of supply and demand in each candle, making it highly effective after NinjaTrader Signup for traders who rely on advanced order flow analysis.
Additionally, this trading tool enables traders to identify real support and resistance zones and generate buy and sell signals based on volume data.
Advantages, Disadvantages, and Limitations of the Footprint Price Action Pro Indicator for Traders
The Footprint Price Action Pro indicator creates a set of analytical advantages and reveals the behavior of major market participants at the tick level.
This tool displays the supply and demand structure with high precision and enables microstructural market analysis.
However, this indicator requires a tick-based data feed and specialized knowledge of order flow, and without these prerequisites, using it may be difficult. In addition, high-volume processing under certain conditions imposes a higher computational load.
Advantages of the Footprint Price Action Pro Indicator | Disadvantages of the Footprint Price Action Pro Indicator |
Displaying the behavior of major participants at the tick level and presenting the real executed volume structure | Requirement for a tick-based data feed to provide accurate and error-free output |
Precise supply and demand analysis based on order flow and volume imbalance | Requirement for specialized knowledge of order flow and market volume structure |
Ability to observe market microstructure and reconstruct the internal architecture of price movement | Increased computational load under high-volume and heavy data conditions |
Suitable for professional strategies based on delta, absorption, and aggressive volume | Analytical complexity for inexperienced traders and the need for continuous practice |
Displaying signs of reversals, valid breakouts, and trading pressure in real time | - |
Installation and Setup Steps of Footprint Price Action Pro in NinjaTrader
Launching the Footprint Price Action Pro indicator in NinjaTrader begins by importing the analytical indicator package into the software structure, and after activation, it becomes available for execution on the desired chart.
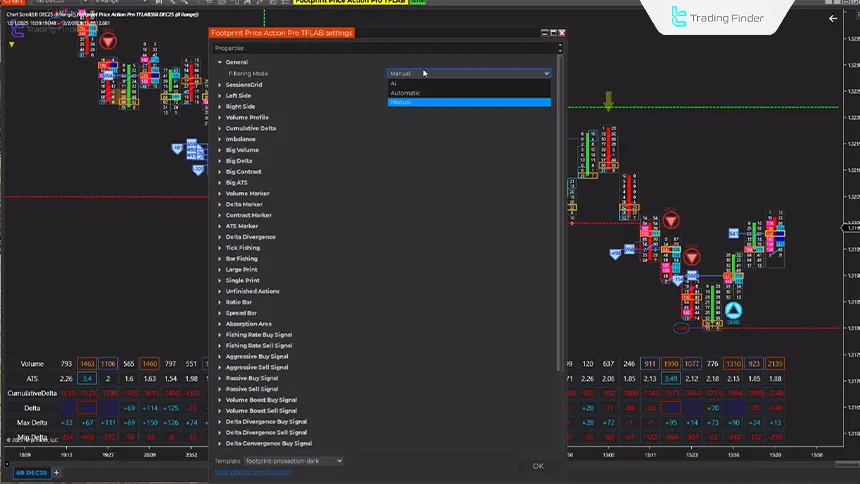
After installation, the indicator appears in the list of volume analysis tools, and sections related to executed volume, delta, cumulative delta, and volume imbalance become configurable within its settings.
In the settings stage, the analyst can activate the display structure of volume blocks, bid and ask separation, imbalance sensitivity intensity, and operational modes including manual, automatic, and artificial intelligence based on the trading strategy type.
Correct activation of these modules allows tick-level data to be processed and volume signals such as aggressive pressure, absorption, and reversal patterns to be printed on the chart with high accuracy.
These Footprint Price Action Pro indicator are provided by TradingFinder, officially recognized vendor of NinjaTrader, ensuring a reliable structure for microstructure market analysis.
Final integration of the settings with a tick-based data feed completes the order flow processing path and transforms the indicator output into a reliable structure for microstructure market analysis.
Downloading the Footprint Price Action Pro Indicator on the NinjaTrader Platform
Downloading the Footprint Price Action Pro indicator represents the entry point into microstructure market analysis based on real trade execution data.
By displaying executed volume on the bid and ask sides, Delta, Cumulative Delta, and Volume Imbalances, this tool enables the examination of buyer and seller behavior within each price block.
The version provided for NinjaTrader is fully synchronized with Order Flow structure, Absorption, Volume Tail, and liquidity reaction zones.
After downloading and installing the indicator, access to a set of analytical tools such as volume profile, delta marker, single prints, and volume reports is activated so that the analyst can observe the true power of supply and demand independent of raw price.
This Volume Indicator is designed for traders who base their decision-making on execution data and the real structure of order flow.
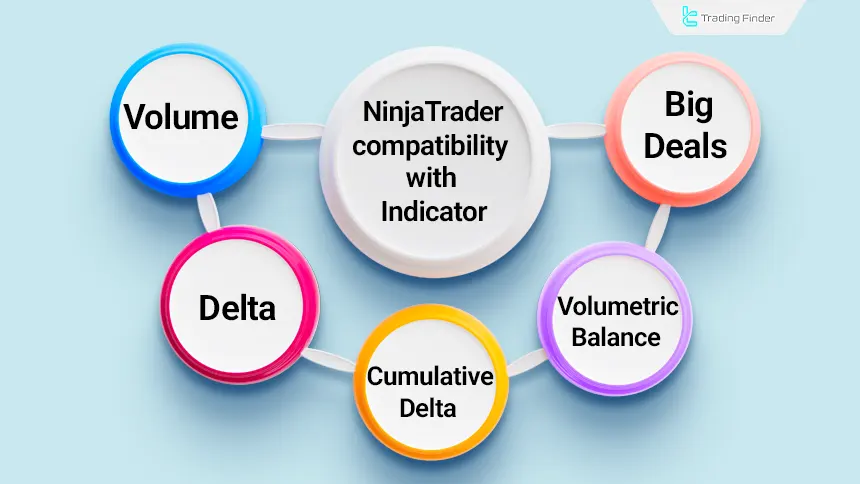
Reviewing the Compatibility of the Footprint Price Action Pro Indicator with the NinjaTrader Platform
The Footprint Price Action Pro indicator operates in alignment with the technical architecture of the NinjaTrader platform and processes tick-level data without delay.
This compatibility ensures that the order flow structure is displayed with maximum accuracy and that microstructural market analysis is executed with professional quality.
NinjaTrader uses an event-driven data processing core, and the Footprint Price Action Pro indicator also utilizes this same architecture to reconstruct executed volume at the bid and ask levels.
This coordination ensures that every tick, every volume block, and every delta change is printed instantly on the chart so that trader behavior in market depth is observable.
This NinjaTrader Indicator is compatible with NinjaTrader’s multidimensional data series and presents information related to volume, delta, cumulative delta, volume imbalance, large trades, and unusual transactions in platform-specific visual structures.
This feature has caused Order Flow data to create a unified analytical model alongside traditional candlestick data.
Using the Footprint Price Action Pro Indicator in Trading Strategies
Reviewing the Trading Volume Indicator in trading strategies creates a multilayer analytical framework and reconstructs order flow at the tick level.
By displaying executed volume on the bid and ask, separating delta and cumulative delta, this indicator reveals buyer and seller behavior in the true market structure.
Its performance in trending and ranging environments enables the analyst to align the price movement path based on execution data rather than merely on the apparent candlestick structure.
The instructional video for activating the indicator in NinjaTrader has been published via the "NinjaTrader" YouTube channel and demonstrates the installation, licensing, and execution of analytical modules step by step.
Note: Entering activation information in the "Licensing" section is mandatory, and this step completes the indicator’s access to the internal computational structure and prevents license-related disruptions.
Mechanism of the Footprint Price Action Pro Indicator in Trending Markets
In trending environments, the Trading with the Footprint Price Action Pro Indicator displays order flow by separating executed volume and analyzing delta along the dominant path.
At the first stage, this indicator assesses the level of volume pressure on the ask or bid side and records the aggression of buyers or sellers in the form of repetitive volume blocks.
In this structure, each volume block acts as a decision-making unit, and the behavior of major market participants becomes visible at the movement edges of the trend.
Multi-level volume imbalance reinforces trend strength and specifies the entry zone at a point where order flow exits equilibrium.
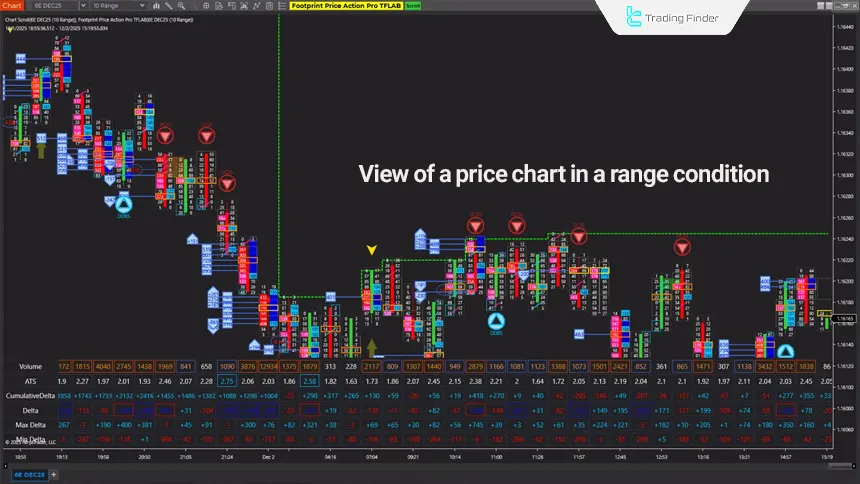
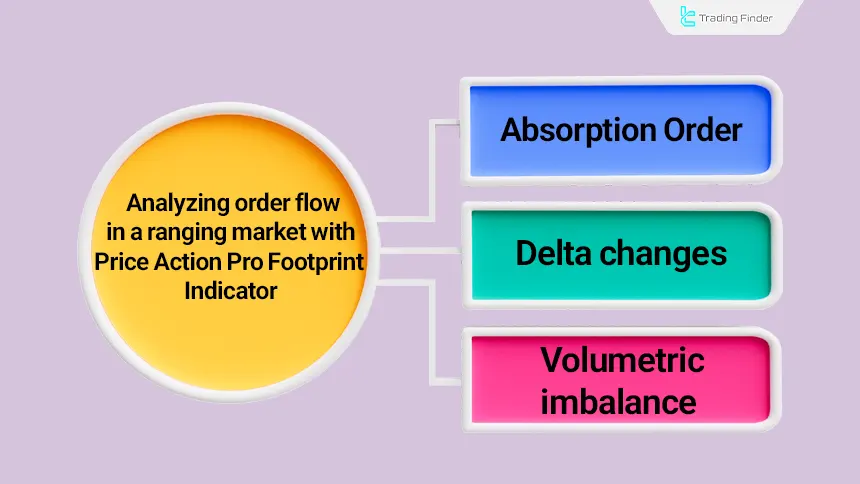
Mechanism of the Footprint Price Action Pro Indicator in Ranging Markets
In ranging environments, the Footprint Price Action Pro indicator analyzes execution data in the form of a relative balance between supply and demand and identifies reversal or breakout zones at the tick level.
A ranging market is typically directionless, and price fluctuates within a compressed range; this indicator, by evaluating absorption, delta changes, and the emergence of sudden volume blocks, highlights points where order flow is on the verge of change.
During analysis, the indicator registers abnormal volumes at the range highs and lows and reveals signs indicating the entry of major players against the oscillation direction.
A reduction in cumulative delta speed, the presence of unusual trades, and the formation of volume imbalance at range boundaries expose the structure of valid breakouts or powerful reversals.
This performance transforms the ranging market from an ambiguous environment into a tradable structure and allows the analyst to determine precise entry and exit zones based on execution data.
Identifying Entry Zones and Valid Signals Using the Footprint Price Action Pro Indicator
Identifying entry zones in the Footprint Price Action Pro indicator is based on the analysis of order flow and the volume structure of the market, and this process reveals the point at which buyer or seller aggression has stabilized at the tick level.
By processing executed volume on the bid and ask, analyzing delta and cumulative delta, this indicator guides the position in which order flow exits equilibrium and price becomes prepared to move in a specific direction.
Under these conditions, volume data play a decisive role, and the trading entry environment is formed based on real data rather than on the apparent candlestick pattern.
Stop Loss Determination Methods Based on the Structure of Footprint Indicator Signals
Stop loss determination in the Review of the Footprint Price Action Pro Indicator is based on the direct analysis of order flow and volume structure. This approach defines the emergency exit position in a scientific rather than intuitive manner.
The stop loss in this Trade Volume Indicator is the point at which the volume architecture of the signal is destroyed and execution pressure in the opposite direction becomes established.
By processing tick-level data, delta, cumulative delta, and volume imbalance, this indicator reveals the zone as follows.
The Role of Order Flow in Stop Loss Determination
The Footprint indicator displays a zone where the behavior of major traders has changed, and this change represents the end of the validity of the entry signal.
Stop loss activation occurs at the moment of increasing opposing execution volume and delta rotation. This behavior indicates that order flow is strengthening in the opposite direction and the initial signal has lost its power.
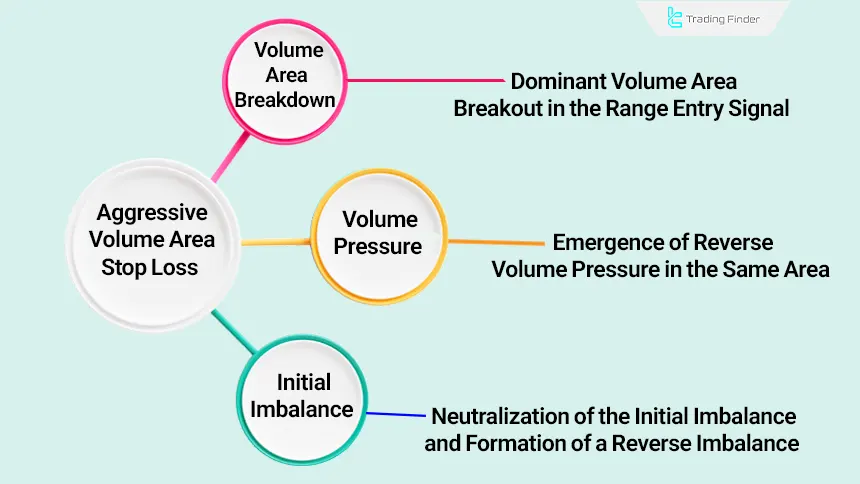
Stop Loss Based on the Aggressive Volume Zone
Every valid footprint signal is formed within a zone where aggressive volume has been recorded. This zone creates the core structural pillar of the entry, and the stop loss is placed at the point where the breakdown of this pillar begins.
When price exits the zone with opposing volume, the entry signal loses its validity and a necessary exit is triggered.
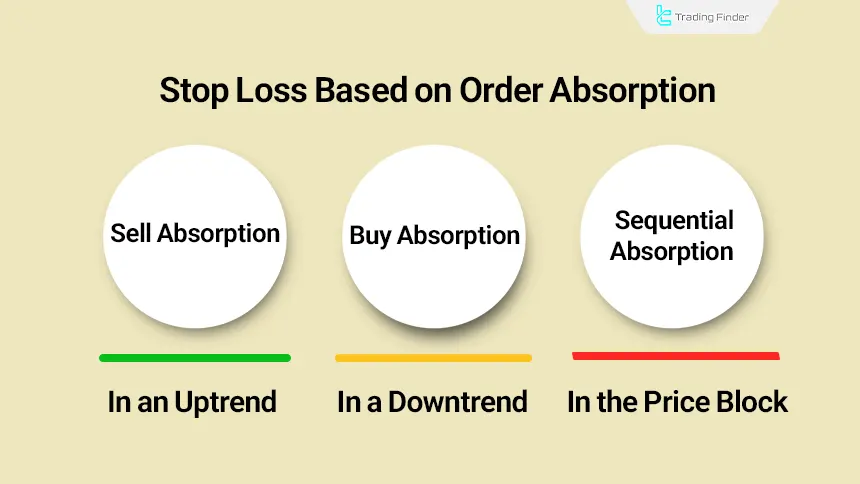
Stop Loss Based on Absorption
Absorption is one of the most precise signs of a change in order flow; therefore, the stop loss is activated at the moment price movement appears in the opposite direction of the trade.
Absorption indicates that major players are confronting the signal-driven movement, and this behavior often acts as the initial phase of a structural reversal.
Stop Loss Based on Delta and Cumulative Delta Behavior
Delta and cumulative delta act as sensors for order flow changes. A delta rotation against the signal accompanied by a halt in the trend of cumulative delta defines the exit zone.
This behavior often appears prior to a price movement change and enables rapid exit.
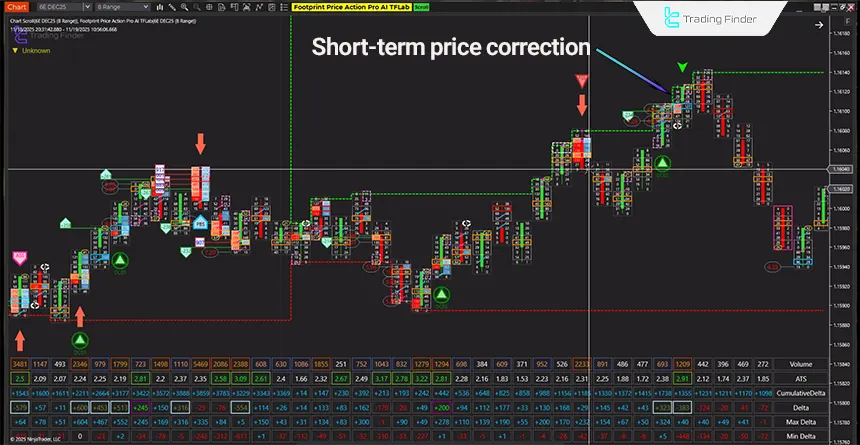
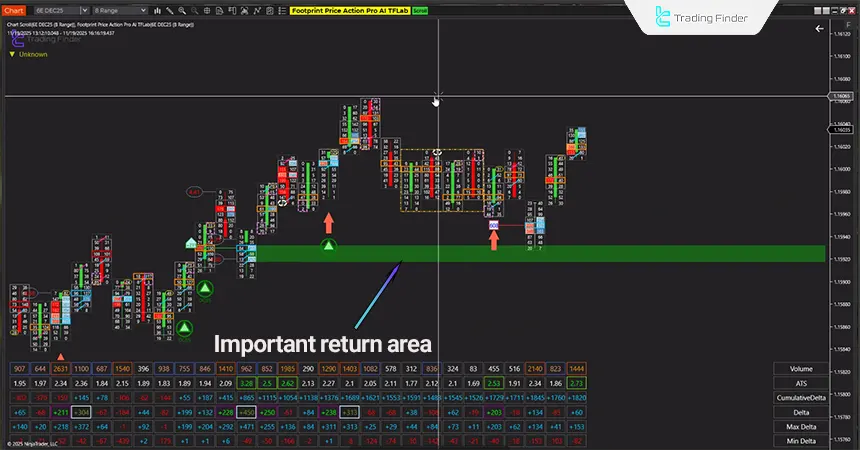
Trade Example Using the Footprint Price Action Pro Indicator
In the image below, after a short bearish wave, price enters the specific low zone shown in the image and the first volume reaction forms in the same area.
The exit of delta from the negative zone and its gradual movement toward positive values displays the direction change in order flow.
Simultaneously, cumulative delta registers a higher low with a mild ascending slope and demonstrates the gradual dominance of buyers within the trading structure.
In the price blocks near the low, buy imbalance with ask dominance over bid is observed and aggressive buying pressure is visible in the order flow data.
Several candles later, price remains above the demand zone specified in the image and the bullish structure maintains its healthy form.
Cumulative delta increases in a stair-step manner and buying pressure continues toward the upper liquidity zone. This behavior clearly illustrates the active presence of powerful buyers within the market structure.
As price approaches the high zone, volume concentration gradually shifts toward the bid and sell imbalance becomes visible in the upper layers. Delta re-enters the negative zone and cumulative delta changes direction with a descending slope, indicating a shift in order flow direction.
Simultaneously, buy-side absorption is activated at the high and the weakness of buyer strength in that zone becomes structurally observable.
Following the concurrence of these signals, the corrective phase of the market begins and price enters a short-term bearish path. This combination of delta, volume imbalance, absorption, and candlestick structure presents a clear example of the real behavior of order flow under consecutive bullish and bearish conditions.
Managing Multiple Positions with Sequential Signals of the Footprint Price Action Pro Indicator
The Footprint Price Action Pro indicator enables multi-position management and independently analyzes order flow within each zone.
By precisely separating executed volume, delta, and volume imbalance across successive blocks, this indicator highlights zones where sequential entries gain analytical validity based on real market data.
Multi-position management in this structure becomes meaningful when the trend exhibits volume continuity or when the market, in ranging conditions, produces consecutive reversal signals.
Using this Level 2 Data Indicator, the analyst can build stepwise entries and adjust position size at each step based on the strength of order flow.
Each successive signal acts as an additional confirmation unit and strengthens the entry structure in the direction of volume pressure; the main elements of multi-position management are as follows:
- Continuation of aggressive volume across multiple blocks
- Stability of cumulative delta along the dominant path
- Volume expansion signals at pullback points
- Sustained imbalance in trend and range conditions
- Reinforcing volume blocks within stepwise signals
Exit from one of the positions is also based on the destruction of the volume structure of that specific step, and this approach increases management flexibility.
Optimizing the Performance of the Footprint Indicator in Different Trading Sessions and Markets
The performance of the Footprint Price Action Pro indicator across different trading sessions is influenced by liquidity behavior, increased order execution speed, and instant volume fluctuations.
Each trading session has its own specific volume structure, and this Buy and Sell Volume Indicator, with tick-level analysis capability, displays the structure of each session with high precision as follows:
- London Session: Rapid entry of aggressive volume and wide delta fluctuations
- New York Session: Formation of combined behavior between sharp trends and deep corrections
- Asian Session: Creation of a ranging structure with lower volume
Optimization of the indicator within these sessions is performed based on delta settings, volume imbalance intensity, and volume filtering. Adjusting these parameters increases analytical precision and reduces false signals.
For further information, training on selecting the optimal trading session and reviewing the exact timing of Forex market open and close, the analytical reference content of Investopedia.com is available:

Comparison of Manual, Automated, and Artificial Intelligence Modes in the Footprint Price Action Pro Indicator
The Footprint Price Action Pro indicator offers the following three operational modes:
- Manual: Suitable for analysts focused on direct examination of market structure without algorithmic mediation;
- Automated: Based on internal algorithms for detecting imbalance zones, abnormal volumes, and delta with semi-structured signal generation;
- AI: Based on developed analytical models for predicting order flow changes.
The table below displays a comparison of the three operational modes of the Footprint Price Action Pro indicator:
Mode | Operational Structure | Application | Advantage |
Manual | Direct analysis of volume, delta, and blocks | Professional traders | High flexibility |
Automated | Algorithmic signal extraction | Faster entry | Noise reduction |
AI | Prediction of order flow | Future trends | High analytical depth |
Risk Management and Protective Strategies When Using the Footprint Price Action Pro Indicator
Risk management in this indicator is based on the direct evaluation of order flow and creates a structure in which stop loss, position size, and exit timing are all determined based on execution data.
A delta rotation against the direction of movement accompanied by the emergence of opposing volume imbalance signals a risk warning structure, and the trader must manage the position with an emergency exit approach.
The creation of a dynamic stop loss also plays a major role, and this stop loss is adjusted based on the destruction of the volume pillar, breakout, or reversal from the entry zone.
In fast-moving trends, using a tight stop loss protects capital, while in ranging structures, the stop loss must be placed at the point where opposing absorption appears.
This approach ensures that decision-making is based on continuous data and reduces the risk of sudden fluctuations.
Conclusion
The Footprint Price Action Pro indicator creates a structure in which the analyst can observe the real architecture of order flow at the tick level.
Additionally, the behavior of major market participants is examined in the form of executed volume, delta, and volume imbalance.
This tool reconstructs supply and demand flow in a micro-analytical form and displays zones where buyer or seller aggression has stabilized.
This capability enables trading decisions to be based on real data and allows price movement paths to be analyzed based on volume pressure rather than merely on the apparent behavior of candlesticks.


