


Advanced Market Structure concept in ICT style is based on the categorization of highs and lows. This categorization can serve as a complement for better identification of various breakouts within the market structure.
The advanced market structure categorization is named based on short-term, intermediate-term, and long-term ranges.
What is Market Structure?
Market structure refers to the price movement pattern within each specified timeframe. Analyzing price highs and lows allows traders to understand overall trends and market dynamics.
In the market structure training article on the XS.COM website, ict advanced market structure in Forex and other financial markets has been fully explained, including concepts such as ith itl sth stl.
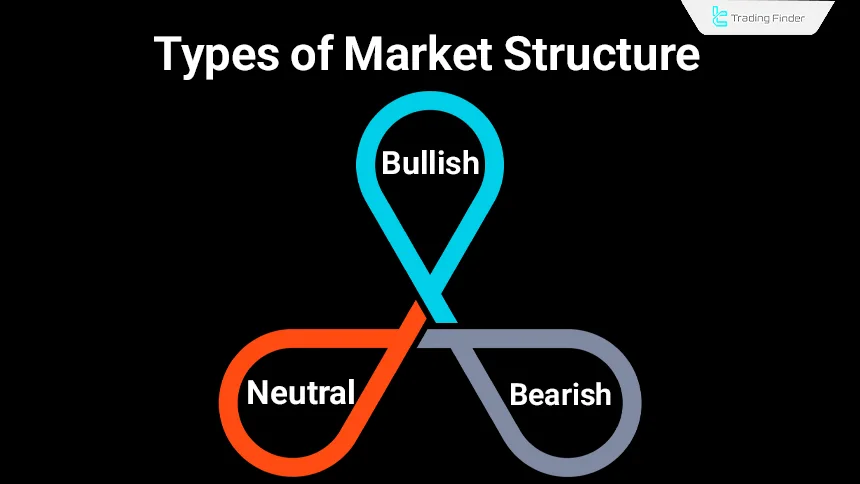
Types of Market Structure
Market structure is an analytical framework for describing price behavior across different timeframes, which is defined based on how highs and lows are formed.
This concept allows the trader to identify the dominant direction of price movement without relying on auxiliary indicators and to objectively evaluate the market’s price action logic.
- Bullish Market Structure: This indicates a consistent price increase, characterized by long-term higher highs and long-term higher lows in price chart
- Bearish Market Structure: This indicates a consistent price decrease, identified by long-term lower lows and long-term lower highs
- Sideways Market Structure: In this scenario, prices fluctuate within a defined range, with highs and lows forming at the same level
Difference Between Advanced Market Structure ICT and Classical High–Low Structure
In the classical structure, market analysis is usually based on the sequence of Higher High and Higher Low or Lower High and Lower Low, but this method does not create a clear boundary between corrections, internal trend changes, and the main structural break.
In contrast, advance market structure ict, within the framework of ict market structure, by classifying highs and lows into three levels of short-term, mid-term, and long-term, including the ith itl sth stl full form, allows the trader to examine price behavior across different time layers.
Comparison table of advanced ICT structure and classical structure:
Comparison Metric | Classical High-Low Structure | Advanced Market Structure in ICT |
Analytical Basis | Sequence of Higher High and Higher Low or Lower High and Lower Low | Classification of highs and lows into STH, ITH, LTH and STL, ITL, LTL |
Correction Identification | Small and large corrections are not precisely distinguished | Short-term, mid-term, and structural corrections are clearly differentiated |
Trend Change Detection | No clear boundary between correction and trend change | Trend change is confirmed only by a break of long-term structure |
Multi-Layer Analysis Accuracy | Focus solely on one price movement layer | Simultaneous evaluation of price behavior across multiple time levels |
Application in Professional Trading | Mostly used for general analysis | Used for precise ICT analysis and structural trading |
Real Breakout Identification | Fake and structural breakouts are not clearly distinguished | A real breakout is considered valid only at the LTH and LTL level |
What are the Types of Advanced Market Structure?
Advanced market structure in ICT style includes various types, which are listed below.
On the TTrades YouTube channel, the advanced ICT market structure has been taught in video format:
Highs
In this concept, there are three types of highs: STH, ITH, LTH; Each is explained below.
This classification is performed based on the structural significance level of each high relative to the reference timeframe within the framework of market structure ict, including concepts such as intermediate term high ict, and helps achieve a clearer understanding of price movement phases across different levels.
The distinction between these levels enables more precise evaluation of trend strength and identification of potential zones of market behavior change.
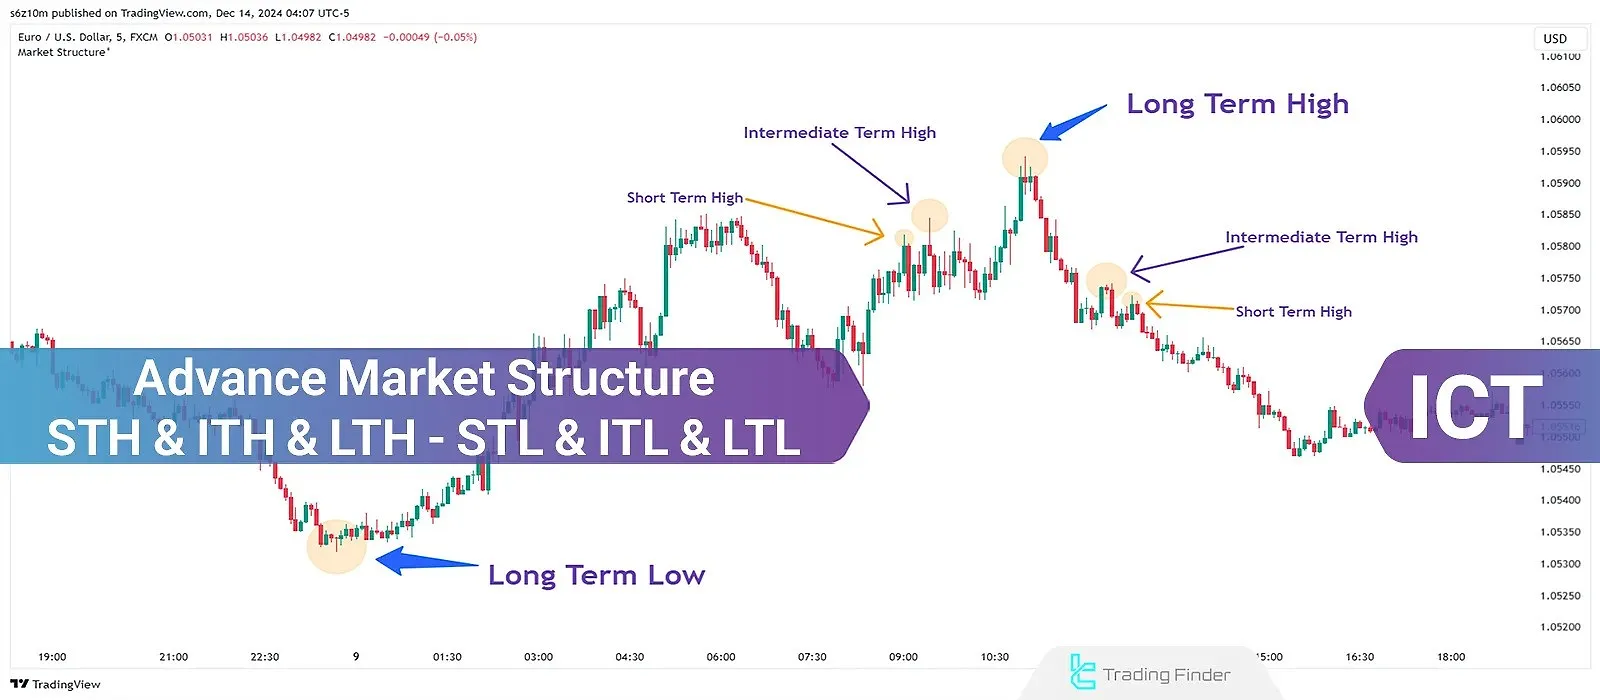
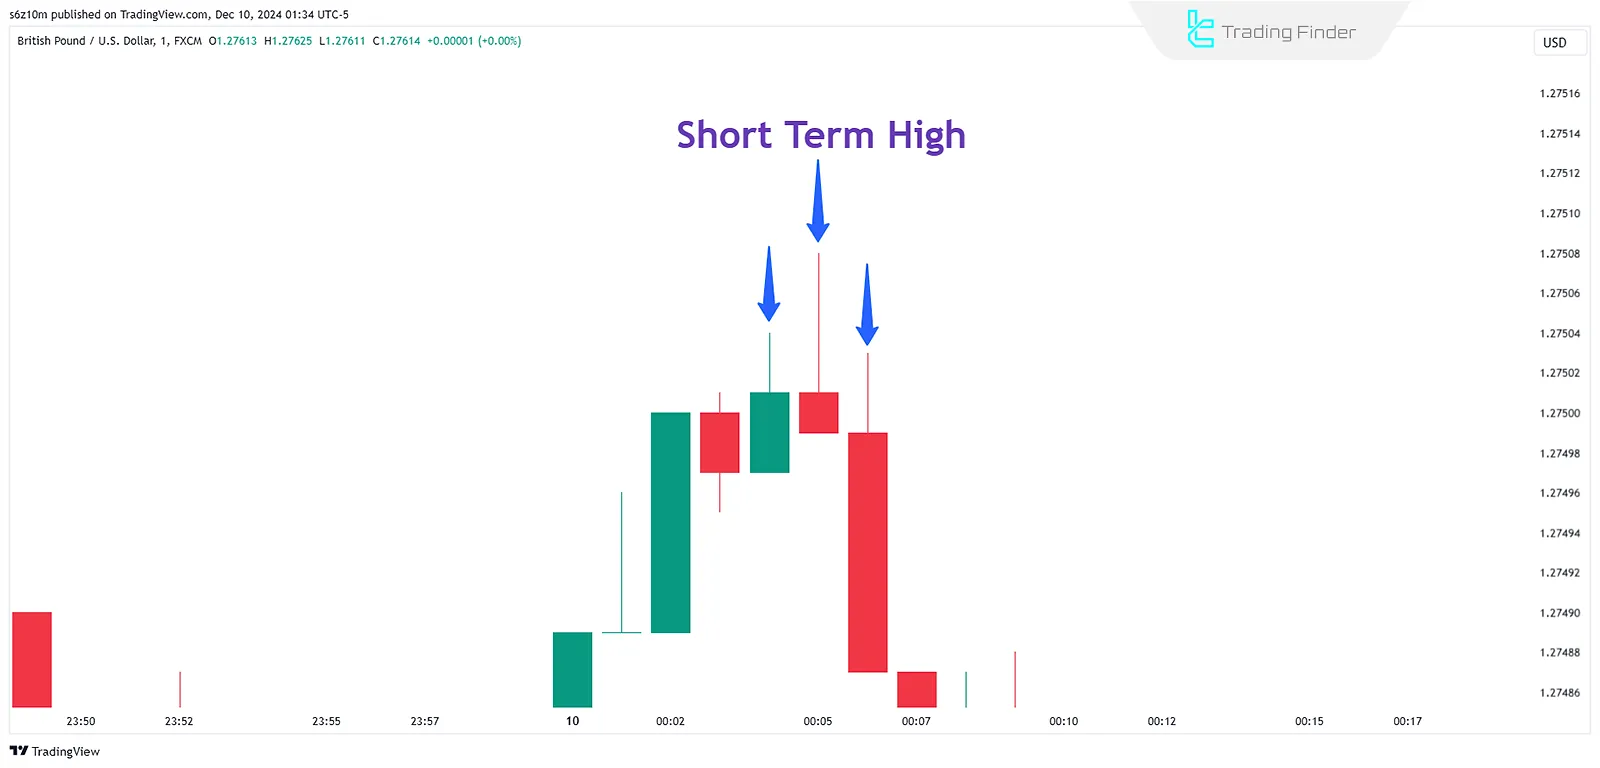
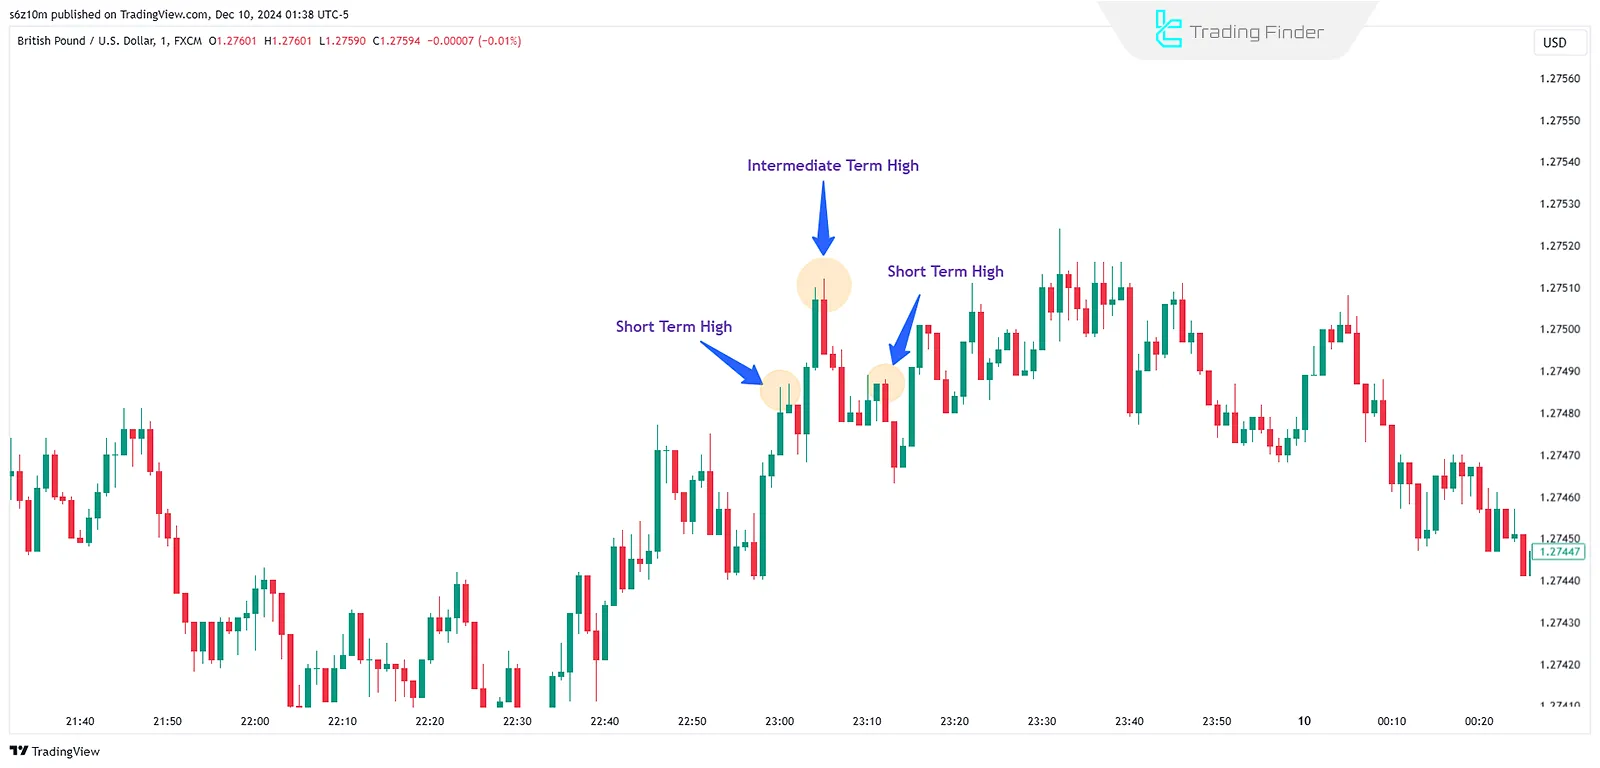
Short Term High (STH)
In ICT analysis, a Short Term High refers to a Swing High formed by three candles. The upper wick of the second (middle) candle is higher than the highs of both the first (left) and third (right) candles.
Therefore, the high of the second candle is recognized as a Short Term High (STH).
Intermediate Term High (ITH)
The term "intermediate-term" refers to something positioned in the middle or between two stages. An Intermediate Term High (ITH) is essentially a Short Term High, but lower Short Term Highs are located on its left and right.
This high is positioned between two lower Short Term Highs and is higher than both of them.
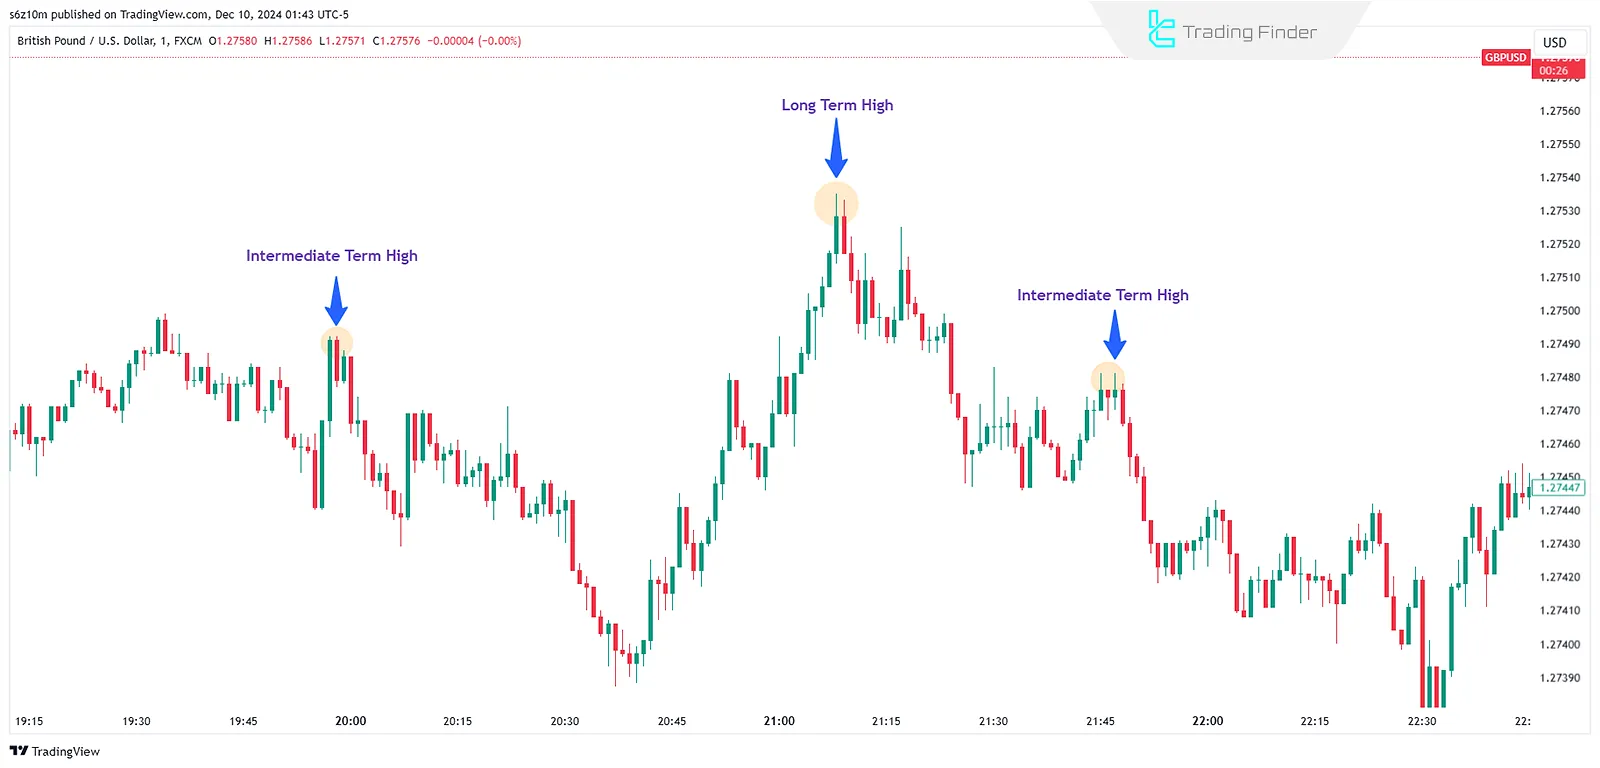
Long Term High (LTH)
A Long Term High (LTH) is naturally an Intermediate Term High, but it usually forms on a higher timeframe after a price reaction within a PD zone.
An LTH is represented as an Intermediate Term High positioned in the center of two other Intermediate Term Highs. It represents the highest Intermediate Term High, with lower Intermediate Term Highs on both sides.
Lows
In this concept, there are three types of lows: STL, ITL, LTL. Each is explained below.
This classification is based on the position of each low within the overall price structure and its relationship with the reference timeframe, while concepts such as intermediate term high and ith trading are used to define structural relevance within the analytical framework.
Separating these levels allows for deeper analysis of trend dynamics and identification of potential zones where market movement may stall or reverse direction.
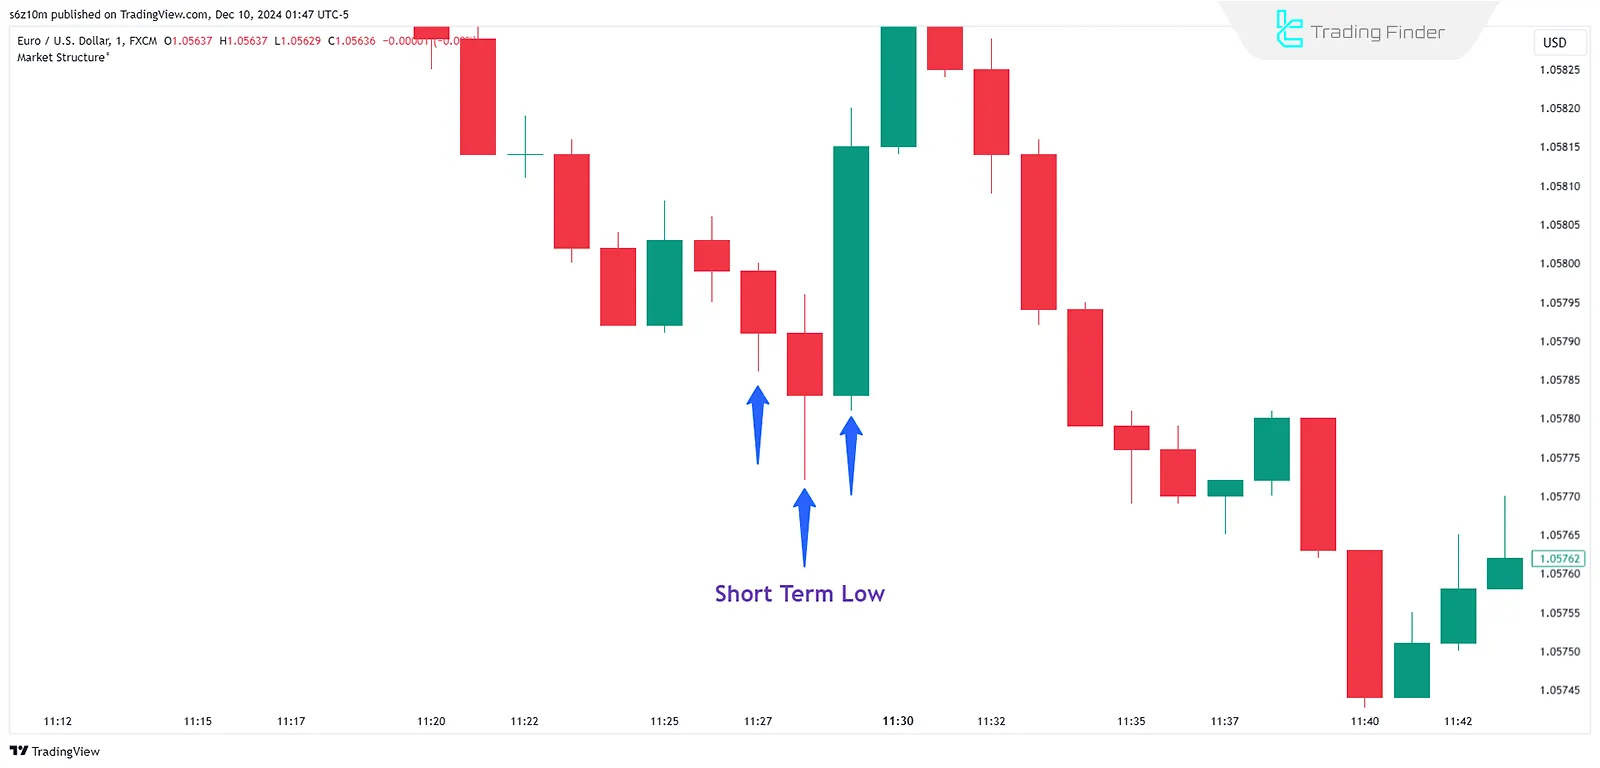
Short Term Low (STL)
In ICT analysis, a Short Term Low refers to a Swing Low formed by three candles. The lower wick of the second (middle) candle extends below the lows of both the first (left) and third (right) candles.
Therefore, the low of the second candle is recognized as a Short Term Low (STL).
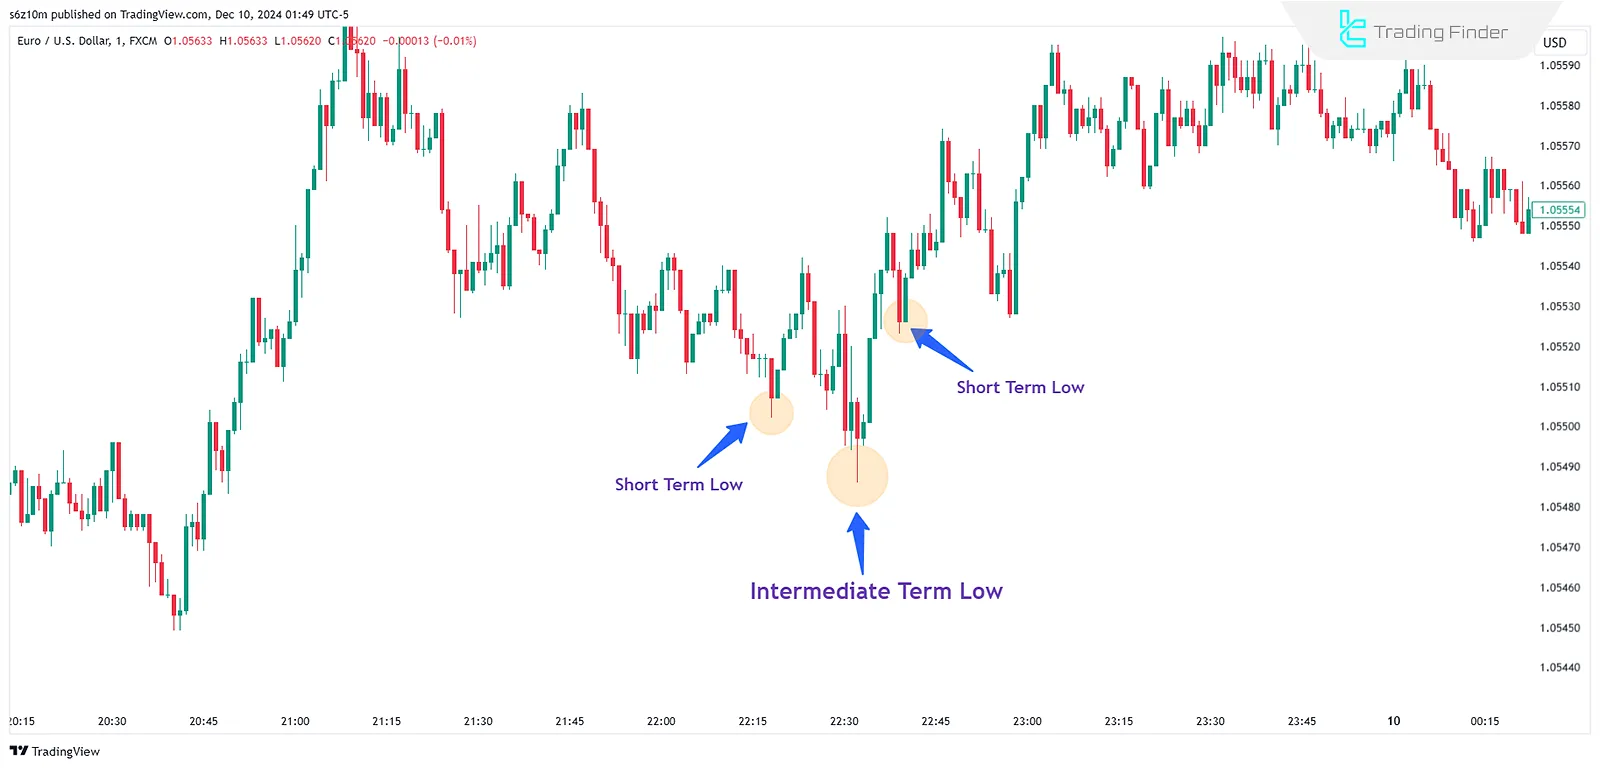
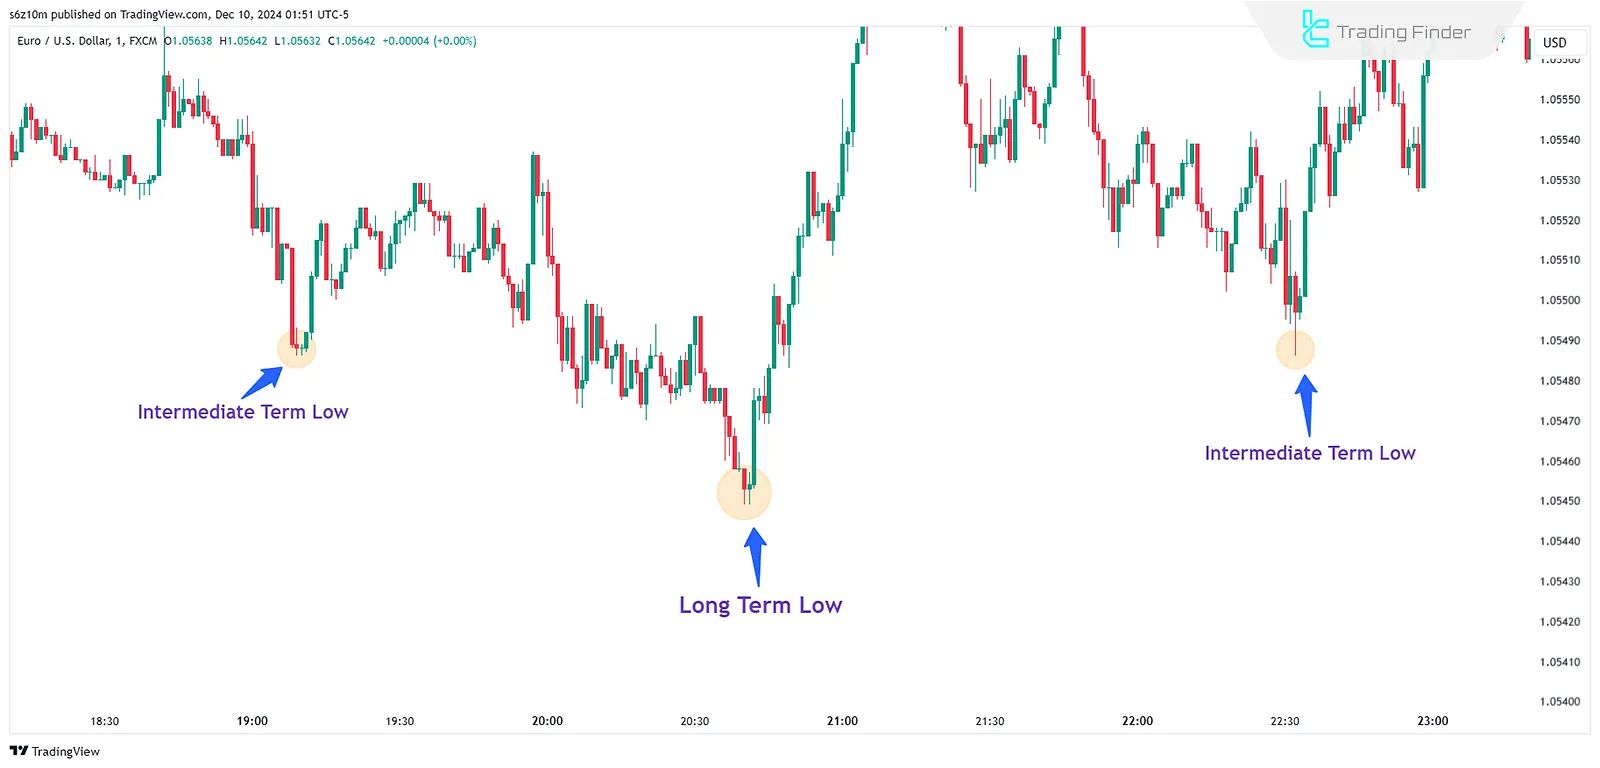
Intermediate Term Low (ITL)
The term "intermediate-term" refers to something positioned in the middle or between two stages. An Intermediate Term Low (ITL) is essentially a Short Term Low, but higher Short Term Lows are located on its left and right.
This low is positioned between two higher Short Term Lows and is lower than both of them.
Long Term Low (LTL)
A Long Term Low (LTL) is naturally an Intermediate Term Low, but it usually forms on a higher timeframe after a price reaction within a Premium/Discount zone.
An LTL is represented as an Intermediate Term Low positioned in the center of two other Intermediate Term Lows. It is the lowest Intermediate Term Low, with higher intermediate term lows on both of its left and right.
Application of Short-Term and Intermediate-Term Lows in Identifying Price Corrections
In active trends, within the framework of market structure and market structure forex, short-term lows defined in stl trading and stl in trading often act as fast and shallow corrections and are mostly observed inside oscillatory movements within a wave.
In contrast, intermediate-term levels in intermediate high trading under market structure advanced reflect deeper corrections and structural pullbacks.
Preserving ITL in an uptrend within ict structure mapping and ict structure signals the health of the price movement, while a break of this level can indicate weakening momentum and the market entering a ranging phase or broader correction.
The Role of Long-Term Highs and Lows in Validating or Breaking Market Structure
In advanced market structure forex and the ict trading strategy, the validity of a trend is determined solely by the preservation of long-term highs and lows. In a bullish structure, as long as a Higher LTL is maintained, the market remains in an uptrend phase according to ict advance principles.
Breaking this low represents the first sign of invalidation of the bullish trend and the beginning of market structure change. Conversely, in a bearish structure, the break of a Lower LTH confirms the end of selling pressure and the potential entry of the market into a corrective phase or trend reversal.
Therefore, LTH and LTL remain the primary reference points for identifying trend termination in ict structure.
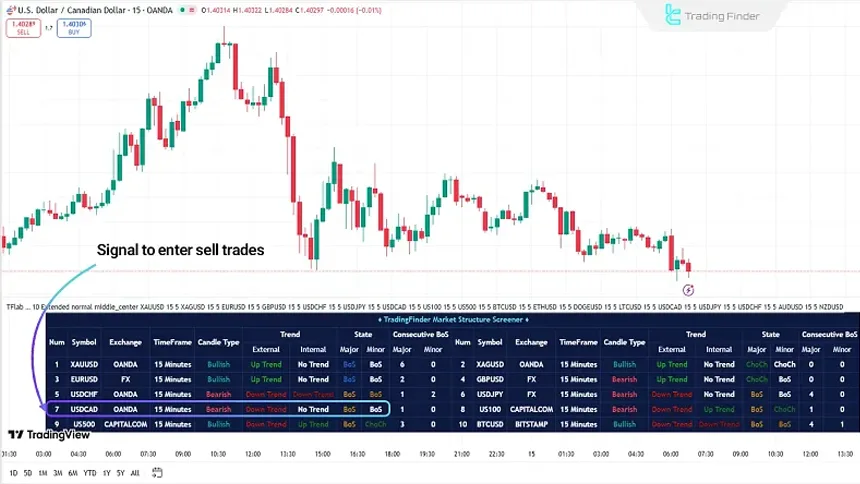
ICT Market Structure Screener
The Market Structure ICT Screener is an analytical tool built on market structure, internal structure trading, and ict structure mapping logic that tracks the sequence of price highs and lows and classifies market movement phases into expansion, correction, and reversal.
By synchronizing higher-timeframe and lower-timeframe structures, the screener reveals liquidity pathways through market structure advanced analysis and enables precise interpretation of institutional behavior within the ict trading strategy.
The ICT market structure screener operates on the TradingView platform and is designed for traders applying sth trading, sth meaning in trading, and structural concepts of ict advance.
In this framework, a valid break of the previous high or low confirms trend direction, while CHOCH delivers the first signal of order-flow shift inside internal structure trading.
The simultaneous display of primary structure and internal structure provides a deep multi-layered perspective on market structure forex behavior.
In bullish scenarios such as EUR/USD, when price breaks the previous high after a correction, it is registered as BOS and the screener identifies optimal buy zones under ict trading strategy conditions.
Conversely, in examples such as USD/CAD, a bearish structural break after a bullish wave validates selling pressure and reveals sell entry zones under advanced market structure forex rules.
From a configuration standpoint, traders can customize table visibility, number of symbols, Basic or Extended mode, size, and position. They can assign dedicated timeframes per asset and define pivot detection length inside the symbol settings.
This flexibility enables professional use across intraday timeframes M1 to M30 in Forex, crypto, equities, commodities, and indices within the complete market structure framework.
In conclusion, the Market Structure ICT Screener, guided by ict structure, ict structure mapping, and market structure advanced, analyzes price movement based on true liquidity shifts rather than superficial fluctuations, making it a core structural engine of modern ict trading strategy.
Example of BOS Identification and Issuing a Sell Signal in the ICT Market Structure Screener
In this example, after a short-term bullish move, price forms a lower high and breaks a structural low, entering a bearish phase. The screener registers this transition as a bearish BOS and simultaneously reflects both internal and main structure as Down Trend.
The alignment of BOS in the screener table with bearish candles on the chart confirms liquidity rotation toward sellers, activating sell zones under ict advance and market structure forex conditions.
The Role of Premium and Discount Zones in the Formation of Long-Term Highs and Lows
Within market structure advanced and ict structure, long-term highs and lows are not defined solely by candle formations. Their location relative to Premium and Discount zones determines structural significance.
Typically, LTL develops in Discount and LTH forms in Premium, reinforcing liquidity logic within market structure and strengthening the framework of the ict trading strategy.
Overlap of Advanced Market Structure with PD Zones on Higher Timeframes
In advanced market structure forex, many long-term highs and lows overlap with PD zones on higher timeframes. These zones include imbalances, Fair Value Gaps, and Order Blocks where major price reactions originate.
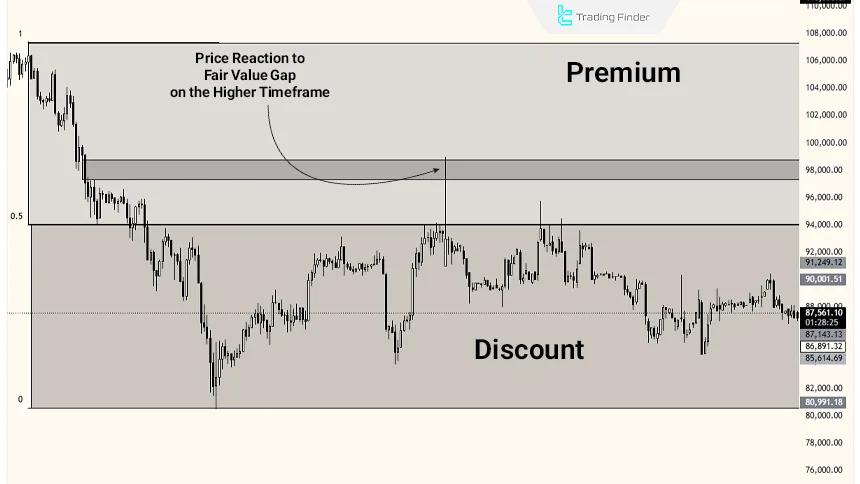
The convergence of LTH or LTL with these zones enhances structural validity and transforms each level into a critical decision anchor for multi-timeframe market structure analysis.
Conclusion
In a bullish advanced market structure, prices consistently form higher highs and higher lows through the Break Of Structure (BOS) over the long term.
The trend remains bullish unless the higher low is broken, indicating a potential reversal known as a Change of Character or Market Structure Shift (CHoCH or MSS).
In Bearish Advanced Market Structure, prices form lower lows and lower highs over the long term. The trend stays bearish unless the lower high is broken.


