


In forex markets, identifying key price movement levels is one of the most important tools for analyzing asset behavior. Two concepts All Time High (ATH) and All Time Low (ATL) are among the most fundamental indicators that traders rely on to assess trend strength, collective psychology, and to determine high-risk or attractive zones.
These levels represent the highest and lowest values an asset has experienced throughout its trading lifetime and are used as strong reference points for analyzing market structure, forecasting future scenarios, and making trading decisions.
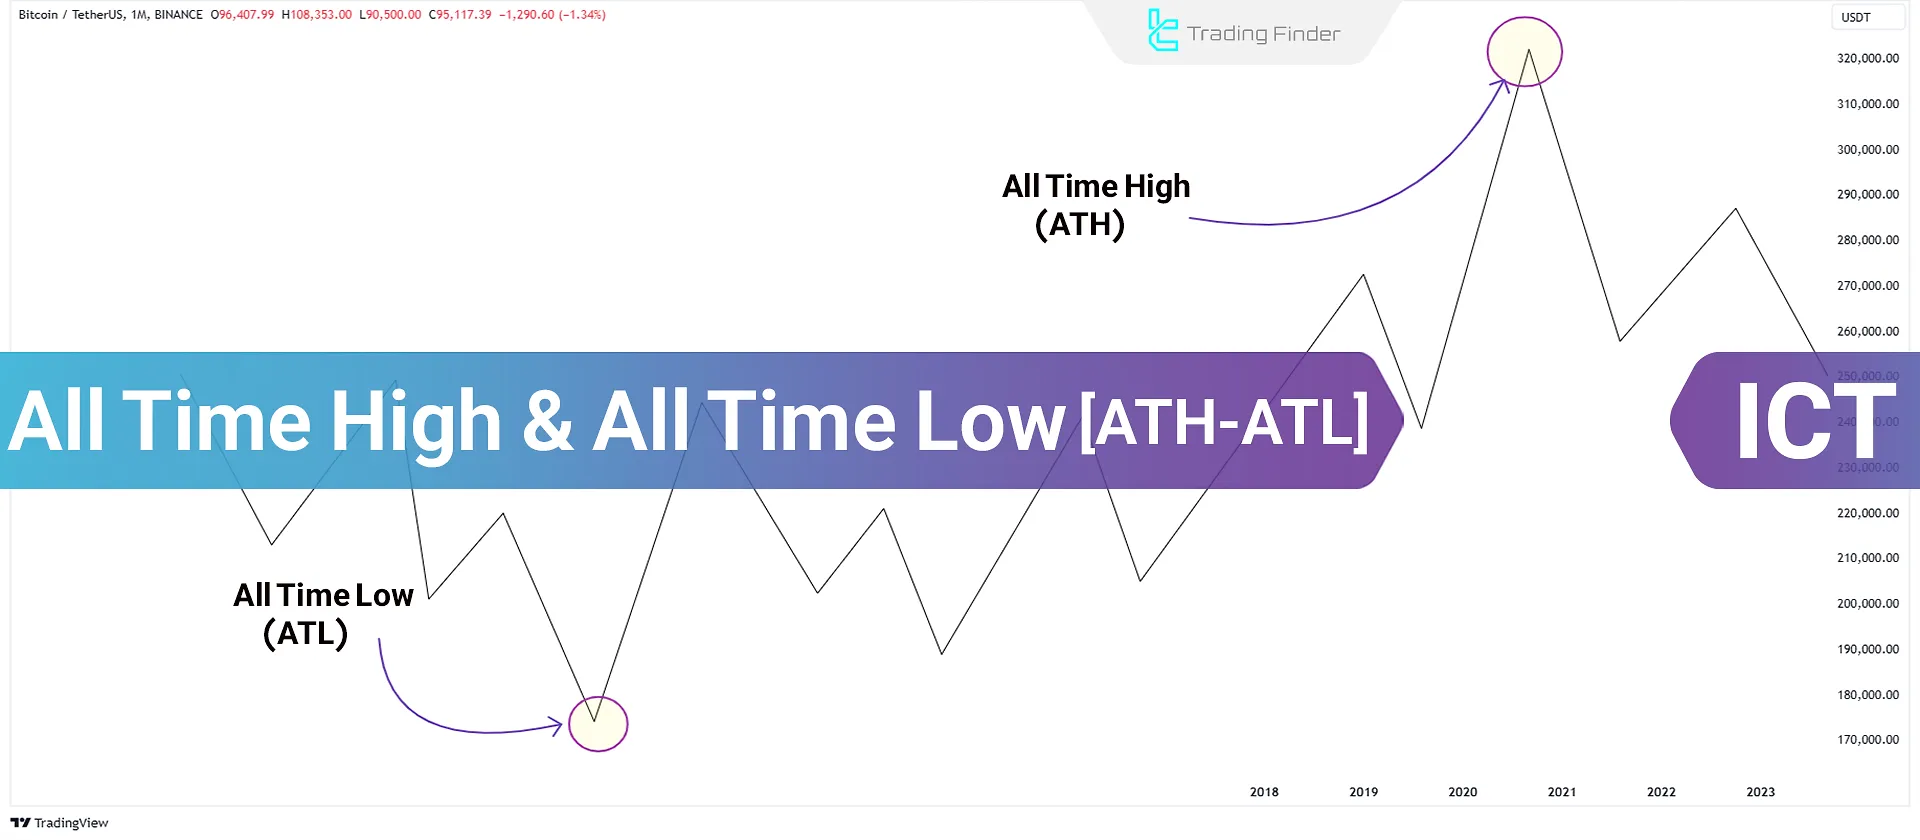
What is All-Time High (ATH)?
All-Time High (ATH) refers to the highest price a currency has reached throughout its history; in fact, this level represents the maximum value of the asset.
Educational video on how to use ATH from the DodgysDD YouTube channel:
This term refers to the highest price that a currency or asset has experienced. Applications of the all-time high price:
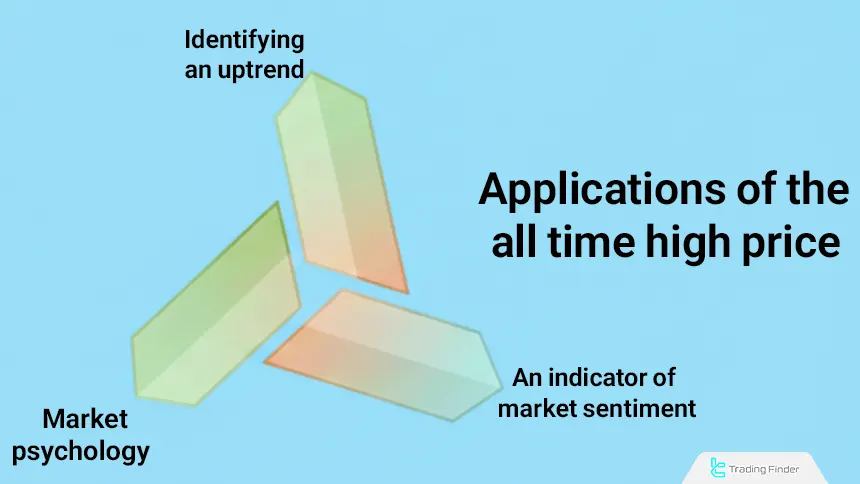
#1 Market Excitement
Reaching a new ATH reflects high excitement and investor confidence, often accompanied by increased trading volume and activity. In these conditions, the momentum of order flow increases, and the market structure enters a phase of demand-driven imbalance.
Typically, simultaneously with the formation of an ATH, upper-side liquidity zones are activated, and trading algorithms-detecting strong momentum reinforce order volume in the direction of the trend.
Following these behaviors, the depth of the order book on the sell side decreases, and even the smallest buy orders can intensify price movement, leading to the formation of strong breakouts.
#2 Market Psychology
The ATH level can act as a psychological resistance, leading investors to sell and potentially causing a price decline. Near this level, the combination of past expectations and the fear of losing profits (Disposition Effect) leads to an increase in emotional selling pressure.
Professional traders, by observing collective behavior, also target the sell-side liquidity zone and activate their pending orders at this level.
#3 Identifying Uptrends
Technical analysts use ATH levels to identify uptrends and forecast future price levels.
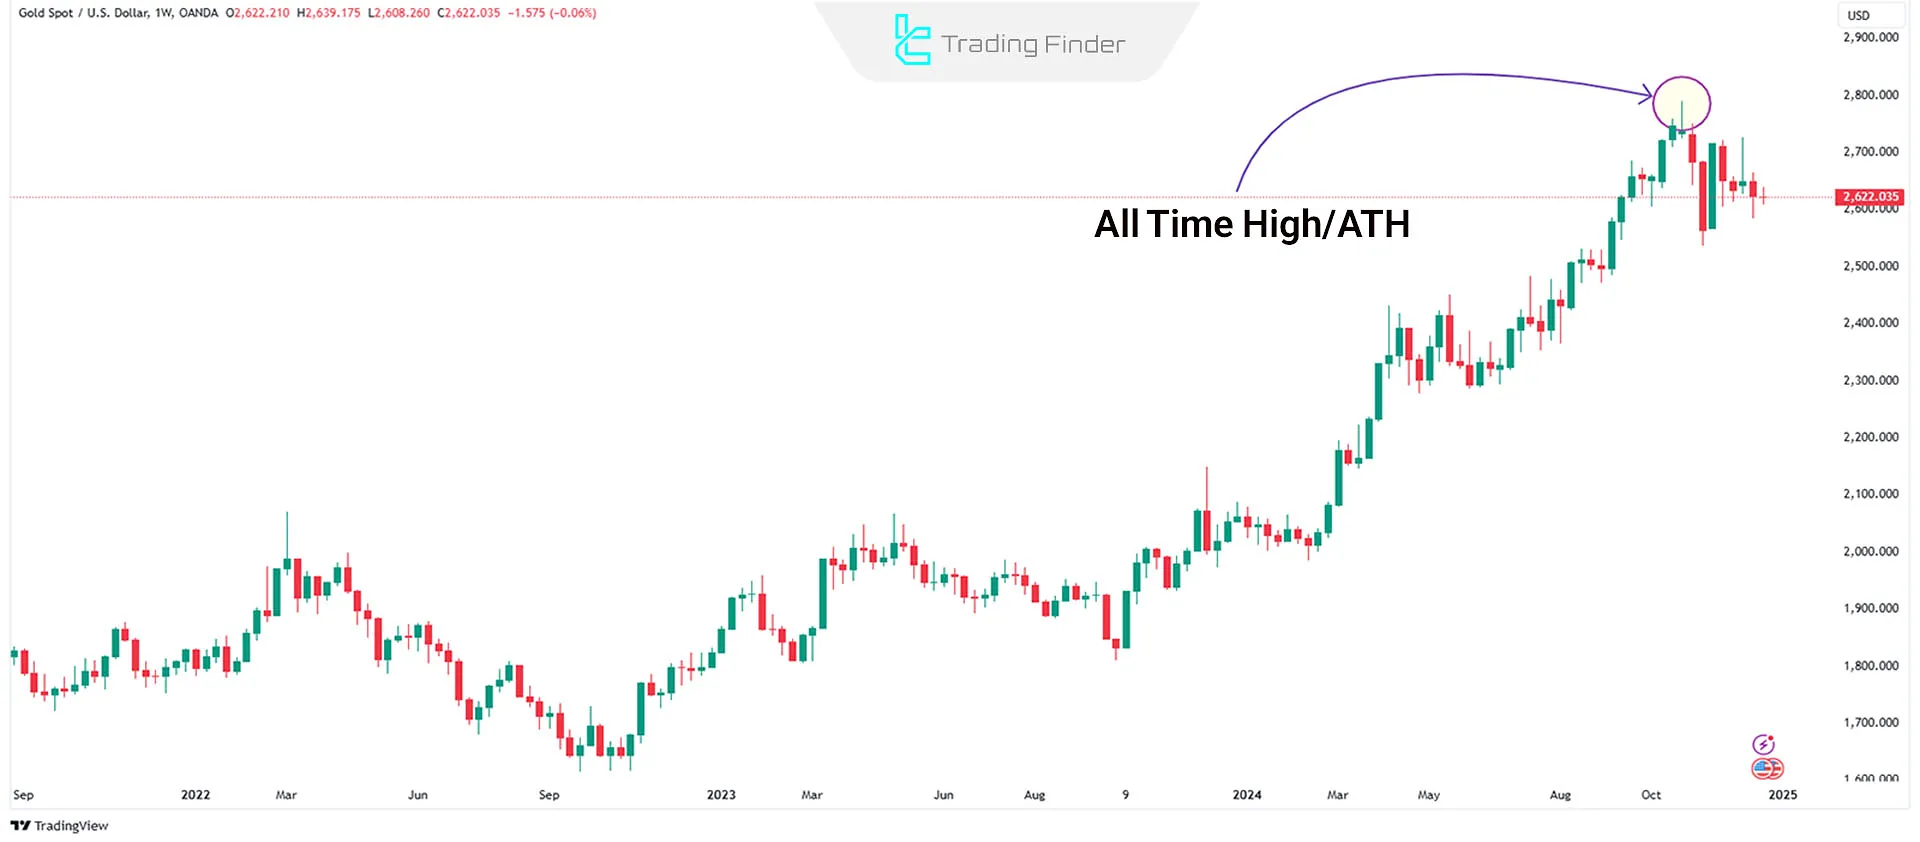
Example of All-Time High (ATH)
The gold chart against the US dollar (XAU/USD) shows the price reaching an all-time high (ATH) on the weekly timeframe; a point at which the market has touched its highest recorded value for the first time.
In this area, the increase in buying momentum and the break of long term resistances have led to the formation of an unprecedented peak.
Additionally, the price reaction after touching the ATH indicates the entry of selling pressure, profit-taking by traders, and the beginning of a short-term correction, which is considered common at such levels.
What is All-Time Low (ATL)?
This term refers to the lowest price ever experienced by an asset or currency. All-Time Low (ATL) refers to the lowest price a currency has reached throughout its history. In fact, this level represents the minimum market value of the asset.
#1 Reflecting the Minimum Value
The ATL represents an asset's lowest market value, often observed during its initial launch or periods of severe market pessimism. At these levels, selling pressure reaches its peak and downside liquidity is fully absorbed, a process that is often accompanied by a reduction in order book depth.
Near the ATL, algorithms and professional traders look for reversal price reactions (reversal signatures) to assess the likelihood of the end of the distribution phase and the beginning of accumulation.
This zone is typically used as a primary reference for evaluating valuation and downside risk, as a break below the ATL can push the market structure into a phase of severe instability.
#2 Opportunities for Buyers
ATLs provide opportunities to purchase assets at a low price, especially if an increase in value is anticipated. In this area, the risk-to-reward (R/R) ratio improves significantly, as a large portion of the price decline has already been absorbed.
Professional traders, by analyzing price behavior at the ATL, look for signs such as liquidity absorption, volume divergence, and the formation of structural lows to confirm low-risk entries.
If the price manages to hold the ATL and form an accumulation phase, this zone can become the starting point of long-term bullish trends and the return of investors.
#3 Significant Support Level
The ATL often serves as a strong support level, with prices rarely falling below it. The accumulation of buy orders and the increase in downside liquidity lead to the formation of a stable support base.
Structure-based traders consider the ATL a benchmark for identifying valid breakdowns versus fake-outs in a downtrend and closely monitor price behavior around it.
Holding this level indicates a reduction in selling pressure and the potential start of an accumulation phase a condition that can alter the market’s medium- and long-term trend.
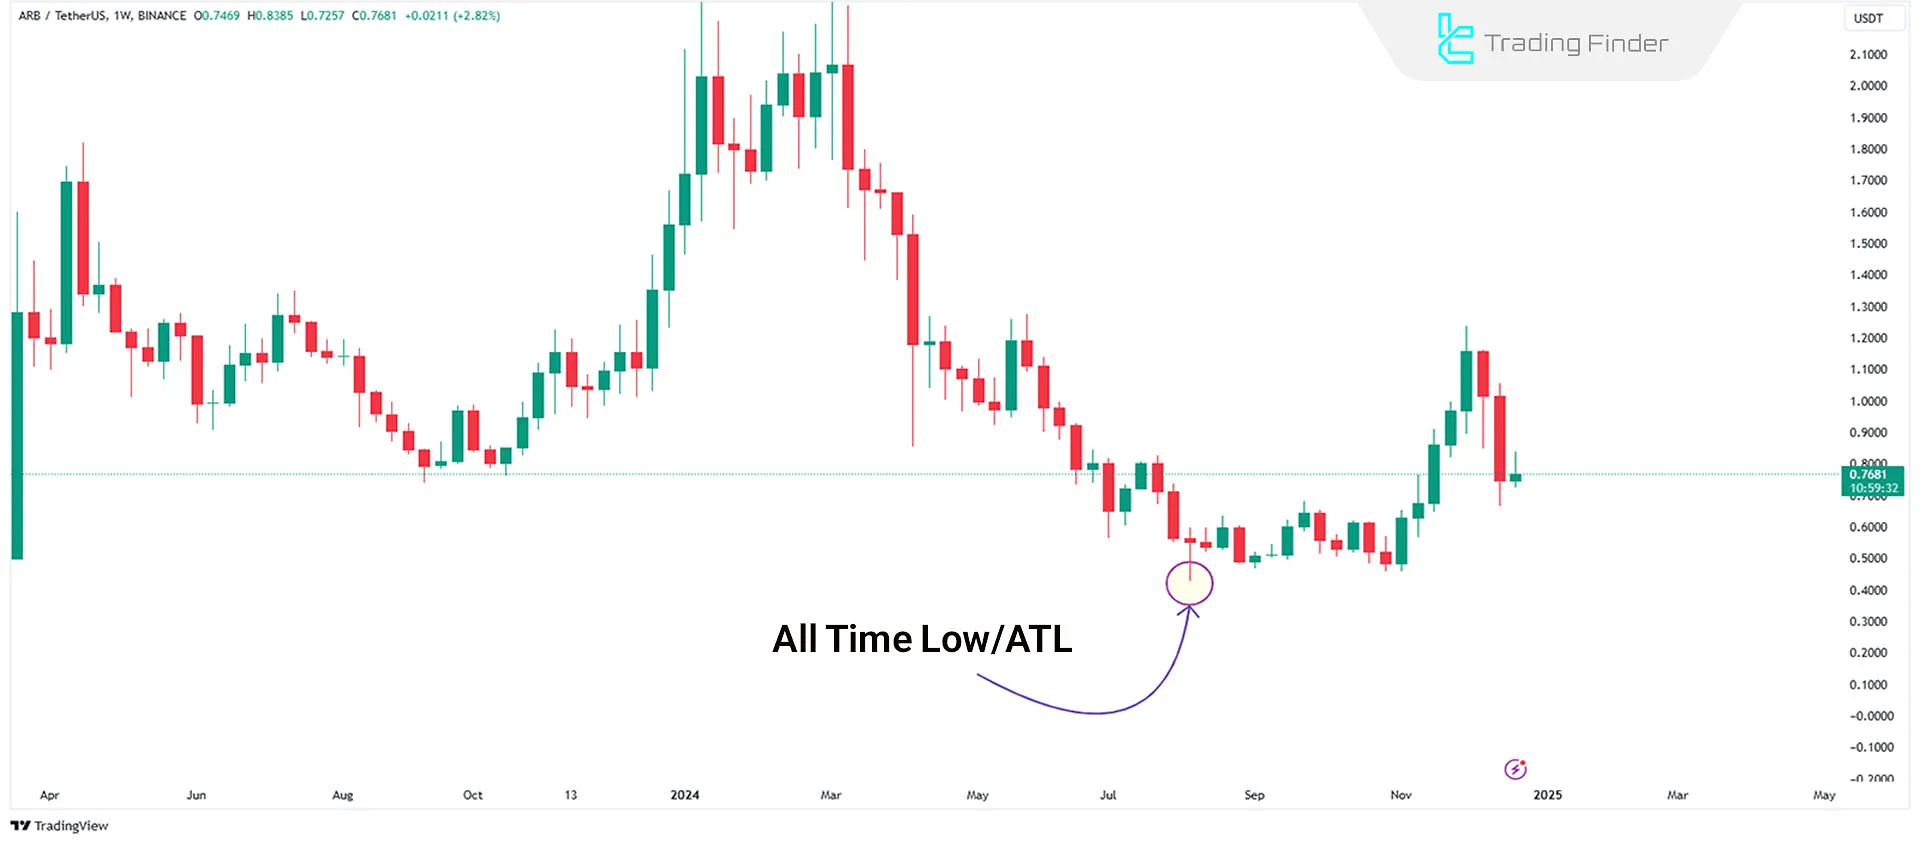
Example of All-Time Low (ATL)
A weekly chart of the ARB/USDT cryptocurrency demonstrates that the price has reached its historical low (ATL). At this level, selling pressure has reached its extreme, and the absorption of downside liquidity has led to the formation of an initial bullish reaction.
The price movement after touching the ATL indicates that the market is entering an accumulation phase and reclaiming sellers’ liquidity, increasing the probability of a short-term trend reversal.
Differences Between ATH and ATL
ATH and ATL zones each reflect different states of supply and demand equilibrium, and analyzing them helps identify trend strength and liquidity behavior. Training on the differences between ATH and ATL from the Coinbase website:
Table of differences between All-Time High (ATH) and All-Time Low (ATL):
Comparison Item | All-Time High (ATH) | All-Time Low (ATL) |
Definition | The highest price recorded to date | The lowest price recorded to date |
Indicates | Maximum value and peak demand | Minimum value and peak selling pressure |
Psychological nature | Psychological resistance and tendency to take profits | Psychological support and tendency to buy cheaply |
Price behavior | Possibility of correction or continuation of the uptrend after a breakout | Possibility of an initial bounce or continuation of decline after a breakdown |
Entry risk | High risk due to buying at the top | Lower risk if accumulation signs are present |
Trading volume | Increase in buying volume and strong breakouts | Increase in selling volume and high volatility |
Analytical use | Estimating higher targets and measuring momentum | Identifying value zones and structural lows |
Liquidity absorption | Activation of buy-side liquidity | Activation of sell-side liquidity |
Relation to market structure | Sign of expansion phase in an uptrend | Sign of the end of a decline or start of accumulation |
Trader behavior | Profit-taking and selling at the peak | Scaling-in buys and liquidity absorption |
Using the Previous Highs and Lows Indicator to Identify ATH and ATL
The Previous Highs and Lows indicator is a specialized technical analysis tool that identifies market structure and key reaction points by extracting the highest and lowest price values from past data.
By continuously marking High and Low levels, this indicator shows traders the areas where price tends to reverse, consolidate, or experience structural breaks. Educational video on Previous Highs and Lows:
Since these levels are essentially shorter-term versions of ATH (all-time high) and ATL (all-time low), price behavior around them reflects similar patterns of supply, demand, and market phase transitions.
The core logic of the indicator is based on identifying recent maximum and minimum points in the market. These points, like their large-scale counterparts-ATH and ATL-act as psychological and liquidity reference levels.
When price approaches a previous high, the likelihood of selling reactions or strong breakouts increases, a pattern similar to price reaching an ATH on a larger scale.
Conversely, interaction with a previous low can signal a reversal or confirm the continuation of a downtrend-just like price behavior around the ATL. In both cases, these zones activate buy-side or sell-side liquidity and define the market’s next path.
By plotting fixed or dynamic lines, the Previous Highs and Lows indicator plays an important role in identifying valid breakouts, fake-outs, and changes in trend structure.
A break above a previous high signals increased buying pressure and movement toward higher targets, while a break below a previous low usually confirms strengthening selling flow.
In this way, traders can analyze market structure step by step and determine the price’s position relative to its key reference points.
Ultimately, by accurately identifying past High and Low levels, this indicator delivers functionality similar to analyzing price behavior around ATH and ATL-but on a shorter, more practical scale for everyday decision-making.
This feature makes it an efficient tool for defining entry and exit zones and managing risk.
Download links for the Previous Highs and Lows indicator:
- Previous Highs and Lows indicator for MetaTrader 4
- Previous Highs and Lows indicator for MetaTrader 5
Conclusion
Both concepts, “ATH” and “ATL,” represent the peak and trough points of asset prices. The all-time high reflects the market’s maximum value and excitement and acts as a resistance level. In contrast, the all-time low defines the asset’s minimum value and provides an opportunity for buying at lower prices.
Evaluating price behavior relative to these levels offers a clear view of trend strength and the market’s willingness to take risk. Moreover, the breakout or hold of ATH and ATL can initiate new phases of accumulation, distribution, or market structure shifts, thereby defining the future price path.


