


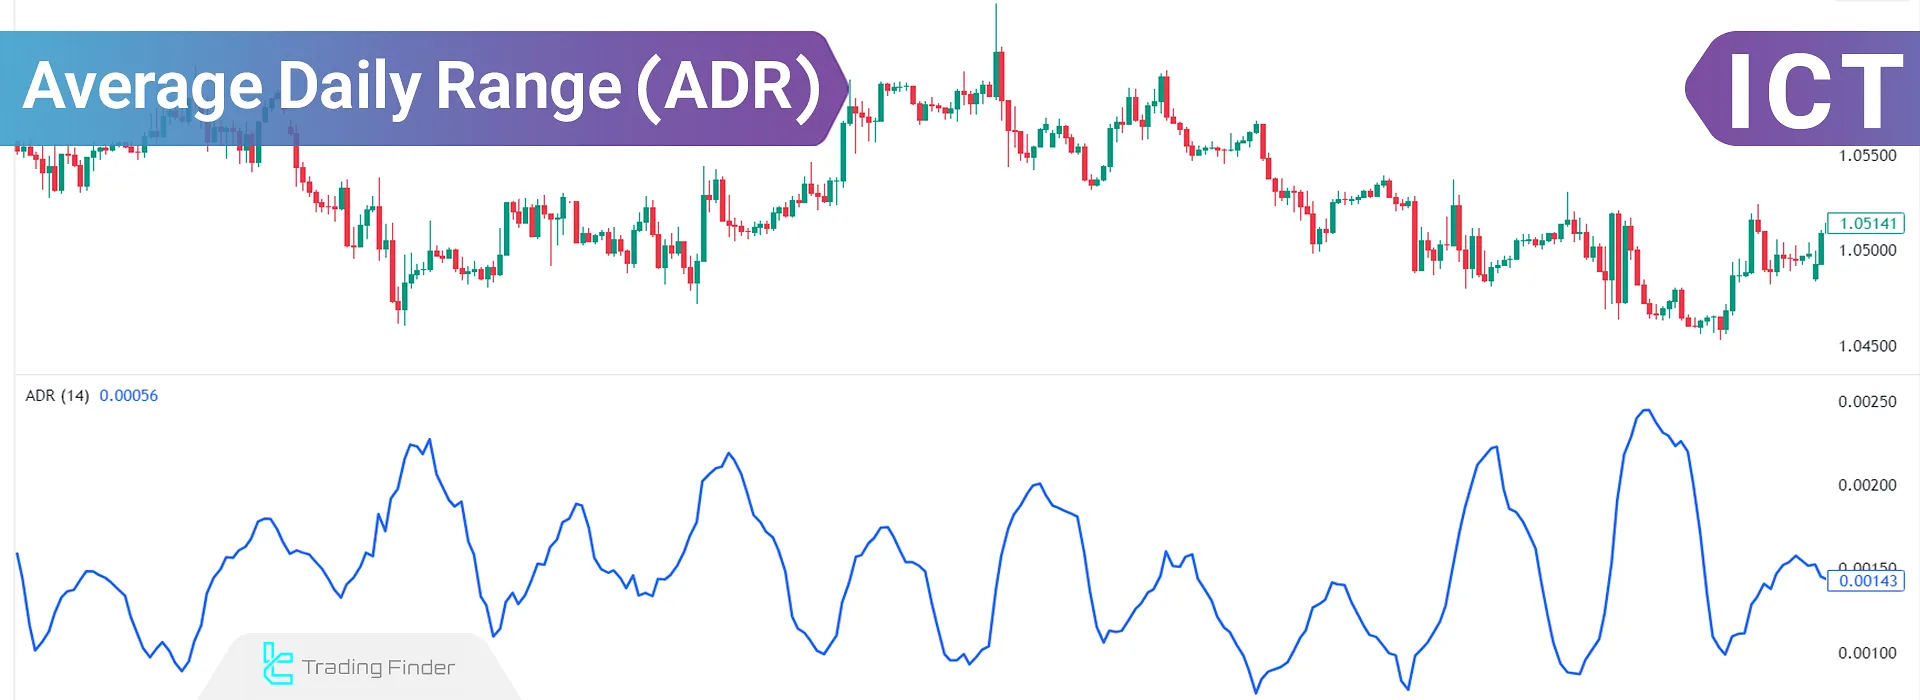
The average daily range is a core volatility metric in price analysis and within the adr ict framework, it refers to the amount of price movement, meaning the difference between the high and low of a currency pair during a single trading day.
This indicator shows the average capacity of the market for daily volatility and what magnitude of movement is considered reasonable for that day, which is a central concept in ict adr based analysis.
The ADR value is calculated based on historical data and helps the trader determine whether the current price movement is within the normal daily range or has entered an excessively extended phase.
When a large portion of the ADR has already been consumed, the probability of price momentum slowing down increases, and the remaining space for further continuation becomes more limited.
What Are the Uses of Average Daily Range (ADR)?
The Average Daily Range (ADR) is used to estimate market volatility, set take profit (TP) and stop loss (SL) levels, and improve risk management. The key applications of ADR include:
Estimating Market Volatility
The Average Daily Range (ADR) helps assess the volatility of a currency pair throughout the trading day. This allows traders to anticipate potential price movements.
This indicator provides a precise view of the market’s movement capacity for the current day by comparing the present daily range with the average volatility of previous days, which is a key concept in average daily range forex analysis.
Using ADR alongside the daily bias and liquidity levels leads to more realistic price target setting and helps prevent unreasonable expectations of market movement.
Setting Take Profit and Stop Loss Levels
Using ADR, traders can set take profit (TP) and stop loss (SL) levels with greater accuracy, as it provides insight into the expected price movement range for the day.
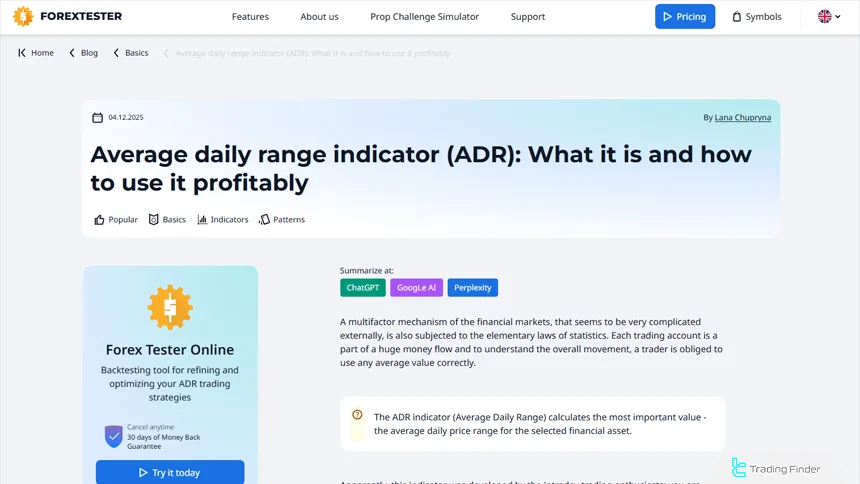
In the ADR training article on the ForexTester website, this indicator is explained in full detail.
Using ADR to Define Stop Loss and Target
With the daily movement range clearly defined, traders can better understand the normal ict range of price behavior, which closely reflects the typical forex daily range observed in active markets.
When an entry is executed near the beginning of the adr range, logical targets are typically defined between 50% and 90% of the ADR. Additionally, placing the stop loss outside the consumed portion of the ADR helps reduce premature exits.
Setting targets beyond the ADR capacity decreases the probability of achieving profit within the same trading day.
Risk Management
By considering the daily range, traders can avoid entering trades in extreme volatility conditions or during low-liquidity periods.
When price has already traveled through a large portion of the ADR, the remaining movement capacity for continuation becomes limited, and the risk-to-reward ratio of new entries weakens.
This behavior becomes even more significant when analyzed within the ict dealing range, as it clarifies how much of the session’s potential has already been utilized based on the average day range derived from historical data and the average daily range formula.
Identifying Trending and Ranging Days Using ADR
On days when price consumes a large part of the ADR during the early trading hours, the market transitions into a trending structure. Conversely, when ADR consumption is slow and corrections are deep, the market structure tends to be ranging. This plays an important role in filtering trading signals.
Rapid ADR consumption during the early hours typically establishes a continuation structure for the rest of the day.
This concept is explained in video format on the FXN Trading Group YouTube channel:
Entry Strategy Based on ADR Consumption Percentage
The percentage of ADR consumed at the moment of entry directly defines the remaining price movement capacity and the trade’s risk-to-reward ratio.
- Low-risk entry within the 20% to 35% daily ADR consumption zone;
- Medium-risk entry within the 45% to 60% ADR consumption range;
- High-risk entry when ADR consumption exceeds 70%;
- Reduction of remaining price movement capacity as the ADR consumption percentage increases;
- Gradual decline of the risk-to-reward ratio for entries executed after most of the ADR has been consumed.
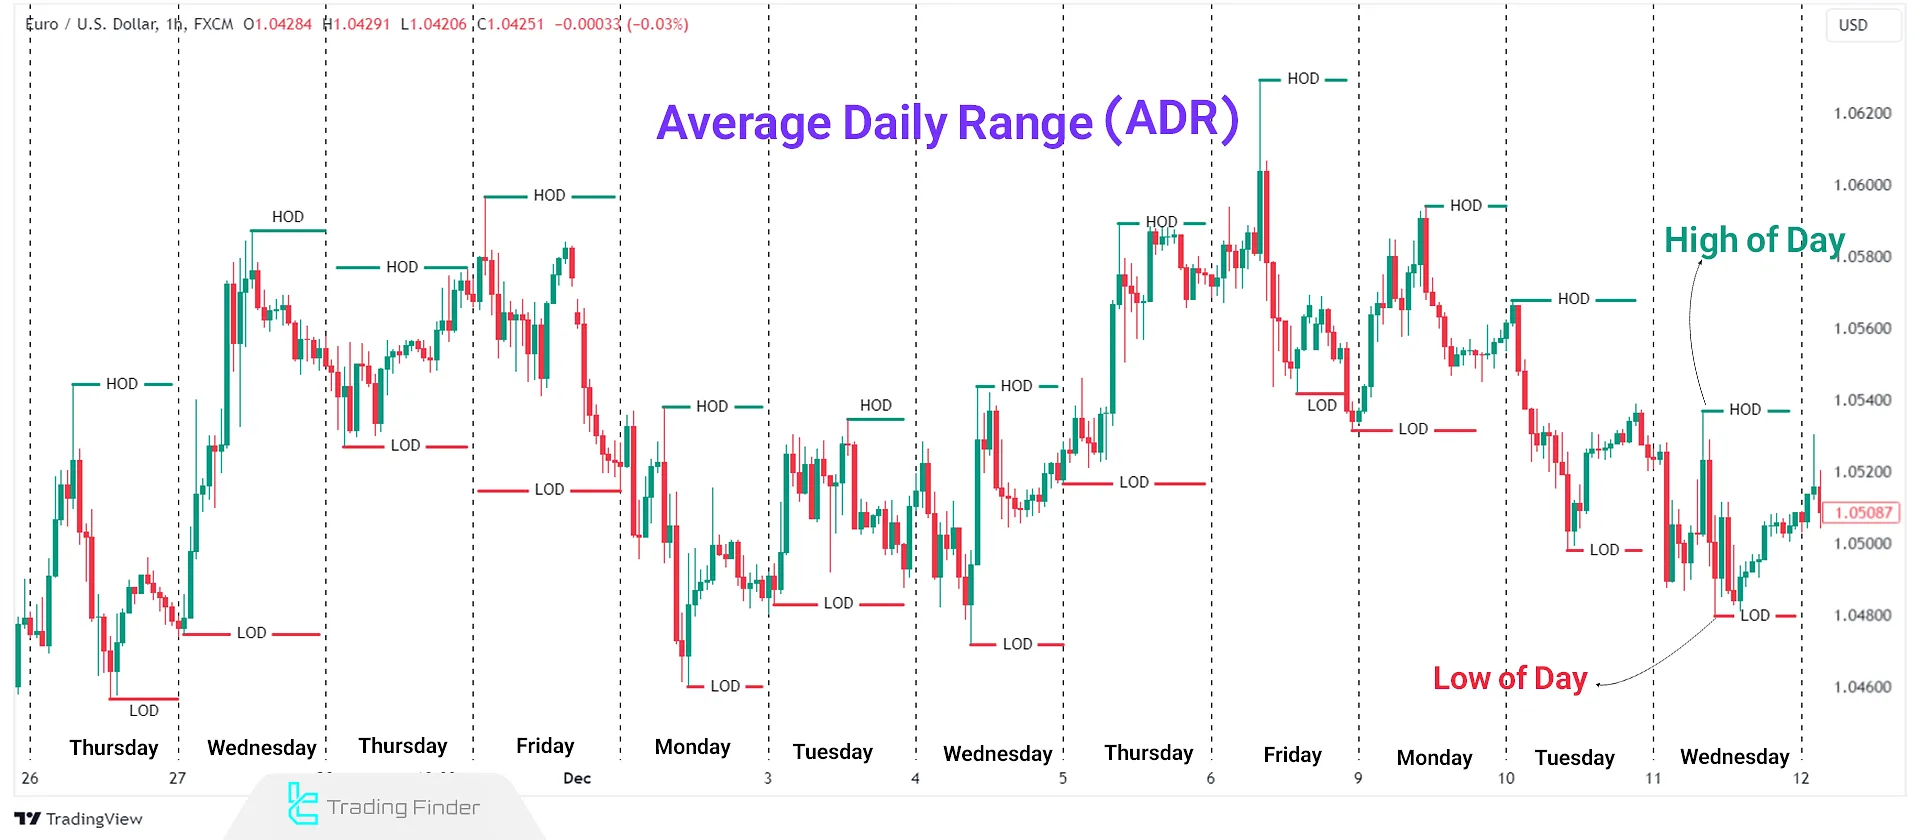
How to Calculate ICT Average Daily Range?
Historical price data is analyzed to calculate the ICT Style AverageDaily Range. This data reflects the average difference between the high (HOD) and low (LOD) prices of a currency pair over time.
Steps to calculate ADR:
- Collect historical price data for the selected currency pair;
- Identify the High of the Day (HOD) and Low of the Day (LOD) for each day within the chosen time frame;
- Calculate the daily range by subtracting the low from the high;
- Sum the daily ranges and divide by the number of days to find the average.
Setting ADR Based on the Trading Timeframe
Short-term traders usually use a 5-day ADR. Day traders require a 10- to 14-day ADR, while in swing trading, a 20-day ADR provides higher accuracy. Choosing the wrong ADR period causes serious errors in estimating the price movement range.
A mismatch between the ADR period and the entry timeframe leads to structural errors in movement range estimation, which directly impacts the effectiveness of an average daily range trading strategy within professional execution.
Difference Between Classic ADR and ADR in the ICT Style
The classic Average Daily Range only calculates the difference between the High and Low over a defined period. In the ICT style, in addition to the ADR value, the manner in which it is consumed is also important.
In this approach, analysis focuses on where within the ADR price shows the highest momentum and which portion of the movement is devoted to liquidity collection.
In ICT, the ADR value without analysis of movement distribution has no independent analytical validity, which becomes especially critical when interpreting daily range forex behavior across different market sessions.
Comparison Table of Classic ADR and ADR in the ICT Style:
Comparison Criteria | Classic ADR | ADR in ICT Style |
Calculation Basis | Average difference between High and Low over a specified period | ADR value combined with analysis of price movement consumption |
Primary Focus | Numerical value of daily volatility | Price behavior within the ADR range |
Role of Liquidity | Not considered in calculation | ADR consumption analyzed based on liquidity collection and attacks |
Validity of ADR Value | The number itself serves as a standalone decision basis | The number has no independent validity without analysis of movement distribution |
Application in Entry | Only for estimating movement range | Used for entry filtering, movement exhaustion detection, and precise timing |
Relationship with Market Structure | No direct relationship | Dependent on market structure, Order Block, and order flow |
Average Daily Range (ADR) Indicator
The Average Daily Range indicator, or Average Daily Range (ADR), is an analytical tool for measuring the true range of price volatility within a single trading day and plays a key role in defining the ict range of market movement.
This indicator, by calculating the distance between the daily high and low, shows the trader how much movement capacity the market typically has during the day and when a large portion of this capacity has already been consumed, which is central to adr trading decisions.
Correct understanding of this range creates a more realistic view of the potential for price continuation within the same day.
When price approaches the upper section of the ADR range, it is often accompanied by a decline in buyer strength and the probability of the market entering a corrective phase or temporary pause increases.
Conversely, when price reaches the lower section of this range, selling pressure weakens and conditions become favorable for the formation of reversal reactions.
For this reason, ADR levels are considered reference zones for evaluating potential reversal or continuation points of price movement in adr in trading, especially when aligned with the ict daily bias.
This indicator falls into the category of analytical tools related to volatility, support and resistance, and risk management, and has high practical value for traders with an intermediate level of skill.
ADR, by displaying the true daily movement range, prevents premature entries under conditions of price exhaustion or limited movement space and enables more logical adjustment of entry and exit points.
Within an uptrend structure, price reaction to the lower ADR boundary is usually interpreted as daily support, while in a downtrend, contact with the upper boundary plays the role of daily resistance.
The alignment of these levels with signals such as reversal candles or a decline in price momentum increases the validity of the analysis.
The settings of this indicator include the candle calculation period for extracting the ranges, the type of line display, their thickness, and their color, which makes it possible to align the indicator’s appearance with each trader’s analytical style.
In summary, ADR is a practical tool for identifying daily volatility highs and lows, evaluating the remaining space for price movement, and planning trades more precisely within the framework of daily volatility.
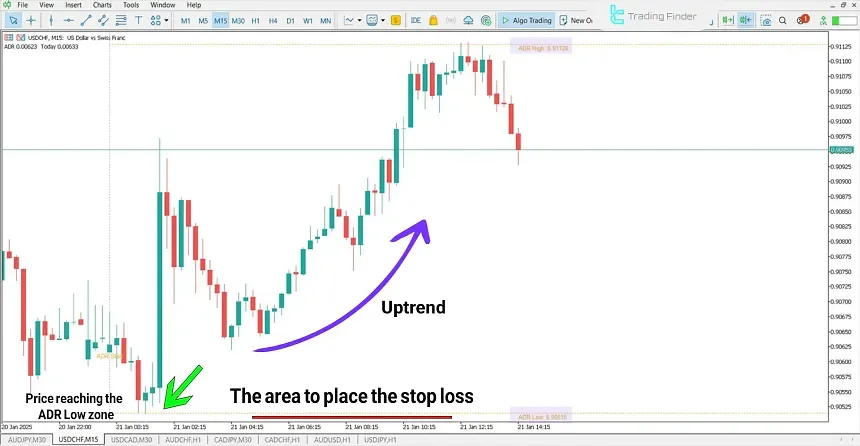
Example of a Buy Entry After Price Reaction to the ADR Low Zone in an Uptrend
In this scenario, after a short-term correction, price reacts to the ADR Low zone and signs of seller weakness are visible in the candles. Lower shadows and reduced selling pressure indicate that this area has acted as daily support.
After price stabilizes and breaks the high of the corrective candle, a buy entry is executed and the stop loss is placed slightly below the reaction low.
Considering the remaining daily movement capacity, the target is set in the mid-range and near the upper boundary of the daily range, and price moves toward it in line with the trend structure.
Combining ADR with Order Block and FVG
When price retraces from a Fair Value Gap or an Order Block within the mid-range of the ADR, the probability of continuation toward higher targets increases. In contrast, the formation of an Order Block at the extreme end of the ADR usually signals the end of the daily move.
A strong reaction in an FVG simultaneous with the completion of the mid portion of the ADR increases the validity of the move.
Integrating ICT Average Daily Range with Intraday Strategies
The Average Daily Range (ADR) is useful in intraday trading and Smart Money Concept strategies. This tool allows traders to predict daily market movements and enhance their strategies.
Relation of ADR with Internal and External Liquidity
At the beginning of the daily movement, a large portion of the ADR is spent on collecting internal liquidity. As price moves closer to the end of the ADR, attacks on external liquidity begin to form.
When price reaches the end of the ADR range, the probability of a market reversal increases. The strongest attacks on external liquidity usually occur near the final section of the ADR.
Combining ADR with Trading Sessions
The main part of the market’s daily movement is often formed during the London session and the London-New York overlap. If only a small portion of the ADR is consumed early in the day, the probability of continuation during later hours increases.
In contrast, when a large part of the ADR is already completed before the New York session opens, the market usually enters a ranging phase or a short-term correction.
The difference in ADR consumption between the Asia and London sessions defines the main directional movement of the day.
The Role of ADR in Identifying Daily Highs and Lows
After a specific percentage of the Average Daily Range has been completed, the probability of forming the daily high or daily low increases.
When price reaches the 80% to 100% ADR zone, the ability to continue moving weakens and the market enters a pause or corrective phase. By evaluating these zones, suitable areas for trade exits or for avoiding late entries can be identified.
Reaching the end of the ADR without a structural break is a sign of weakening order flow for further continuation.
Difference in ADR Behavior between Forex and Crypto
ADR behavior in these two markets differs structurally in terms of speed of change, source of volatility, and sustainability of price movements, which directly affects trading decisions.
Comparison Table of Average True Range Behavior in Forex and Crypto:
Comparison Criteria | Forex Market | Crypto Market |
ADR Change Speed | Gradual and predictable | Fast and sudden |
Primary Source of Volatility | Interbank liquidity and economic data | Emotional order flow and news |
Movement Stability | Structured and phased | Explosive and highly volatile |
Need for ADR Recalibration | Periodic | Daily or even hourly |
Risk of Sudden ADR Expansion | Low | High |
Reliability of Using Fixed ADR | Reliable | Limited and condition-dependent |
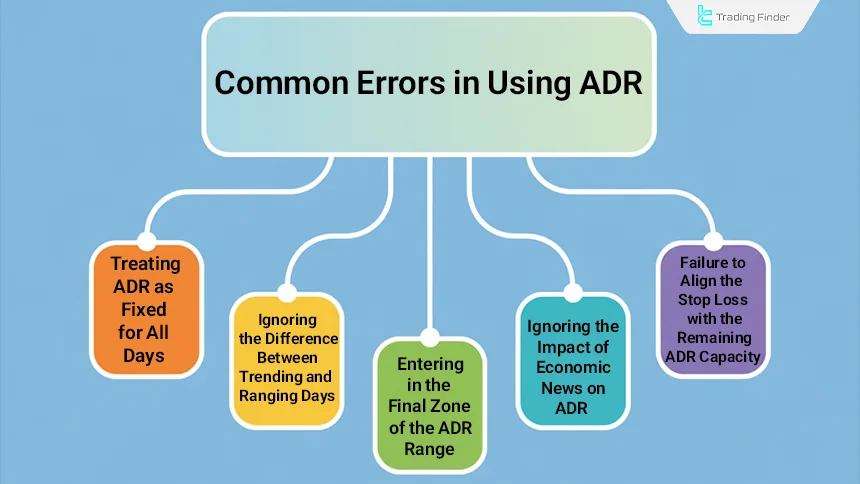
Common Errors in Using ADR
Some errors in interpreting ADR cause the market’s movement range to be misjudged, leading to structural distortion in entry and exit decisions.
Common mistakes in using ADR:
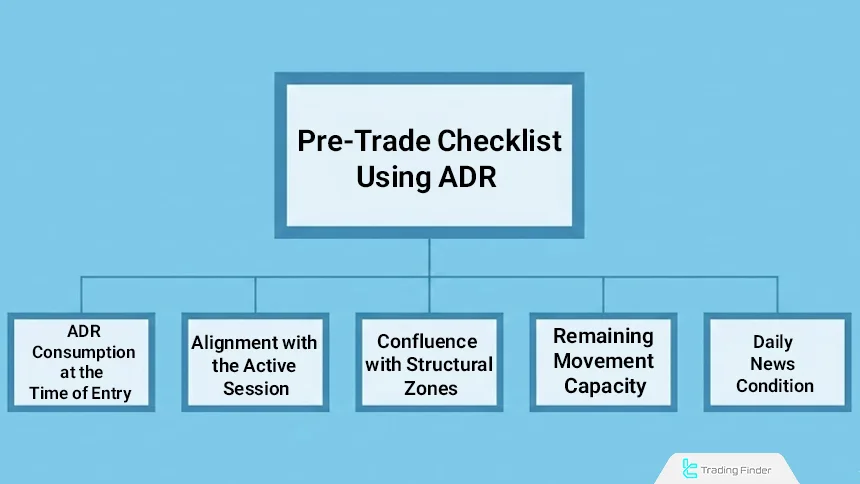
ADR Pre-Entry Checklist
Before any entry, simultaneous evaluation of the daily range condition with market structure ensures that the entry point falls within a logical zone of daily volatility.
Pre-trade checklist using ADR:
- ADR consumption at entry time: evaluating the amount of ADR consumed at the moment of the entry decision;
- Alignment with active session: matching the entry location with the active market session;
- Confluence with structural zones: aligning the entry point with an Order Block or FVG;
- Remaining movement capacity: assessing the distance from entry to the end of daily movement capacity based on ADR;
- Daily news condition: evaluating the impact of the day’s economic news on the volatility range.
Conclusion
The Average Daily Range (ADR) is a valuable tool for estimating daily market volatility. It helps determine the expected price movement range of a currency pair throughout the day. Additionally, ADR can be used to set take profit, stop loss levels and optimize risk management.
When the take profit or stop loss is placed outside the logical ADR range, the probability of it being reached within the same trading day decreases, and the structure of the trading plan becomes unbalanced. Aligning exit levels with the market’s daily behavioral range creates better coordination between structural analysis and trade execution.


