


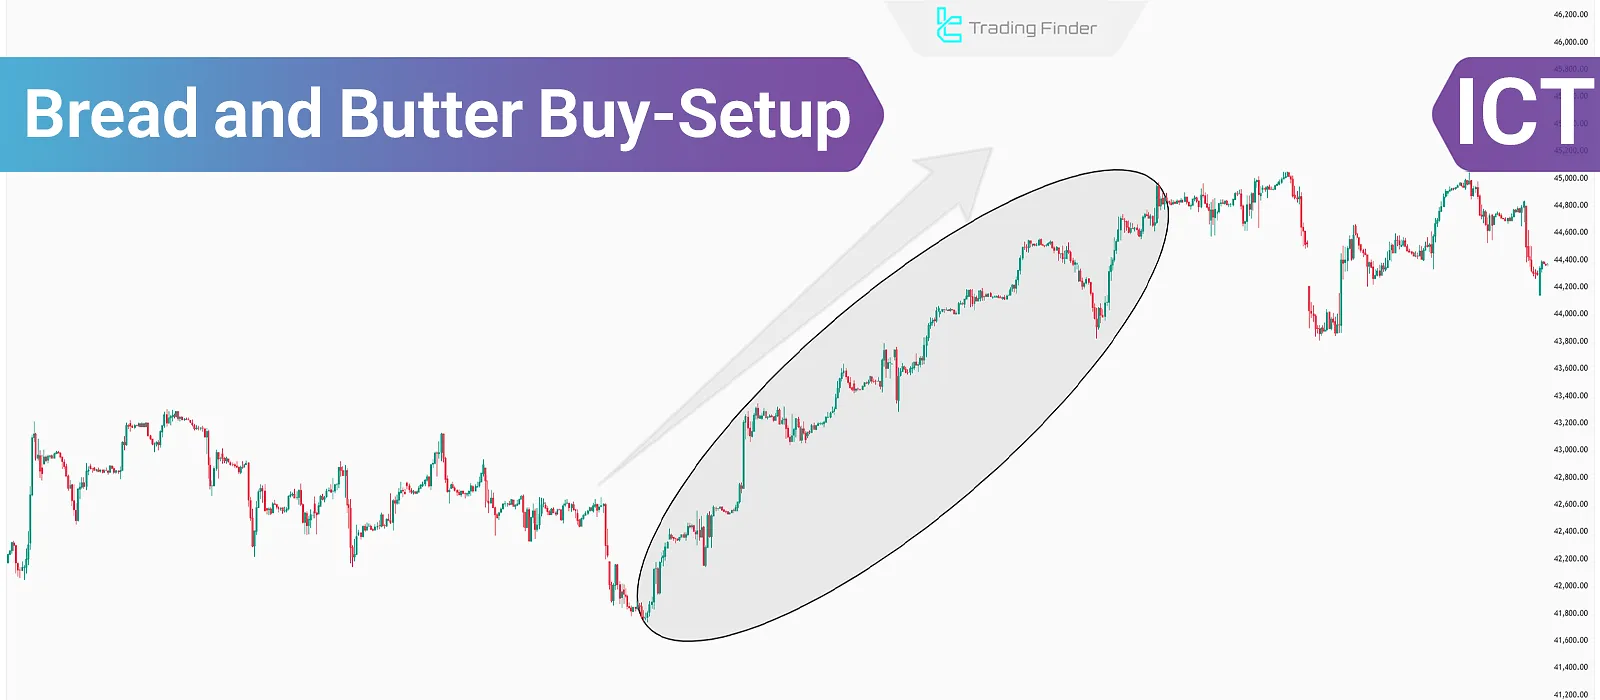
When the Daily Bias in a higher time frame (HTF) is bullish, the ICT Bread and Butter Buy-Setup provides signals to enter buy positions.
The Bread and Butter Strategy is suitable for day trading and, by leveraging ICT style concepts, offers entry points for short-term trades during each trading session.
Alignment of this setup’s trades with the daily bias increases the success rate, and with proper risk and capital management, the account’s overall outcome remains positive. In fact, the structure of the ICT bread and butter setup is naturally aligned with the liquidity-flow approach.
What Is the Bread and Butter Buy Trading Setup?
When, based on institutional order flow in the higher time frame (HTF), the daily bias is bullish, the market typically opens near the day's low.
In these cases, there's a high probability of a liquidity grab beneath the day's low to fuel an upward movement.
The Bullish Bread and Butter in the ICT Trading Style identifies optimal buy opportunities by tracking price movement during these conditions.
This setup has been taught in video format on the InnerCircleTrader YouTube channel.
Pros and Cons of the Bread and Butter Trading Strategy
This Trading Strategy aligns with the daily bias, increasing the win rate. However, using this strategy to pinpoint precise entries requires a strong understanding of liquidity behavior and considerable experience.
Pros and Cons of the ICT Bread and Butter Buy-Setup:
Pros | Cons |
Multiple signals during the day | Lower risk-to-reward ratio |
Covers all 3 major trading sessions | Requires a deep understanding of liquidity behavior |
Aligns with daily trend | Relies on specific hours of the day |
Multi-timeframe analysis and market structure use | Each signal depends on the success of previous one |
Goals and Realistic Characteristics in the Bullish Bread and Butter Setup
When using the bullish Bread and Butter setup, traders should maintain logical expectations regarding returns and trade duration.
This model is designed for intraday trading, and in a higher-timeframe bullish bias, the primary target is achieving at least 30 to 50 pips of profit per trade.
Many traders consider this method part of a Bread and butter strategy that operates based on liquidity behavior.
The average holding time ranges from one to two hours and may be shorter in volatile conditions.
The main focus should be entering within Discount Arrays and exiting in Premium Arrays.
Number of Setups and Pattern Frequency Throughout the Week
The bullish Bread and Butter setup typically generates two to three trading opportunities per day.
Across a week, more than fifteen similar setups may form, repeating during the London, New York, London Close, and Asia sessions.
This behavior is one of the key features of any Bread and butter trading strategy.
Such frequency offers a suitable opportunity for day traders to select only one high-probability setup per session and avoid excessive, high-risk trades.
Risk Management and Risk-to-Reward Ratio in the Bread and Butter Setup
In this strategy, the risk-to-reward ratio is usually around one to one, although depending on the depth of the retracement and the session type, it may turn out better.
The recommended risk per trade is between half and one percent of total capital. This level of risk allows the trader to keep the account stable even after several consecutive losses.
The logical and rule-based structure of this model places it within the Bread butter strategy category.
Setting a logical stop loss behind the order block and targeting realistically within premium zones are essential principles of this setup.
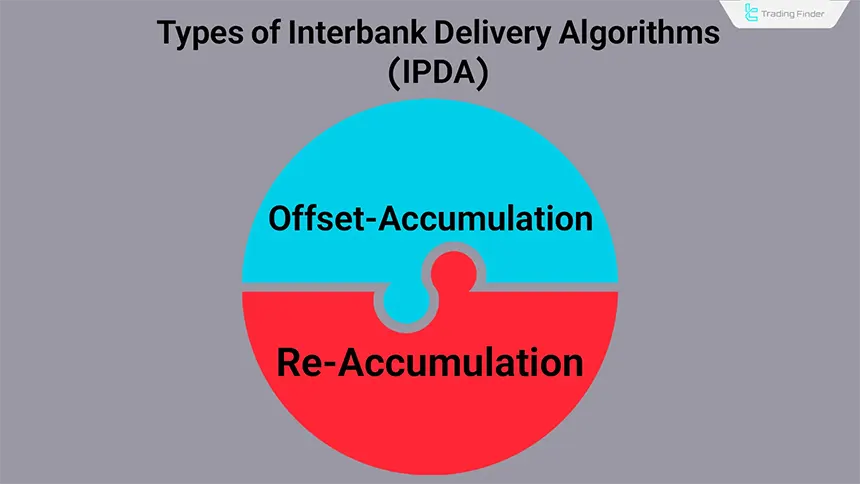
IPDA Delivery Algorithm in the Bread and Butter Buy-Setup
In contrast to the bearish variant, the Interbank Price Delivery Algorithm (IPDA) in the Bread and Butter buy Setup operates in two forms:
- Offset Accumulation
- Re-Accumulation
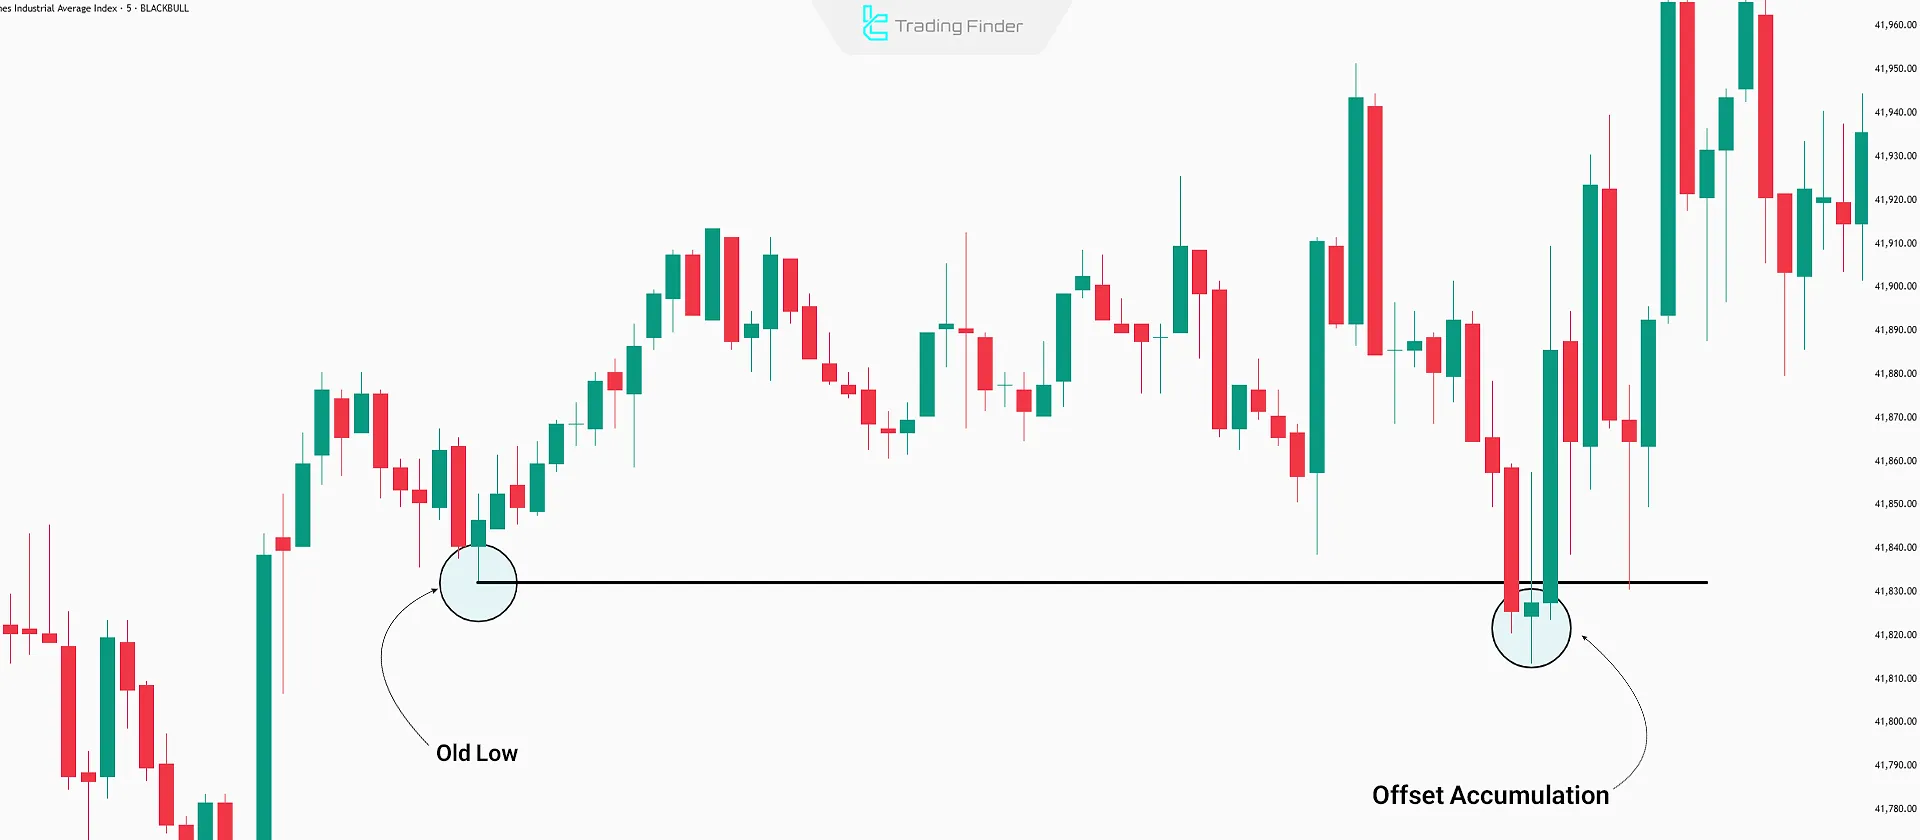
Offset Accumulation
In this model, IPDA pushes the price below a key support level, activating old buy stop-losses. This action invites new buyers at lower prices.
As liquidity is absorbed through the activation of stop-loss orders, the market gathers the liquidity required for its next move, allowing the price structure to prepare for a reversal.
This behavior often serves as a precursor to a strong bullish movement within liquidity-based models.
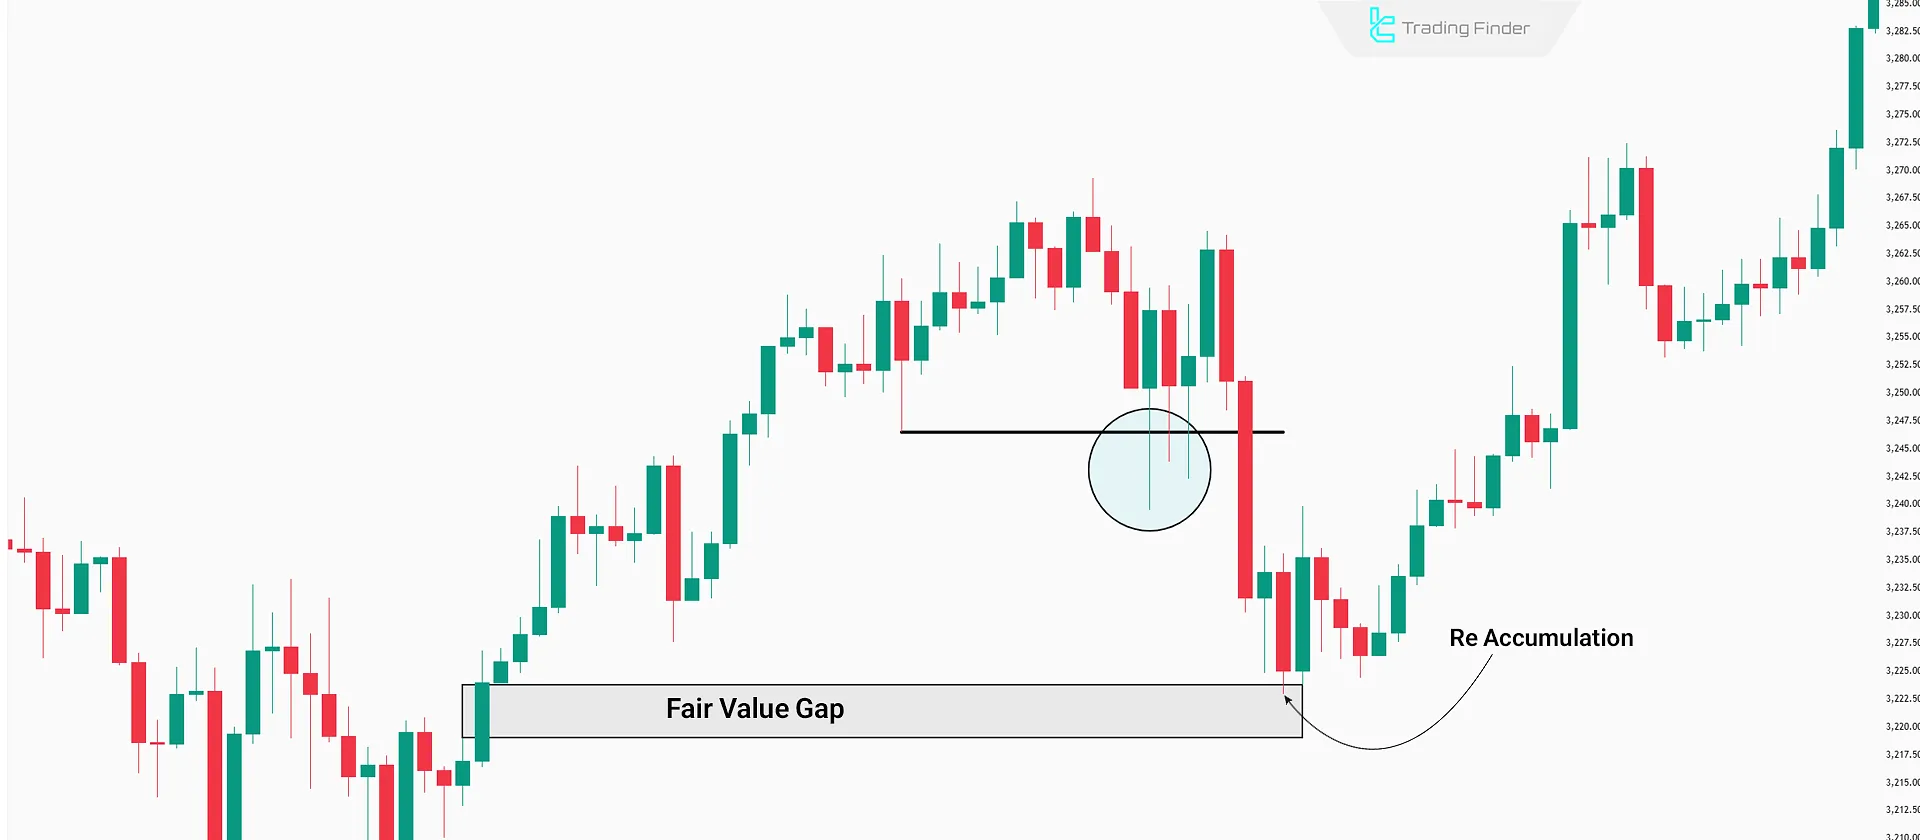
Re-Accumulation
To create entry conditions for smart money, the Re-Accumulation model drives prices toward high-liquidity areas, such as Fair Value Gaps(FVGs).
This creates fear among high-price buyers and forces some to exit with losses.
Key Points in Using the IPDA Algorithm in the Bread and Butter Setup
In this setup, the Interbank Price Delivery Algorithm (IPDA) plays a decisive role in identifying the depth of the retracement and the entry zone.
In the indirect accumulation model, entry occurs after price moves below local lows and absorbs liquidity.
In the re-accumulation model, we wait for price to return to the Fair Value Gap (FVG) and for a confirming candle to form within the discount zone.
Understanding the difference between these two models helps refine the entry point in each session and prevents premature entries.
The concept of the Interbank Delivery Algorithm is fully explained in the IPDA training article on the Writo Finance website.

Key Parameters of the Bullish Bread and Butter Setup in Different Sessions
In this section, the following table can be used to compare the structure of the setup across the three main sessions (London, New York, and Asia).
The table summarizes key characteristics of each session including active time, primary entry type, target range, stop loss, and important trading notes.
Trading Session | Active Time | Primary Entry Type | Target Range (pips) | Suggested Stop Loss | Key Note |
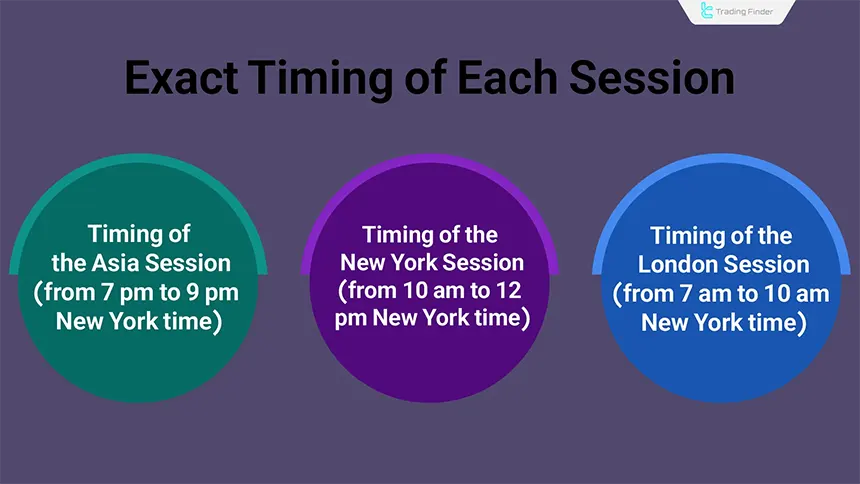
London | 2 to 8:20 a.m. New York | Bearish Judas Swing in the discount zone | 30 to 50 pips | 10 pips below the low | The daily low is usually formed in this session |
New York | 8:20 to 10 a.m. New York | Reversal Judas Swing from FVG | 20 to 40 pips | 10 pips below the London low | Continuation of the bullish move with daily bias confirmation |
Asia | 7 p.m. to 2 a.m. New York | Entry near 0 GMT | 15 to 20 pips | 8 to 10 pips | Narrow range but suitable for short-term scalping |
Entry Signals in the ICT Bread and Butter Buy-Setup
This Bullish Bread and Butter Trading Setup issues signals during the London, Asia, and New York sessions.
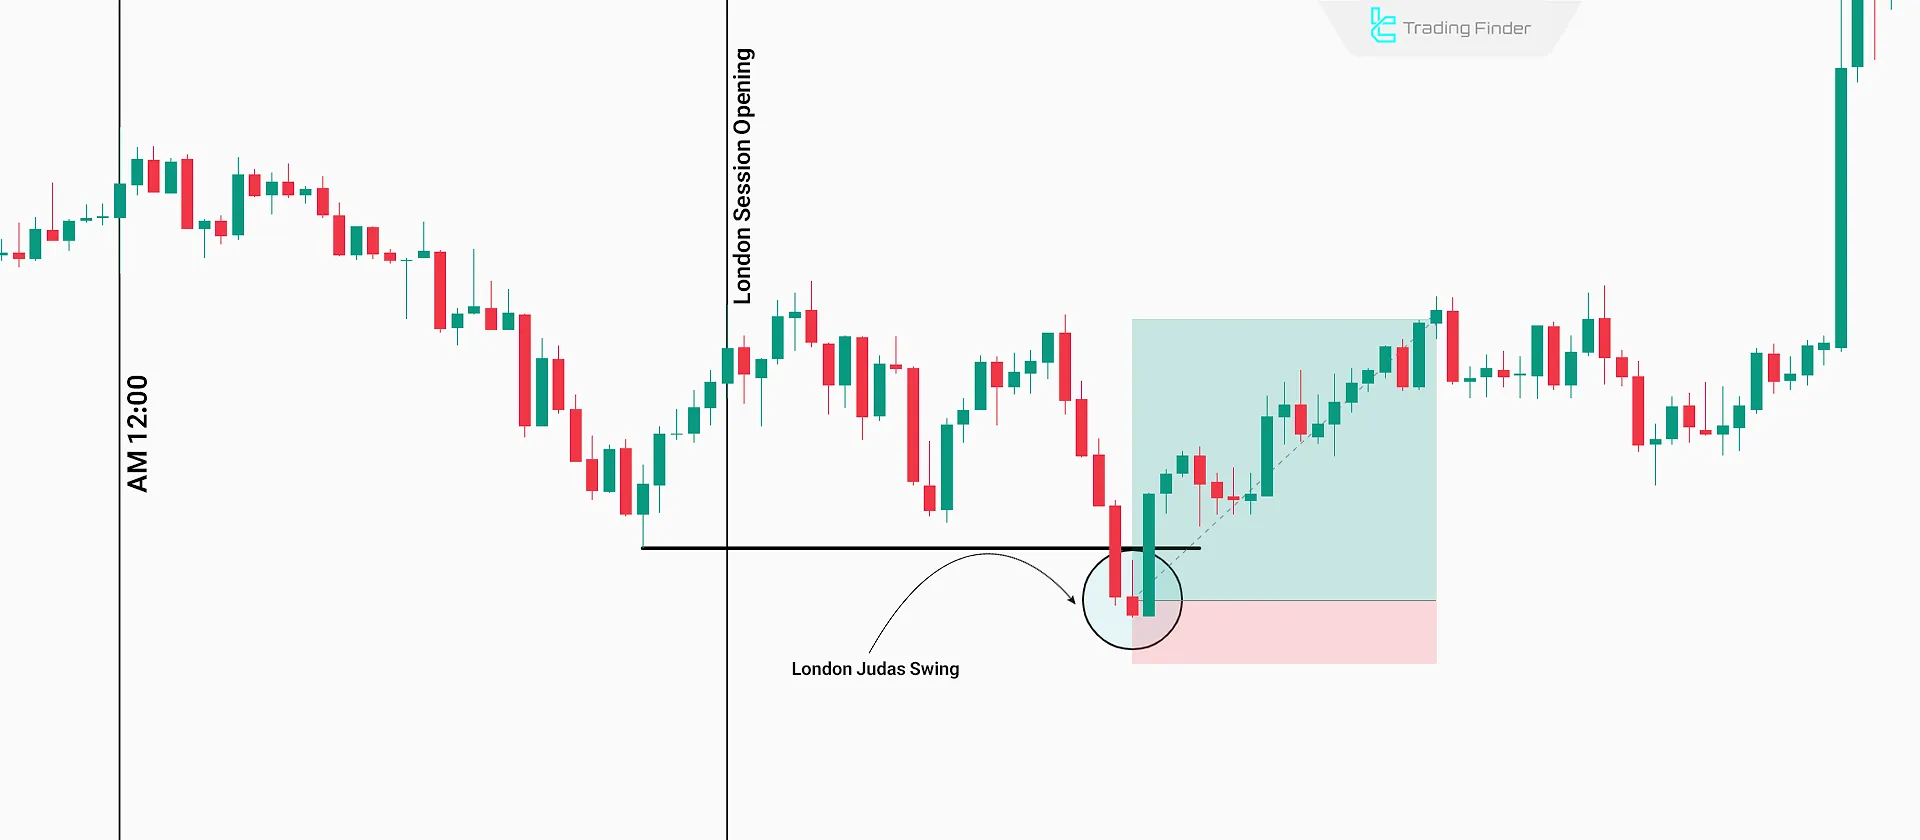
London Session Entry
When the HTF trend is bullish, the Low of the Day (LOD) often forms during the London session. A short-term bearish move may also appear around 0:00 GMT (New York midnight).
Following this retracement, a LondonJudas Swing is expected below the previous low. Once formed, entering a buy trade targeting the next Premium Array is logical.
New York Session Entry
After confirming the LOD in London, American traders typically extend the bullish trend.
Note: If the price reaches a higher-timeframe premium zone, further upside during the New York session is less likely to occur.
To enter during this session, discount zones must be identified. As New York opens, the NY Judas Swing can be detected.
Once the price reaches one of the discount zones and forms a Judas Swing, a buy signal is generated targeting the premium zone.
Example of the Bullish Bread and Butter Setup in the New York Session
In this example, after the New York session opens, the market enters a short-term corrective phase by creating a Fair Value Gap (FVG).
The bearish move into the discount zone absorbs sell-side liquidity, and immediately after tapping the FVG area, price returns toward the next premium zone as smart money enters the market.
Entry confirmation on the five-minute timeframe occurs after the formation of a reversal candle and a minor market structure break (CHOCH).
This example demonstrates the classic behavior of the bullish Bread and Butter setup during the overlap of the New York open and the activation of volume at 8:20 a.m. CME.
In many cases, this pattern is used as a Buy setup trading model within the ICT methodology.
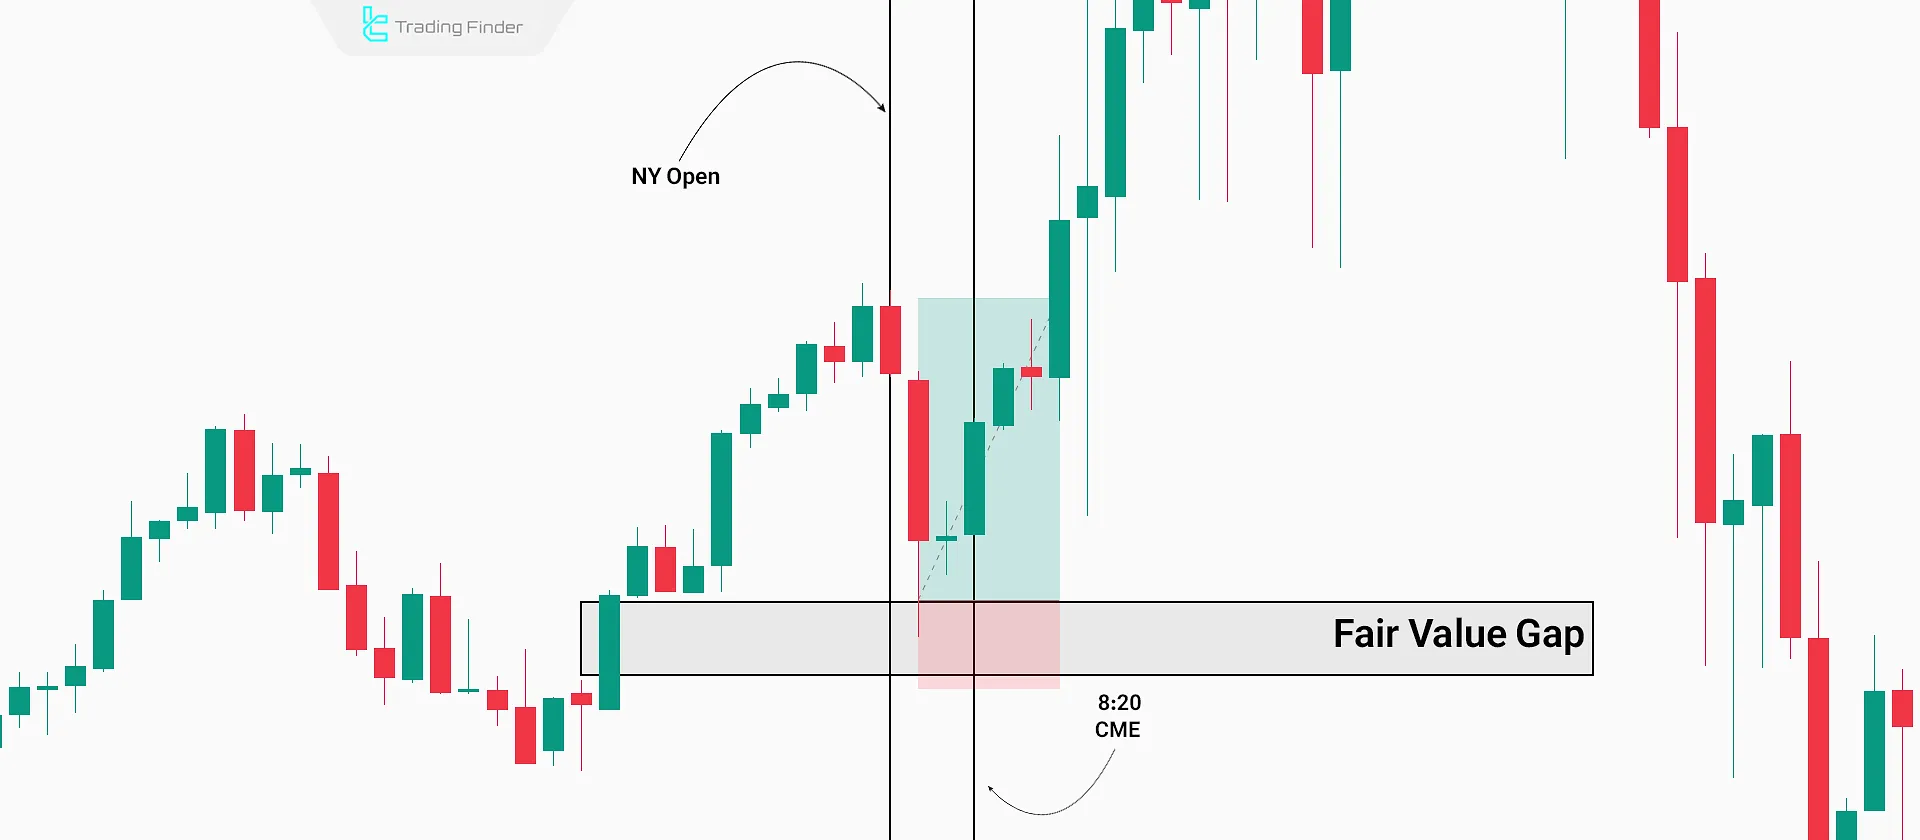
Note: With the CME Commodity Market opening at 8:20 AM, volume and volatility increase.
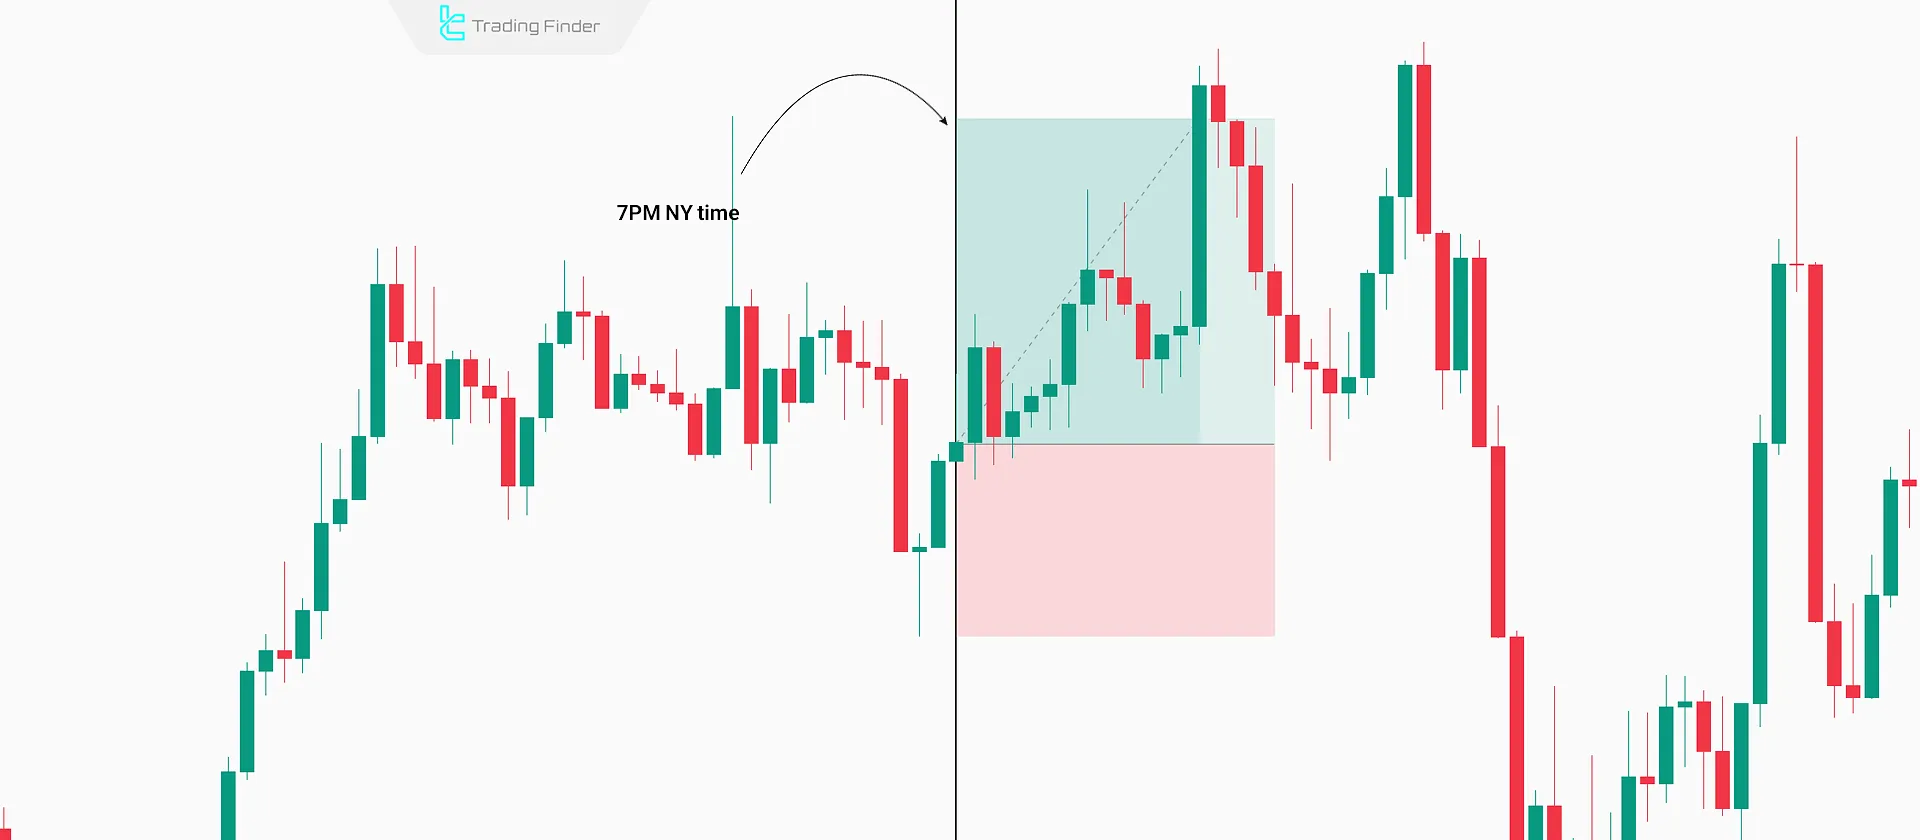
Asia Session Entry
If the bullish trend is confirmed during the New York and London sessions, entering a buy trade just before the Asia session opens (7:00 PM New York time) is reasonable.
Due to low volume at this hour, the take profit should be limited to 15–20 pips, as the session typically ranges.
M5 Execution Model
In the five-minute timeframe (M5), trade entry is based on a minor market structure break (CHOCH) and confirmation of the discount zone.
After price returns from the Judas Swing and forms a bullish order block, entry is placed above the confirming candle, and the stop loss is set behind the order block.
The trade target is reaching the next premium zone, which is usually 30 to 50 pips away. This entry method, with a small stop loss and precise capital management, creates an optimized risk-to-reward ratio.
Precise Timing in Each Trading Session
For each trading session, timing plays a crucial role; following these time windows increases the
likelihood of accurate entries in discount zones and timely exits in premium zones:
- In the London session, the Judas Swing usually forms between 5 and 7 a.m. New York time;
- In the New York session, the bullish move typically continues until around 10 a.m., and the daily high often forms between 10 a.m. and noon;
- In the Asia session, the ideal entry time is between 7 and 9 p.m. New York time, when the market is positioned within the discount area.
Key Characteristics of the ICT Bread and Butter Buy-Setup
The ICT Bread and Butter Buy-Setup is tailored for day trading. It utilizes ICT principles to identify short-term buy entries in the New York, London, and Asia sessions.
Key Characteristics:
- Trade duration: 1 to 2 hours
- Target per trade: 30 to 50 pips
- Analysis timeframe: 5-minute (M5)
- Number of trades per day: 1 to 3 setups
- Risk-to-reward ratio: varies based on market structure
- Capital risk per trade: 0.5% to 1%
Introduction to the Session Box Indicator
The Session Box Indicator is one of the most widely used analytical tools for professional traders, designed to visualize the time structure and volatility of each trading session.
This indicator marks the time ranges of major markets such as Asia, London, and New York as colored boxes on the chart, allowing traders to examine price behavior within each time window with greater precision.
In financial markets, volatility and trading volume throughout the day are heavily dependent on the operating hours of central banks and global exchanges.
For this reason, knowing the start and end times of trading sessions is highly important for designing short-term or scalping strategies.
By plotting the high and low of each session, the Session Box Indicator provides a clear view of daily liquidity and shows traders which areas have a higher probability of trend shifts or price breaks.
In charts of currency pairs such as EUR/USD or GBP/JPY, the highest volatility often occurs during the overlap of the London and New York sessions. By accurately highlighting these areas, the indicator enables traders to compare price movement strength in each session and analyze liquidity behavior.
In addition, traders can combine the indicator’s information with concepts such as the Fair Value Gap, Order Block, and Judas Swing in the ICT methodology to align their entry and exit points with the market’s time structure.
Another feature of this tool is its session-status panel, which shows whether sessions are open or closed and displays the remaining time until each session ends. This function allows traders to instantly decide whether to enter a trade or wait for a session shift.
Ultimately, due to its high accuracy in displaying time zones and liquidity ranges, the Session Box Indicator is considered an essential tool for ICT-style analysts and scalpers seeking a precise understanding of price behavior within the market’s time cycles.
Conclusion
To use the ICT Bread and Butter Buy-Setup, the bullish market direction must first be confirmed in higher time frames (1-hour and 4-hour).
For this reason, the Bullish Bread and Butter Trading Setup in the ICT trading style is suitable for day trading. Each trade in this setup typically targets a 30 to 50 pips price movement.
Key ICT concepts such as the Interbank Price Delivery Algorithm (IPDA), Judas Swing, and Fair Value Gap (FVG) are applied in this setup.
Additionally, this bullish Bread and Butter in the ICT Trading Style provides buy signals across the London, New York, and Asia trading sessions.


