


To design an entry model using ICT concepts, the primary focus is on shorter timeframes and entry tools, including Fair Value Gap (FVG), Order Blocks, Balance Price Range (BPR), and Optimal Trade Entry (OTE).
This approach is formed with the objective of identifying precise entry points within the framework of active market liquidity and seeks to confine executions to zones where price reaction is more probable, which directly aligns with the fvg entry model methodology.
Within this structure, the ict entry model does not rely on prediction; instead, it is built upon the market’s response to imbalances and liquidity behavior, forming the core logic behind modern ict entry models.
How to Build a Personal Entry Model Based on ICT
Building a personal entry model in the ICT style requires the precise definition of entry conditions, no-entry conditions, and scenario invalidation. This framework forms the foundation of professional entry models and must be developed according to real market behavior and individual trading preferences, rather than relying solely on pre-built templates.
Recording observations on the chart, analyzing price reaction to liquidity, and evaluating performance under different market conditions are the main stages in forming a stable entry model ict, which ultimately refines how traders understand all ict entry models in practical execution.
The process of building an ICT entry model is explained in video format on the TTrades YouTube channel:
Selecting the Entry Timeframe
The first step in constructing an ICT-based entry model is defining the timeframe, which varies according to each trader’s style. Some traders opt for higher timeframes, such as 15 minutes, while others prefer lower timeframes, including 1 minute or even 15 seconds.
Note: The following explanations will use 5-minute and 1-minute timeframes, as they provide more flexibility for short-term trades.
Choosing the Right Kill Zone
Forex kill zones are specific times of the day with high market liquidity. For example, the New York Open is a prime time for searching for trade entry opportunities due to its high volatility and liquidity. During this period, price behavior relative to IRL and ERL levels becomes more transparent, and reactions become structurally easier to evaluate.
In addition, the overlap of this session with the release of a significant portion of US economic data creates conditions in which the market’s daily directional bias is established within the early hours, forming a core foundation for entry model in forex execution.
The Role of the Kill Zone in the Time Filter of Entry Models
In the ICT framework, Kill Zones are not merely high-volatility time windows; they function as a time filter for ict all entry models. Many entry models are only considered valid when they form within specific windows such as the New York Open, including setups such as the ote model.
During these times, sufficient liquidity exists to generate Displacement and complete the liquidity absorption cycle. Applying an entry model outside the Kill Zone increases the probability of an incomplete scenario.
Key Concepts for an ICT-Based Entry Model
The following concepts are essential for constructing an entry model:
- Displacement: Strong directional price movements consisting of multiple large-bodied candles
- Fair Value Gap (FVG): Price imbalance indicating areas of inefficiency
- Order Block: Institutions and large investors buy or sell orders
- Balance Price Range (BPR): Overlapping areas of two Fair Value Gaps (FVGs)
- Optimal Trade Entry (OTE): Fibonacci-based setup to identify key price reversal levels
- Internal Range Liquidity (IRL): Liquidity pools within a price range (formed by FVGs)
These concepts form the foundation for developing an ICT entry model.
The Role of the Entry Model in the Overall ICT Trading Framework
In the ICT style, the trade entry model is not merely a single entry point, but rather part of a larger analytical structure that integrates concepts such as bpr in trading within a complete market framework.
This model is formed in alignment with higher-timeframe bias, the daily trading range, and the market’s price narrative, which collectively define professional entry models trading.
When an entry model is used without regard to this overall structure, even the most reliable concepts such as FVG or Order Block lose their effectiveness.
For this reason, the Entry Model in ICT is defined as the final stage of decision-making, not the starting point of analysis, especially when applied to ict fvg entry execution.
The Importance of Market Structure in Validating the ICT Entry Model
Market structure plays a decisive role in the validity of any trade entry model. In the ICT methodology, entries that occur without a change or break in market structure are usually exposed to failure.
Price displacement becomes meaningful only when it leads to a change in market behavior, and this change can be observed in the form of a Break of Structure or a Shift in Market Structure.
An entry model is considered valid when it operates in the direction of the new market structure, not in opposition to it.
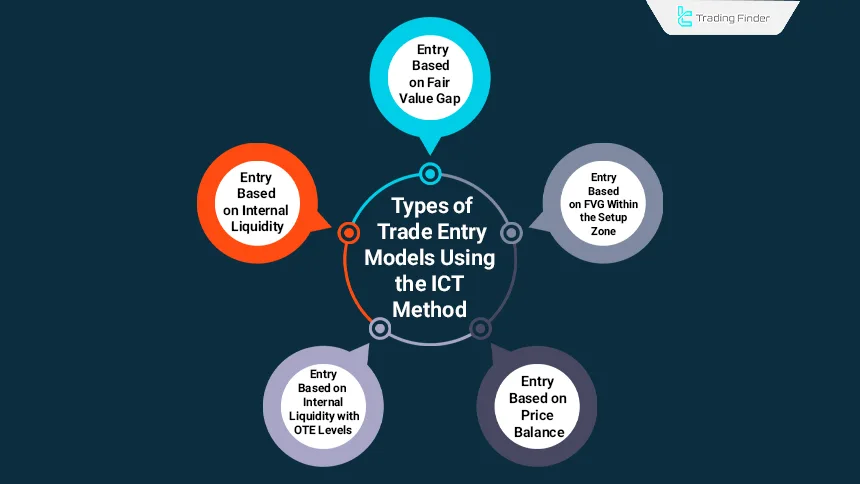
Types of ICT Entry Models
ICT-based entry models are typically constructed by combining multiple concepts. The following sections discuss different ICT entry models.
Each of these models is defined based on price behavior around liquidity, market structure, and order distribution, and only gains practical validity when it aligns with the relevant timeframe conditions and the state of daily liquidity, forming the core logic behind modern trading entry models.
Ignoring this analytical context can lead to improper application of patterns and a decline in execution accuracy, which is why concepts such as optimal trade entry ict and a structured entry setup guide play a critical role in professional execution.
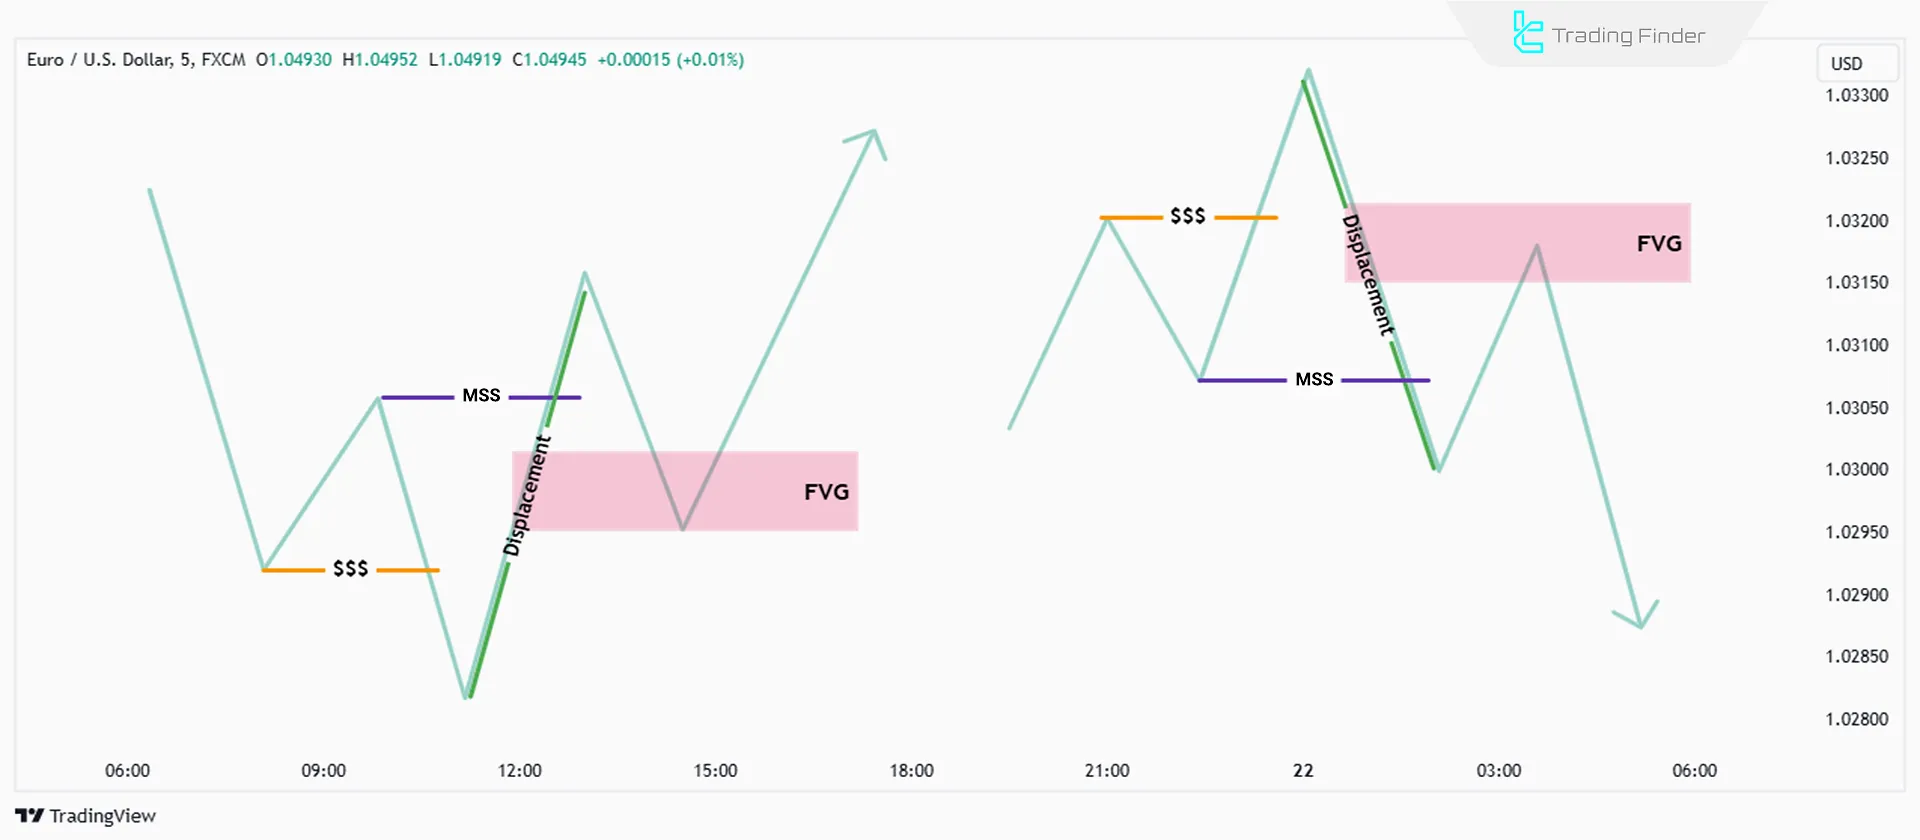
Entry Based on Fair Value Gap (FVG)
The FVG-based entry model consists of three steps:
- Liquidity Grab: Liquidity is collected from a key range, leading to a price reversal;
- Displacement: After liquidity grab, the price makes an Displacement move in the opposite direction, resulting in a Break of Structure (BOS);
- Return to Fair Value Gap: Following BOS, price retraces to the Fair Value Gap, creating an entry opportunity.
Example of a Trade Entry Model Based on FVG After a Break of Structure
In this example, after buy-side liquidity is collected, price generates a strong displacement to the downside and results in a Break of Structure (BOS), which reflects the behavior observed across many ict models. This displacement leads to the formation of a Fair Value Gap (FVG) along the price path.
When price returns to the FVG zone, often aligning with ote zone trading conditions and respecting the ote level in trading, the required conditions for trade entry in the direction of the new market structure are established. This type of entry is considered valid only when the FVG is formed during the aggressive continuation of price movement and after the BOS.
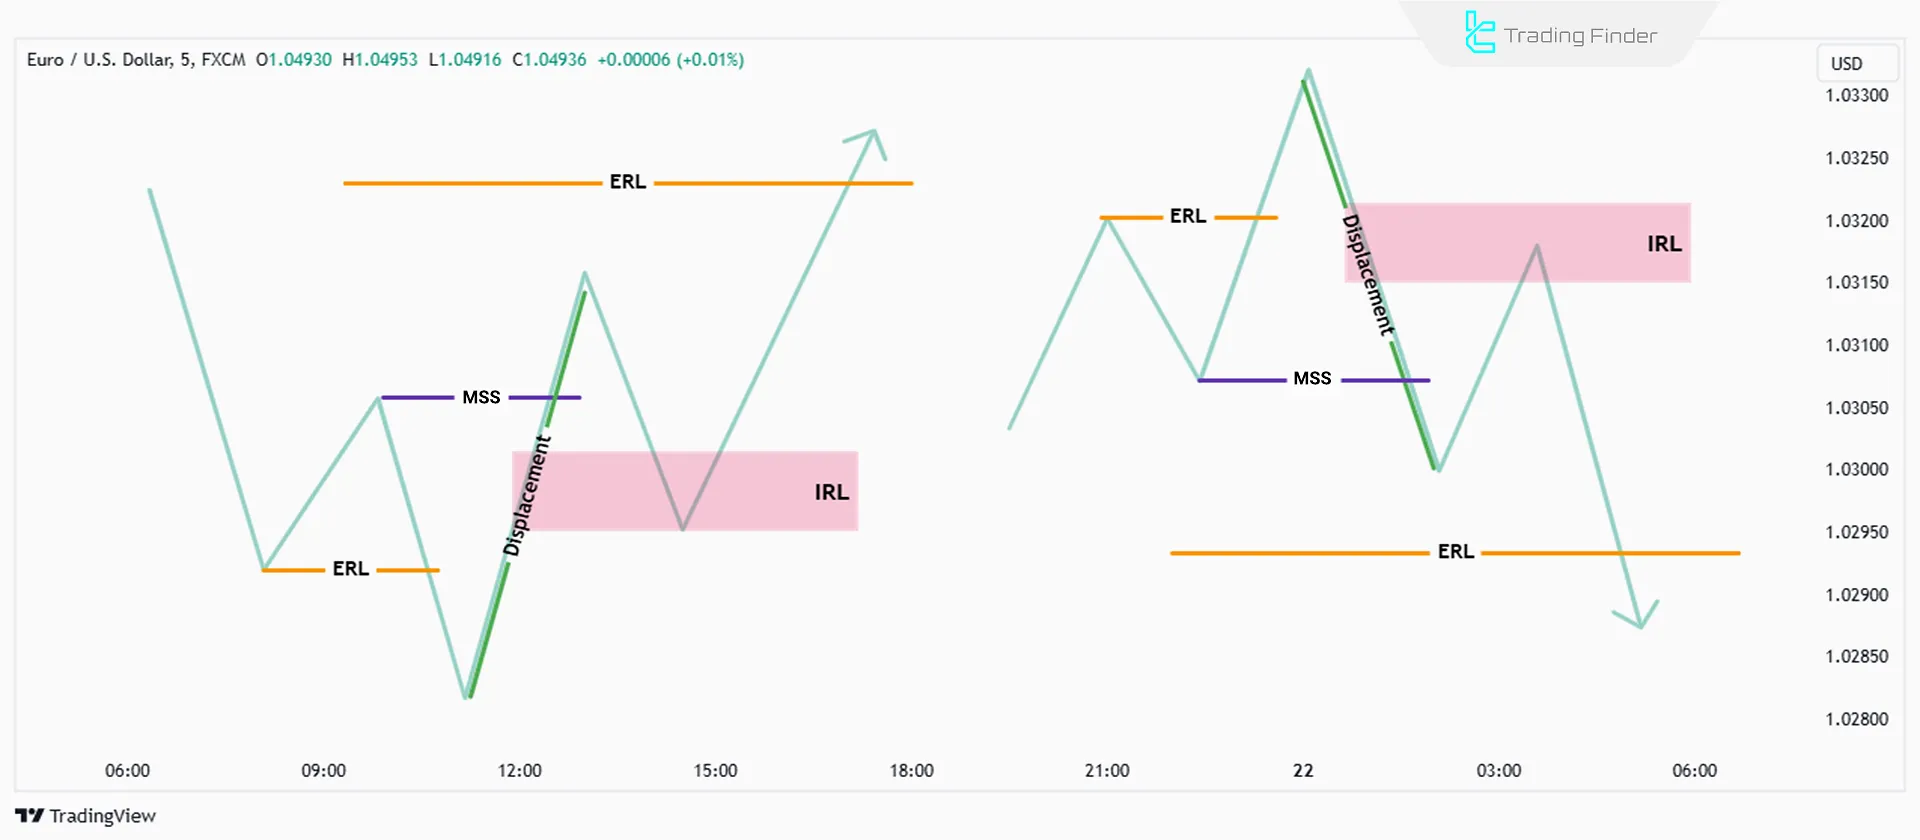
Entry Based on Internal Range Liquidity (IRL)
The IRL-based entry model is summarized in three steps:
- Internal Liquidity Grab: Price moves towards Internal Range Liquidity (IRL), often with a brief counter-trend move;
- Displacement: After collecting internal liquidity, the price makes an aggressive move in the main trend direction, causing a Break of Structure (BOS);
- Next Target: Price moves towards External Range Liquidity (ERL) after absorbing internal liquidity.
Example of a Trade Entry Model Based on Internal Range Liquidity (IRL) After a Break of Structure
In this example, after a short corrective move, price enters the Internal Range Liquidity (IRL) zone. This move is typically executed with the objective of collecting resting orders within the price range. After the internal liquidity absorption is completed, a strong displacement occurs in the direction of the primary trend and a Break of Structure (BOS) is registered.
This sequence of price action demonstrates that IRL serves as a preparatory phase for the continuation of the price movement.
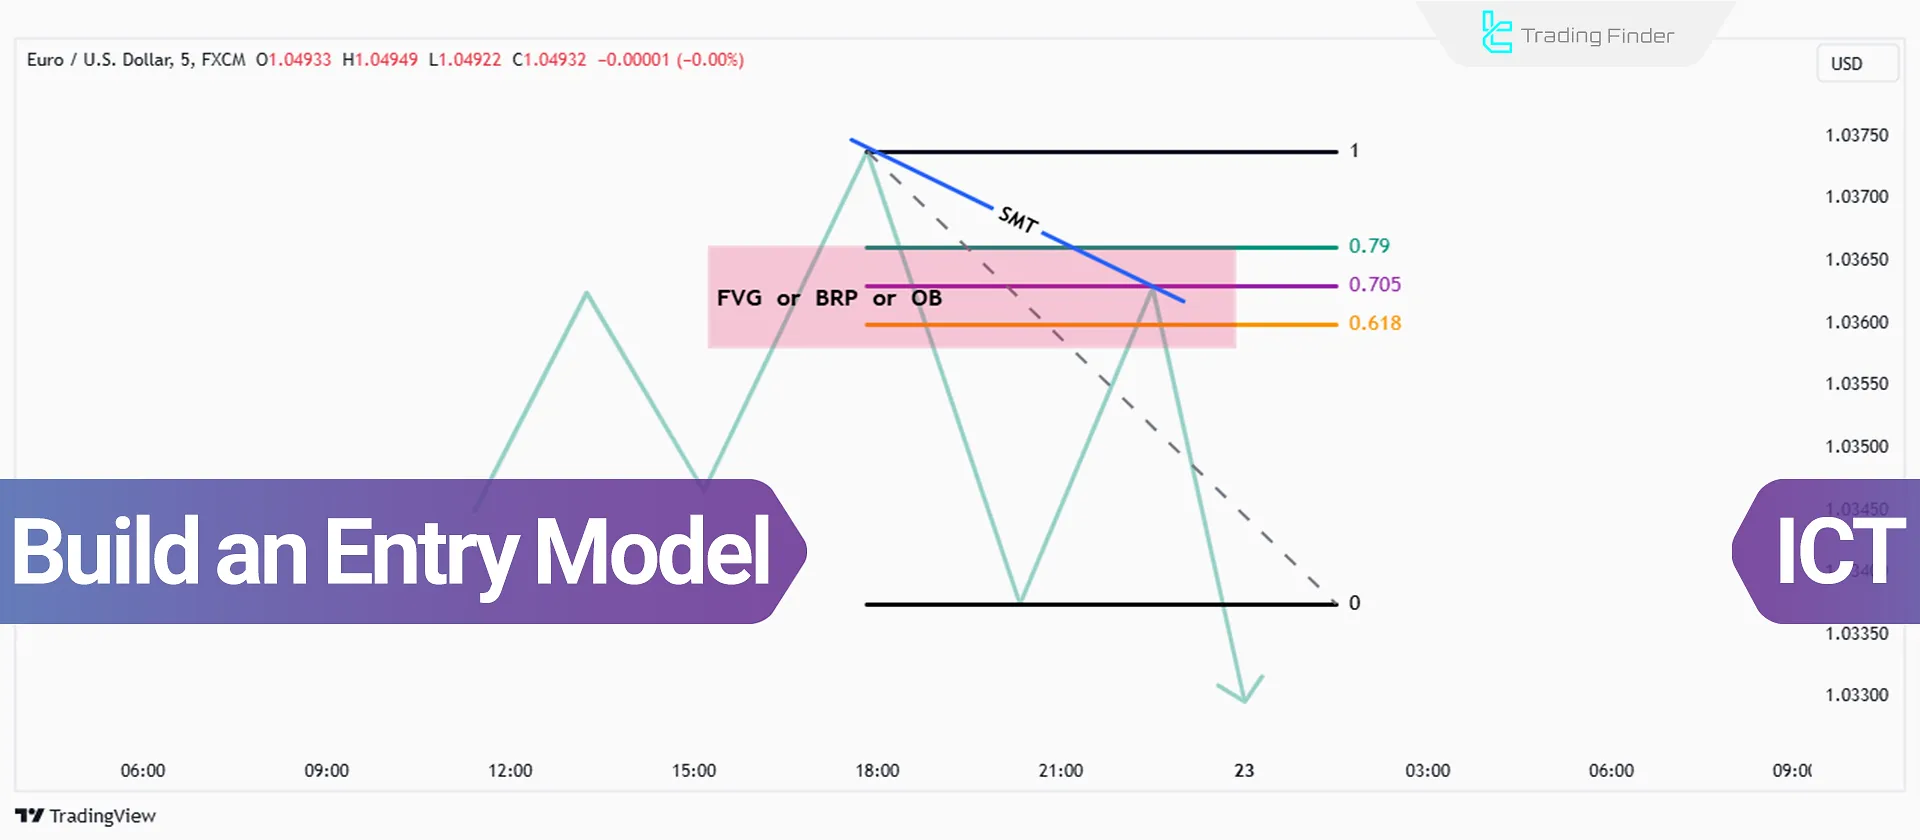
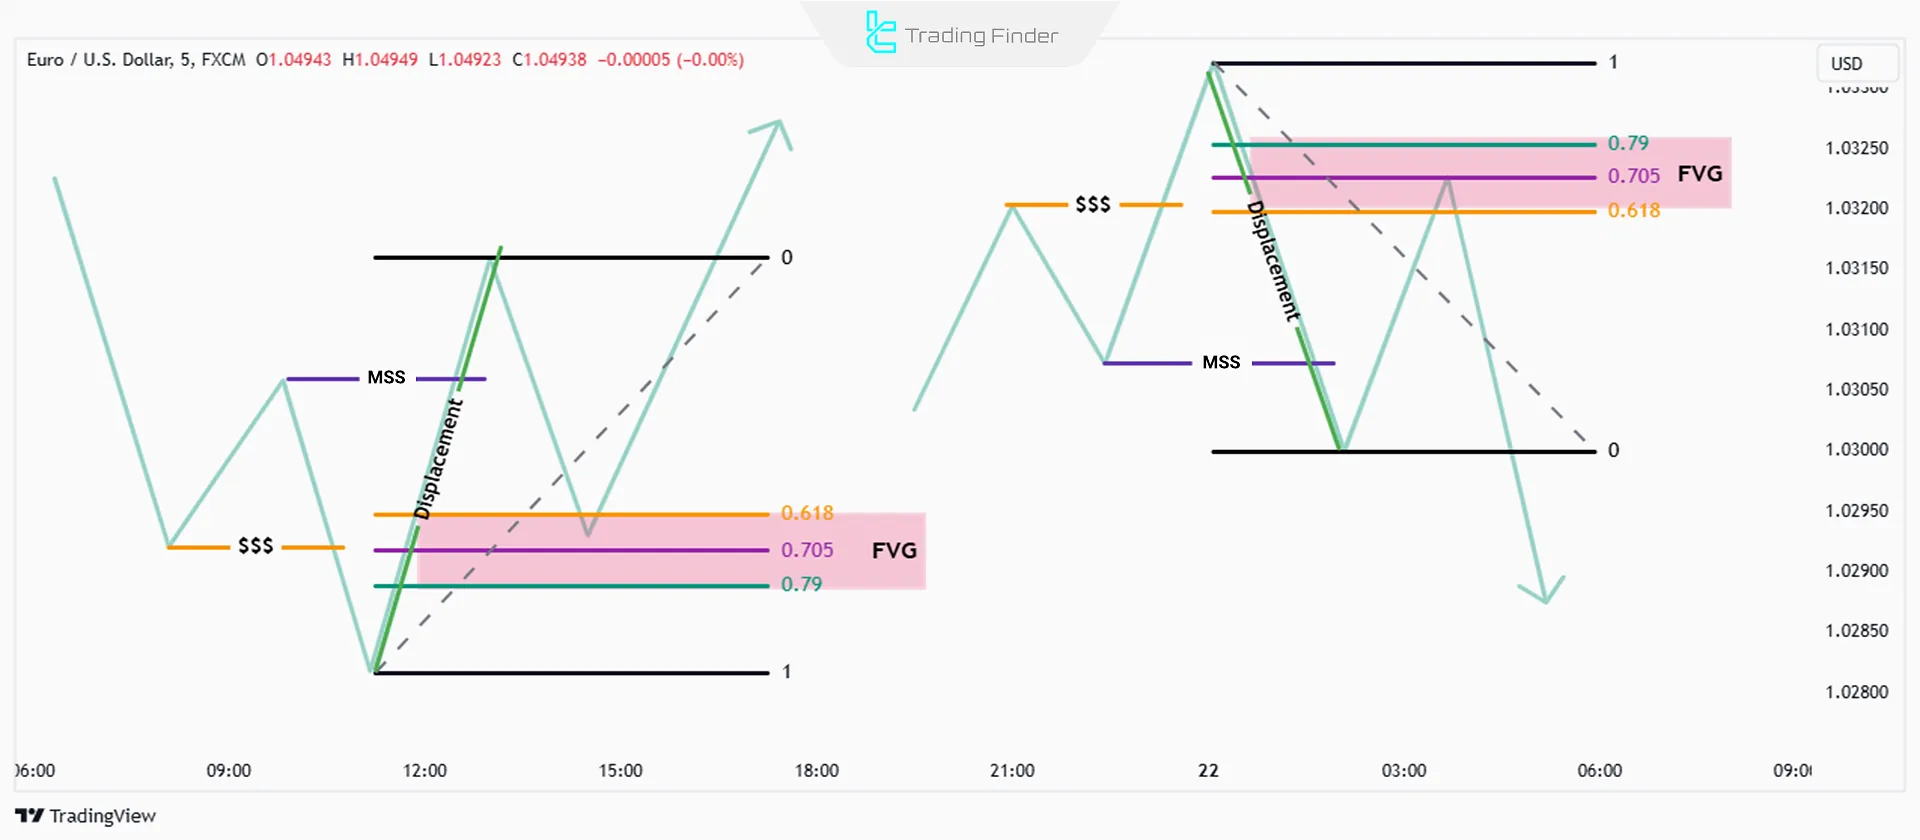
Entry Based on FVG Within OTE Setup
The model is a variation of the first one, but the Fair Value Gap occurs within OTE levels. The steps are:
- Liquidity Grab: Liquidity is absorbed from a key area, followed by a rapid price reversal;
- Displacement: A strong move against the prior trend leads to a Break of Structure (BOS);
- Return to FVG: Price retraces to the Fair Value Gap after BOS;
- Additional Condition: The Fair Value Gap must lie within OTE retracement levels (0.62 to 0.79) to improve the risk-to-reward ratio.
Example of a Trade Entry Model Based on FVG within the OTE Setup Zone
In this example, after sell-side liquidity is collected, price generates a strong upward displacement and a Break of Structure (BOS) is registered.
Following this movement, a Fair Value Gap (FVG) is formed along the bullish price path. The range of this FVG simultaneously overlaps with the retracement levels of the OTE setup, such that the 0.62 to 0.79 Fibonacci zone is considered the optimal area for entry.
Internal Liquidity with OTE Levels
The Internal Liquidity with OTE model is a combination of the second and third models, where internal liquidity is collected, and the Fair Value Gap lies within OTE levels.
- Internal Liquidity Grab: Price first moves to collectinternal liquidity;
- Displacement: A strong price move creates a Break of Structure (BOS);
- Return to FVG in OTE Zone: Entry occurs when the price retraces to an FVG within OTE levels (0.62-0.79) after BOS.
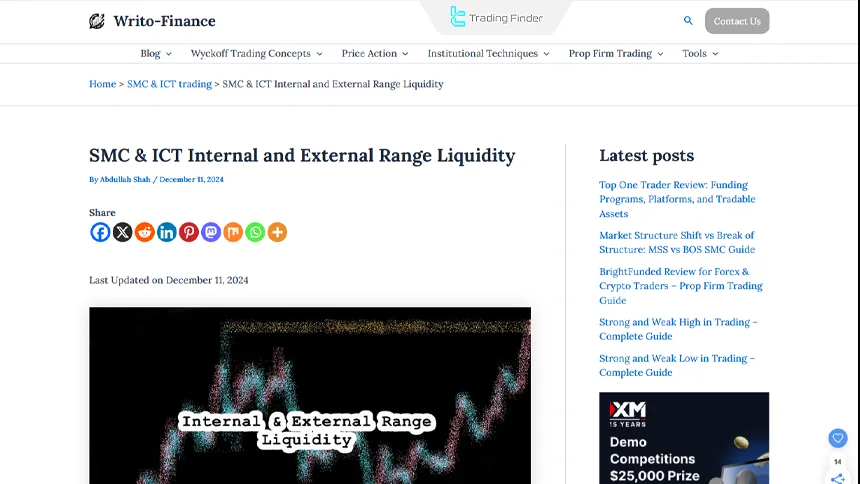
In the educational article on learning internal and external liquidity on the Writo-Finance website, these two concepts are explained in full detail.
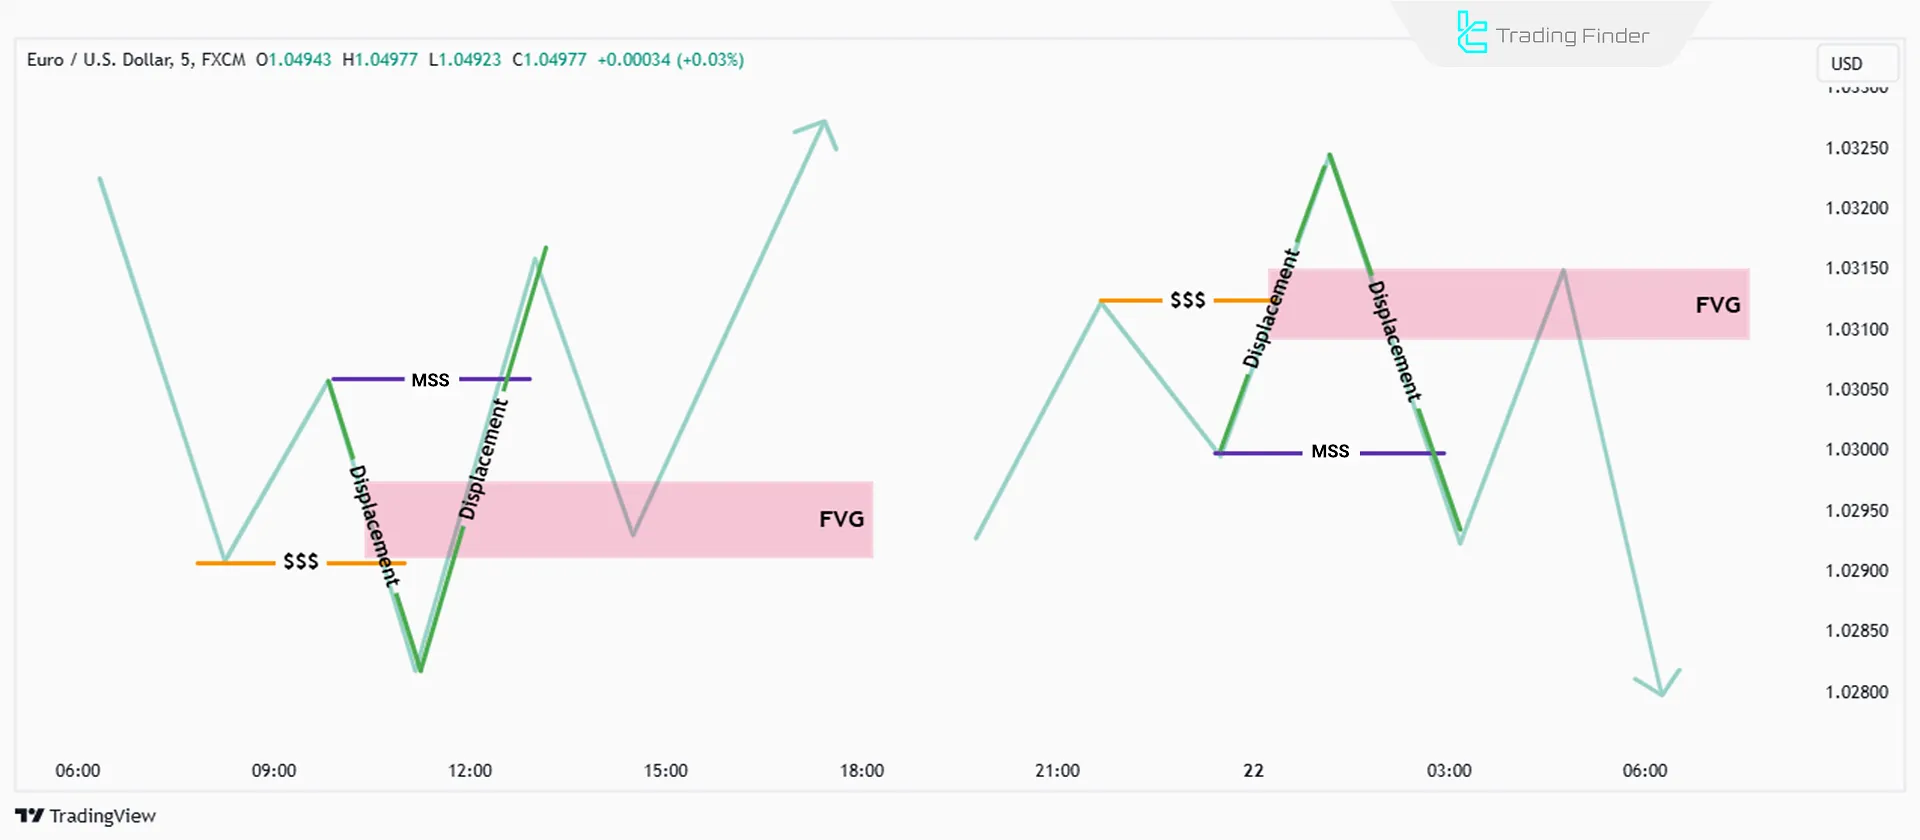
Entry Based on Balance Price Range (BPR)
The Balance Price Range (BPR) model is designed based on the overlap of aggressive moves and Fair Value Gaps in both directions (like a rapid up-and-down move). The steps are:
- Aggressive Buy & Sell Moves: A sharp two-sided move creates overlapping Fair Value Gaps;
- Identifying the Balance Zone: The overlapping FVGs define an entry point;
- Entry & Risk Management: Entry occurs at the balance zone, with stop-loss and Take Profit abovethe highs or below the lows of the aggressive moves;
- Combining with Other Concepts: This model can be combined with OTE levels, discount zones, or premium zones for better risk-to-reward ratios.
Example of a Trade Entry Model Based on BPR After Opposing Aggressive Movements
In this example, price initially generates a strong aggressive move in one direction and is then followed by a rapid Displacement in the opposite direction.
These two back-and-forth movements result in the formation of two Fair Value Gaps that overlap within the same zone. This overlapping area forms the Balanced Price Range, or BPR, and is considered a structural point for trade entry.
Price Displacement as the Activation Condition for the Entry Model
Price displacement, in the ICT methodology is not merely a fast movement, but rather a signal of major institutional participation entering the market. This move is typically accompanied by large-bodied candles with decisive closes and creates price imbalance.
Without displacement, many zones such as FVG or IRL are not yet activated, and entering a trade under these conditions would be premature. For this reason, Displacement is considered the activation condition for the entry model.
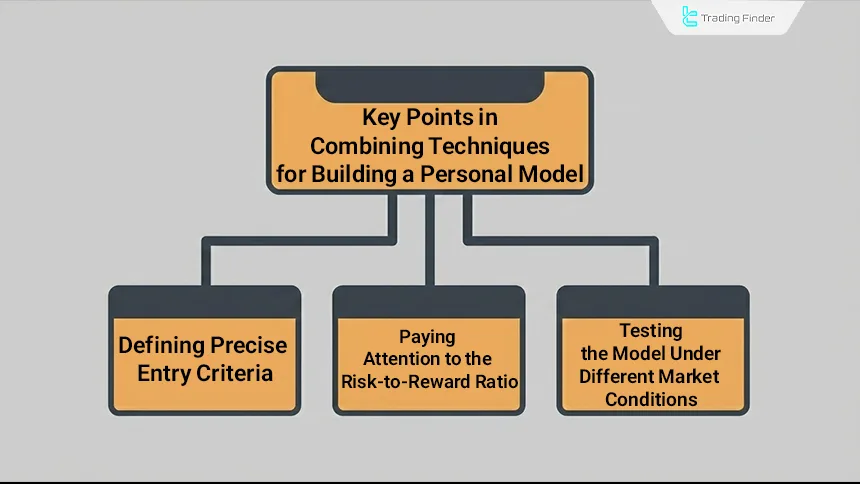
Key Considerations in Combining Techniques for a Custom Model
One advantage of ICT trading is its flexibility in combining different concepts. Traders can integrate elements such as Fair Value Gaps, Order Blocks, Balance Price Range, and Internal Liquidity based on their preferences. Key points include:
- Defining Precise Entry Criteria: Each model should have specific conditions for identifying entry points;
- Considering Risk-to-Reward Ratio: Using concepts likeOTE levels can optimize this ratio;
- Testing Models in Various Market Conditions: Each model should be tested in different market conditions (bullish, bearish, and ranging) to ensure effectiveness.
Difference Between a Trade Entry Model and a Trade Setup
A trade entry model in the ICT style has a fundamental difference from a simple trade setup. A setup usually refers to a specific pattern on the chart, whereas an entry model is a decision-making framework that defines entry conditions, no-entry conditions, and scenario invalidation.
Comparison table of trade entry model and trade setup:
Comparison Criteria | Trade Entry Model (Entry Model) | Trade Setup (Trade Setup) |
Nature | A structured decision-making framework for trade execution | A specific pattern or observable signal on the chart |
Level of Analysis | Based on market structure, liquidity, and price behavior | Based on a particular price condition or formation |
Dependency on Market Context | Fully dependent on bias, Dealing Range, and higher timeframe | Often independent of or less attentive to overall market context |
Core Components | A combination of FVG, IRL, Displacement, OTE, BPR, and structure | Usually one or two specific concepts such as FVG or Order Block |
Number of Entry Conditions | Can include multiple different setups | Usually contains one defined entry condition |
No-Entry Definition | Defines no-entry conditions and scenario invalidation | Often focuses only on the entry point |
Primary Objective | Standardizing decision-making and reducing emotional trading | Identifying short-term opportunities on the chart |
Application in ICT Style | Core of structured trade execution | Execution tool within the entry model |
Combining Multiple ICT Concepts into a Coherent Entry Model
One of the main characteristics of the ICT style is the ability to combine multiple concepts into a single coherent entry model. The simultaneous use of FVG, IRL, OTE, and BPR becomes effective only when the time sequence and functional role of each concept are clearly defined.
A successful entry model applies concepts in a chained sequence rather than simultaneously and without priority. This approach increases entry precision and reduces false signals.
Market Structure Indicator
The Market Structure Indicator (BOS-CHOCH) is a specialized analytical tool in the ICT and Smart Money methodology that focuses on price movement logic to identify structural changes in the market.
This indicator is built upon two key concepts, Change of Character (CHOCH) and Break of Structure (BOS), to clearly mark trend shifts, continuation, and structural breaks on the chart. By analyzing market structure across multiple timeframes, this tool provides deeper insight into price behavior.
Identifying major and minor changes in market character, along with visual separation of BOS and CHOCH, allows traders to recognize the dominant trend, corrective phases, and critical decision zones with higher accuracy.
For this reason, the BOS-CHOCH indicator is particularly favored by professional traders, scalpers, and day traders.
In practical application, after identifying a CHOCH, the analyst’s attention is drawn to the zone that caused the structural change, which often overlaps with Order Blocks or liquidity levels. Subsequently, observing a BOS can confirm the continuation of price movement and provide a logical framework for executing the trading scenario. This logic is applicable in both bullish and bearish market conditions.
Overall, the BOS-CHOCH indicator simplifies the visualization of market structure and makes the analysis process more systematic for ICT and Smart Money traders. Identifying primary and secondary structural changes, together with precise display of structural breaks, enables a clearer understanding of order flow, liquidity zones, and potential reversal or continuation points.
Moreover, using the BOS-CHOCH indicator transforms market structure analysis from a subjective and discretionary process into a repeatable framework. When changes in market character and structural breaks are clearly defined, traders can align their entry models with price reactions at these levels and avoid impulsive executions.
This is especially important in the ICT methodology, as the alignment of market structure with liquidity and price behavior plays a critical role in improving decision accuracy.
Common Mistakes in Designing an ICT Entry Model
One of the most common trader mistakes is the mechanical use of entry models without understanding the logic behind them. Incorrect timeframe selection, ignoring market structure, and using FVG without Displacement are among the frequent errors.
Common mistakes in designing an ICT entry model:
- Mechanical use of FVG, IRL, or OTE without understanding liquidity logic;
- Ignoring market structure and the absence of a valid BOS or Shift
- Incorrect identification of Displacement and confusing fast movement with true displacement;
- Selecting entry timeframe without alignment with the higher timeframe;
- Executing the entry model outside the Kill Zone and low-liquidity sessions;
- Combining ICT concepts simultaneously without defining their time sequence and functional roles;
- Focusing solely on the entry point while neglecting no-entry conditions and scenario invalidation.
Conclusion
When identifying an ICT-based entry model, combining concepts like FVG, OB, Balance Price Range, andOTE setups provides a structured approach to trade entries. Analyzing appropriate timeframes, recognizing high-liquidity kill zones, and focusing on key market levels are crucial steps.
The accuracy of these models increases when the sequence of price entry into liquidity zones and its reaction relative to the previous market structure are interpreted correctly.
At the same time, aligning entries with active liquidity phases significantly reduces the probability of price deviation and false signals. Ultimately, synchronizing the setup with the daily bias and the overall market condition defines the boundary between a controlled execution and a high-risk entry.


