


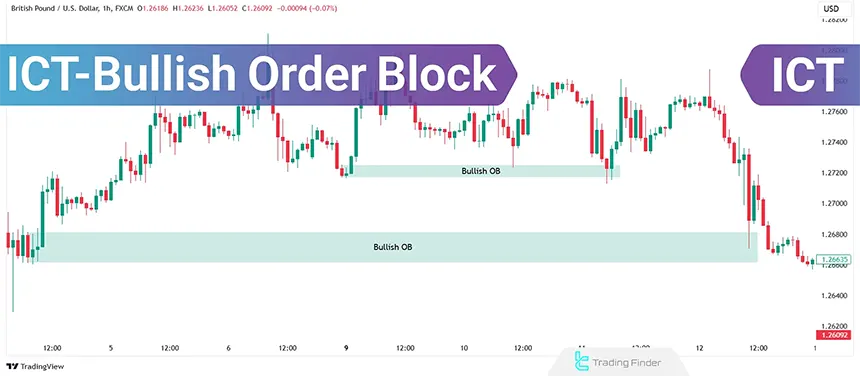
The ICT Bullish Order Block (OB) is one of the foundational concepts in ICT Style technical analysis. It highlights areas where buy orders concentrate, triggering strong upward price movements.
Traders can identify these zones and seize trading opportunities when the price revisits them.
These zones are usually the last bearish range before the start of an explosive bullish move (Impulse), and due to the accumulation of liquidity and resting orders, after creating the bullish wave the price returns to that range to process the remaining orders.
Correct identification of a valid bullish order block leads to low-risk entries in the price pullback zone and makes market structure analysis possible with higher precision.
What is an ICT Bullish Order Block?
ABullish Order Block is a zone on the chart with substantial buying pressure, usually marking the starting point of a strong bullish surge.
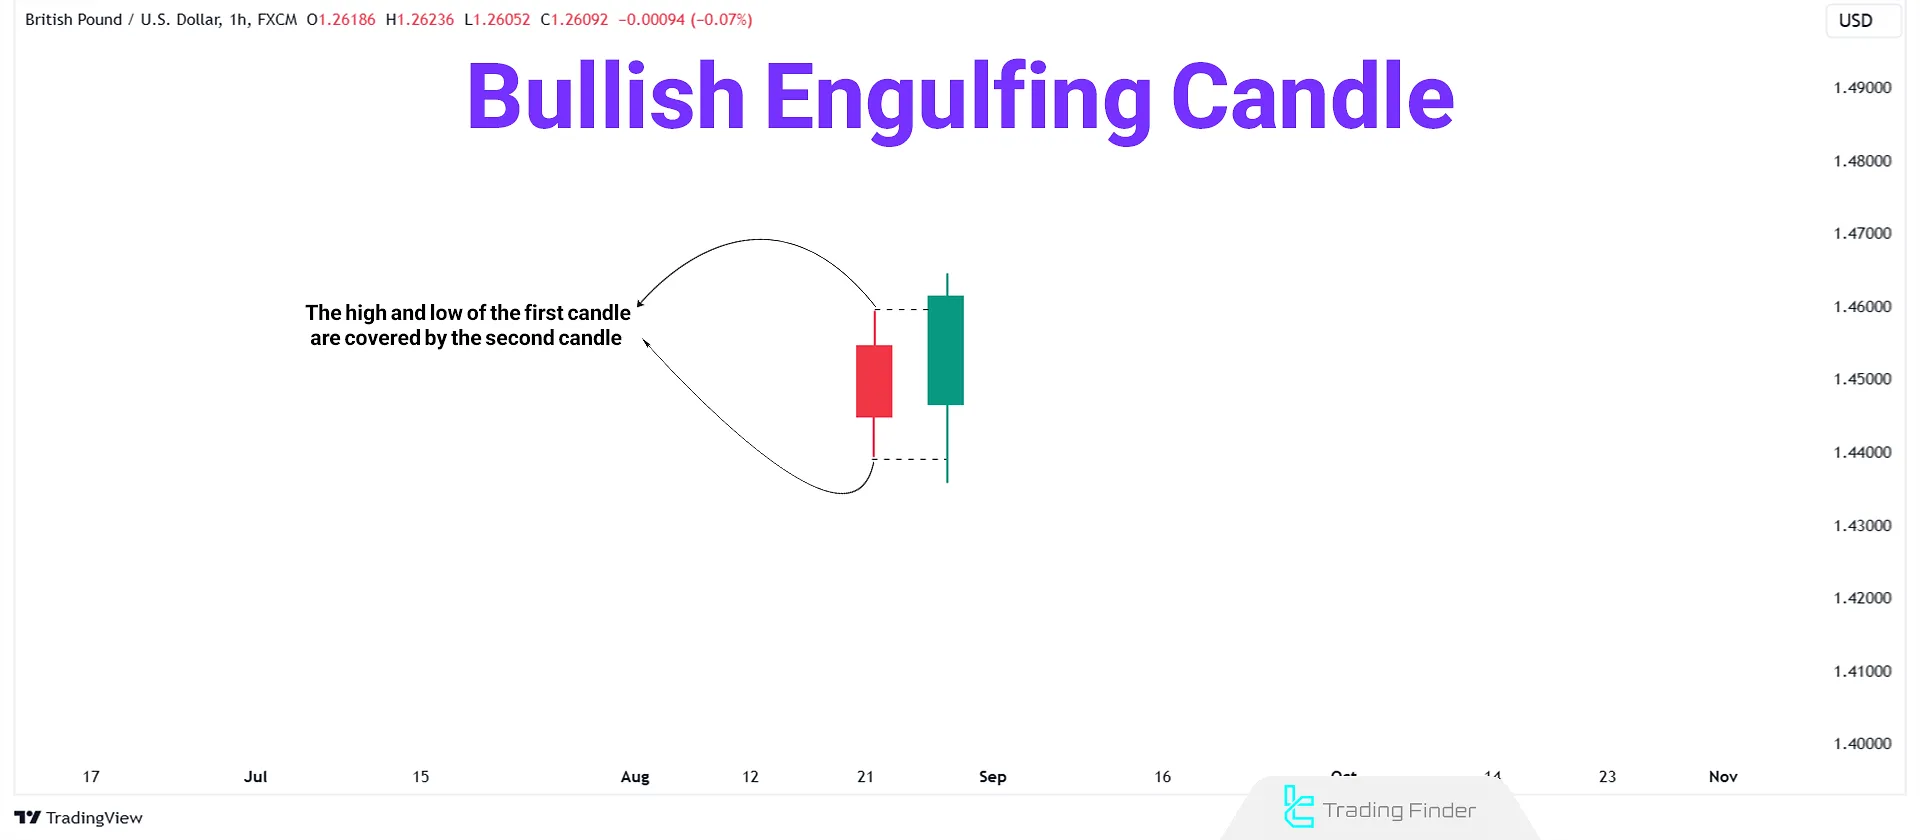
An ICT Bullish OB typically consists of a bearish candle followed by a strong bullish engulfing candlestick.
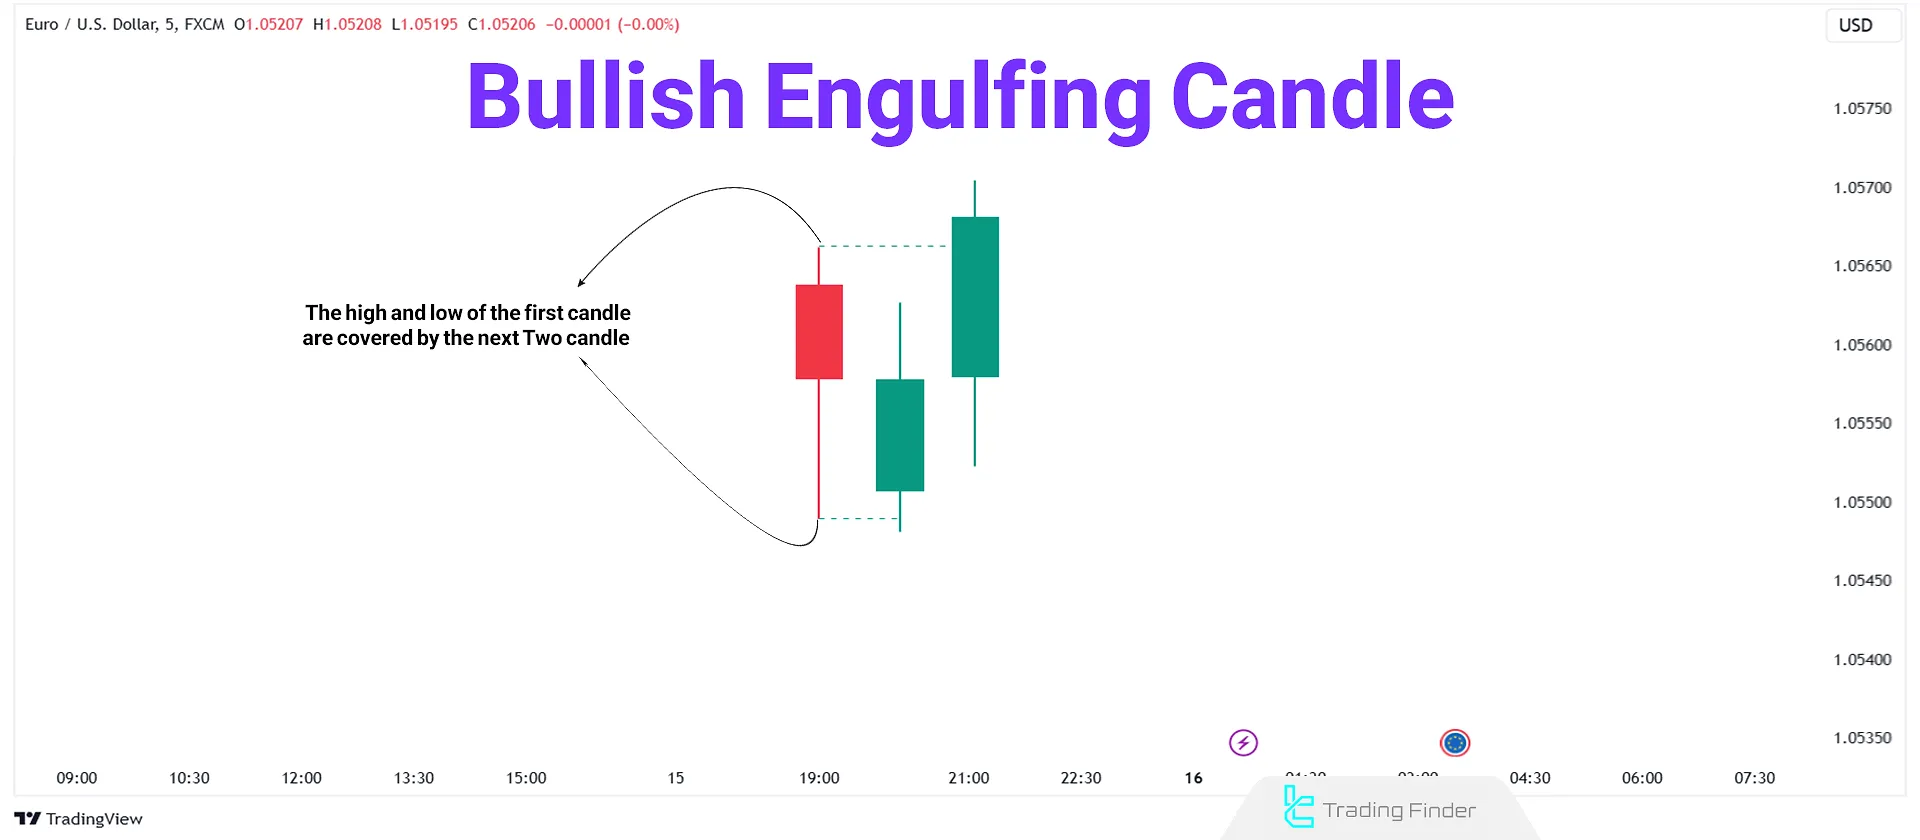
The engulfing pattern forms over two or more candles. The example below shows this pattern formed over three candles.
How to Identify a Bullish Order Block?
A Bullish Order Block (OB+) is the last bearish candle before a bullish move, usually consisting of two candles (first bearish, second bullish).
To identify valid Bullish OBs, consider the following:
- The bullish candle must Sweep the liquidity below the previous bearish candle;
- The bullish candle must close above the high of the bearish candle;
- Imbalances on lower timeframes validate the OB;
- Market Structure Shifts (MSS) on lower timeframes indicate OB’s strength.
In summary, the second candle must fully engulf the first candle (body and shadow).
The Best Timeframes for Identifying and Trading the Bullish Order Block
To identify valid order blocks within the price movement structure, the best approach is the simultaneous use of multiple complementary timeframes. This method allows you to both determine the overall market direction and gain more precise entry points.
Timeframes | Use and role in identifying the order block |
H4/H1 | Identifying major order blocks (Major OB) and determining trend zones and the overall direction of smart money |
M15/M5 | Finding MSS (micro structure shift), confirming the reversal, and specifying the entry point with medium accuracy |
M1 | Precise entry, scalping, and better adjustment of stop-loss if needed |
Note: It must be considered that order blocks in higher timeframes have greater strength and durability.
How to Trade a Bullish Order Block?
To trade based on this strategy and start trading with the bullish order block, follow these steps:
- Identify the market’s Order Flow or dominant trend;
- Confirm the validity of the Bullish OB;
- Wait for the price to revisit the OB;
- Use confirmation signals like Market Structure Shifts (MSS) on lower timeframes;
- Enter at around 50% of the OB zone for optimal risk-to-reward ratio.
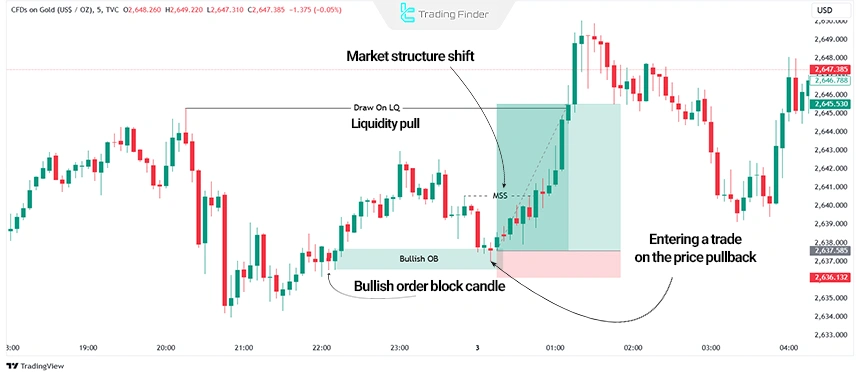
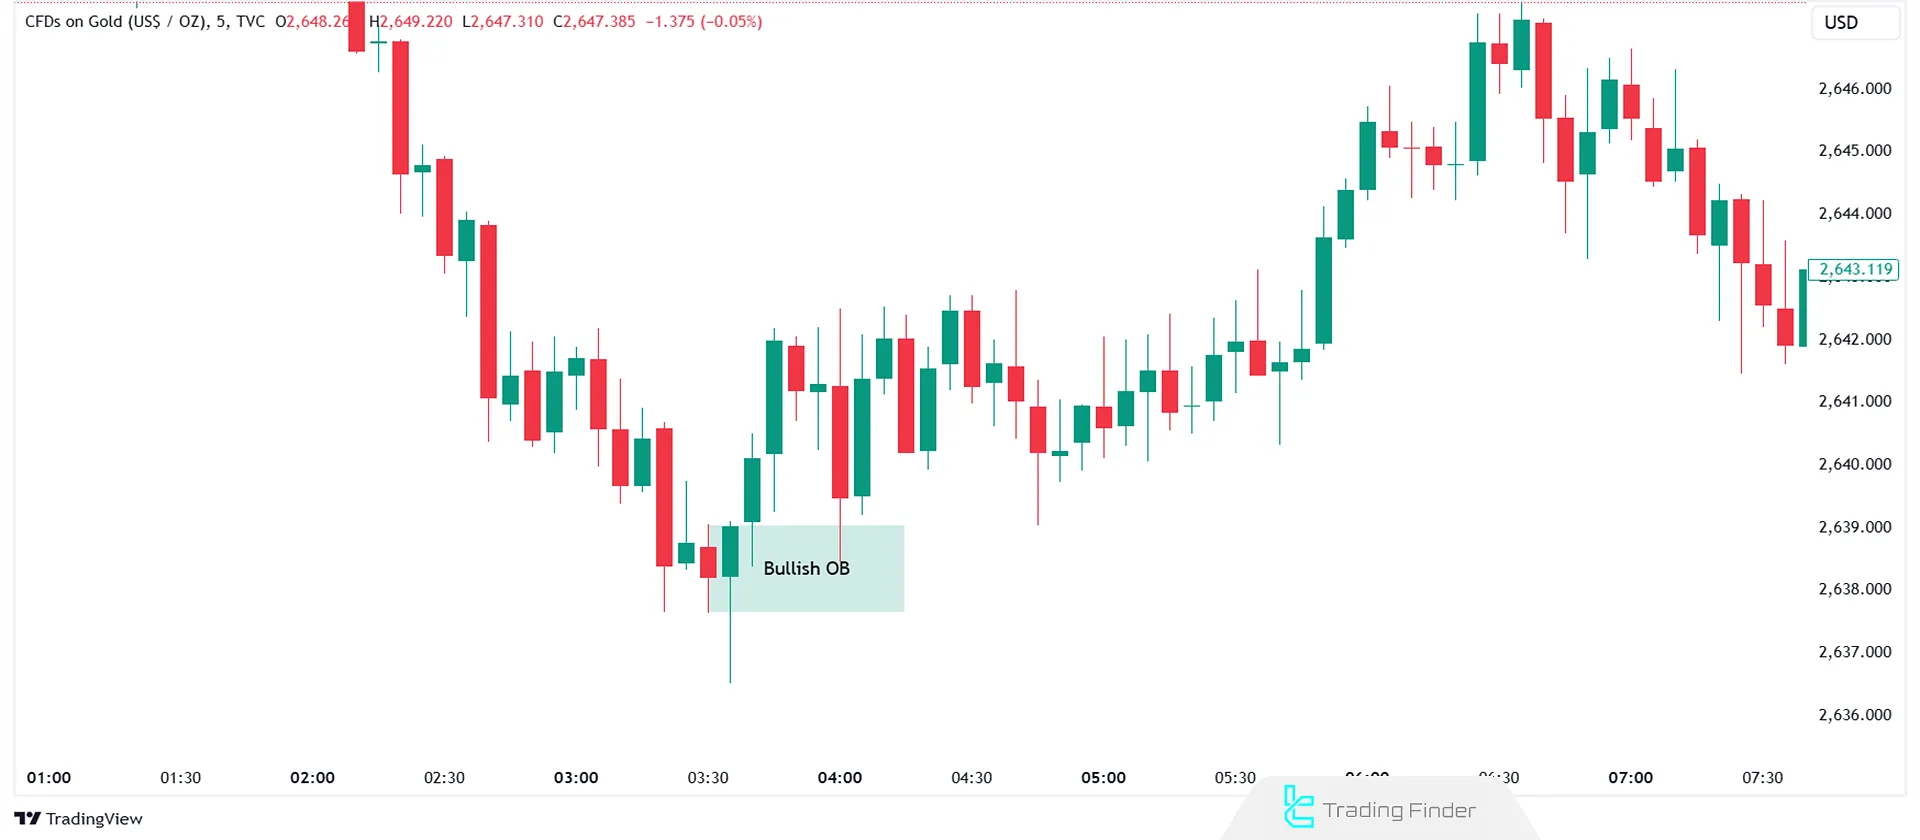
In the example above, the market shifts structure towards buying, indicating bullish momentum.
After forming a Bullish OB, the price retraces to the OB, allowing for a long position upon confirmation in lower timeframes.
Stop Loss and Take Profit in Bullish OB Trading
When trading based on the bullish order block, place the stop-loss a few pips below the order block zone; the next liquidity grab zones can also be used to determine the take-profit.
In general, the trader must first confirm the validity of the bullish OB in higher timeframes, then extract the precise entry point and logical stop-loss in lower timeframes, and finally choose an appropriate take-profit based on the liquidity zones along the price path.
Example of Setting Take-Profit and Stop-Loss in a Bullish Order Block Trade
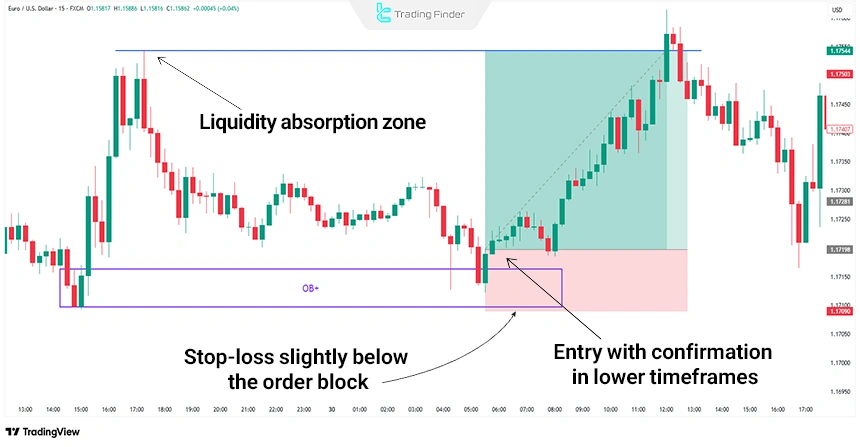
In the EUR/USD chart on the 15-minute timeframe, a bullish order block is observed that has remained untouched.
This order block has formed in an uptrend on a higher timeframe and is aligned and confirmed in terms of the fractal timing structure of the market.
With the first price return to the order block zone, one can look for confirmation candles or a structure shift in lower timeframes to enter a buy trade.
After the buy signal is issued, the trade is entered and the stop is placed with slight distance below the bullish order block. Also, for the take-profit or the target of this trade, the liquidity-grab zones can be used.
Using Bullish OBs in Different Market Conditions
Bullish OBs are effective in trending markets and in ranging or neutral markets, where they can act as reversal points.
Precise market structure analysis and multiple timeframes are essential for identifying these zones under such conditions.
When the market structure is irregular or filled with rapid corrections, multi-timeframe analysis becomes more important.
In higher timeframes, powerful and durable order blocks are identified, and lower timeframes show the precise price behavior when entering these zones.
The combination of these two makes it possible to recognize the supportive or reversal role of the continuation order block in a neutral phase.
In the educational video from the TTrades channel on YouTube, further explanations about using order blocks in various market conditions are provided, which interested individuals can benefit from.
The Role of the Bullish Order Block in Different Trends
In an uptrend, the bullish order block (Bullish Order Block), based on institutional order flow, acts as a continuation zone and shows the last entry point of smart money; a zone that, after price correction, usually activates the next bullish wave.
In a downtrend, the market structure eliminates the possibility of forming support in the bullish order block.
According to Liquidity Theory and ICT Market Structure, this zone becomes active only for collecting buy-side liquidity and is therefore removed before the continuation of the price decline. In fact:
- In an uptrend: Bullish OB is a continuation zone;
- In a downtrend: Bullish OB is a liquidity zone.
The order block training article for traders on the xs.com website provides further explanations about the role of the bullish order block in different trends and how to identify it, which interested individuals can refer to for better understanding.
Bullish Order Block Behavior in Range-Bound Markets
In range-bound markets, price typically oscillates between a fixed high and low. In such conditions, a bullish Order Block usually forms near the Range Low and can act as the starting point of an upward corrective move.
However, its reliability is lower compared to bullish OBs in trending markets. For stronger confirmation, the following conditions are recommended:
- A clear MSS on a lower timeframe;
- Entries only from the Range Low (as entries in the middle of the range are more prone to failure);
- Formation of the OB near an FVG, which increases the probability of it holding.
Common Mistakes Traders Make When Evaluating a Bullish Order Block
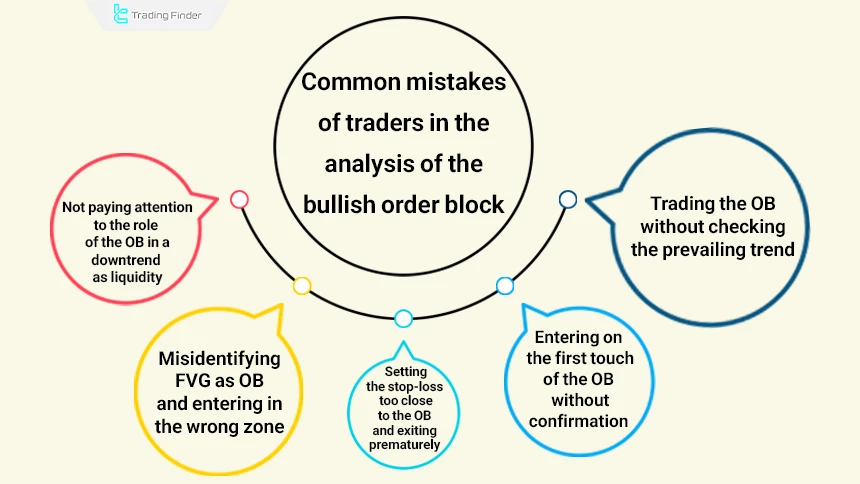
Misinterpreting a bullish OB can lead to early entries and low-quality trades. Some of the most common errors include:
- Trading an OB without checking the dominant trend;
- Entering on the first touch without confirmation (Such as MSS or a confirming candle);
- Ignoring the role of OBs as liquidity in a downtrend;
- Placing stop losses too close to the OB and exiting prematurely;
- Confusing FVG with an OB and entering the wrong price zone.
Order Block Indicator for MetaTrader and TradingView
The Order Block indicator among ICT traders and the Smart Money approach is known as a specialized tool in the MetaTrader platform.
It identifies specific zones by focusing on price behavior and the location of institutional orders, from which powerful movements often originate.
In fact, order blocks are zones where heavy volumes are accumulated, and price returning to these levels activates the potential for rapid reaction and the creation of new flows.
This indicator, with its proprietary algorithm, displays bullish blocks in green and bearish blocks in brown so that the trader can identify high-risk and high-pressure zones without the need for heavy analysis.
- Adding the Order Block indicator in TradingView
- Download the Order Block indicator for MetaTrader5
- Download the Order Block indicator for MetaTrader4
ICT traders, scalpers, and day traders who operate based on supply and demand logic use these visual signals to identify entry and exit opportunities.
For example, in the four-hour chart of a currency pair, the Order Block indicator highlights points that were previously the placement zones of institutional orders, and renewed price contact with these levels creates sharp reversal waves.
Another example is observed in the 15-minute timeframe; where several consecutive levels repeatedly recorded strong reactions and formed powerful resistance zones.
This software also offers the ability to adjust parameters such as Candles To Check to determine the range of candles under review and Theme to choose light or dark mode, so that the tool aligns with the trader’s workflow.
In summary, the Order Block indicator, with high accuracy in identifying reversal and leading zones, is known as an essential tool for traders who follow liquidity flow and institutional behavior.
By displaying levels with the potential for explosive movements, it empowers market structure analysis and the identification of entry points.
Conclusion
The ICT Bullish Order Block (OB) is a tool for pinpointing market entry points and aids in a deeper analysis of order flow and Smart Money Concepts(SMC).
By combining advanced market structures, trading volume, and multiple timeframes, traders can identify optimal entry zone.


