


The Central Bank Dealers Range (CBDR) represents price stabilization before the market’s major moves. Central banks and large financial institutions use this range to manage liquidity and prepare the market for significant shifts. CBDR is used to identify breakouts or reversals and guide daily bias in higher timeframes.
Price reactions to the high and low of this range usually provide the trader with important signals about the next market phase, including accumulation, liquidity manipulation, or the start of a strong directional move.
What is the Central Bank Dealers Range (CBDR)?
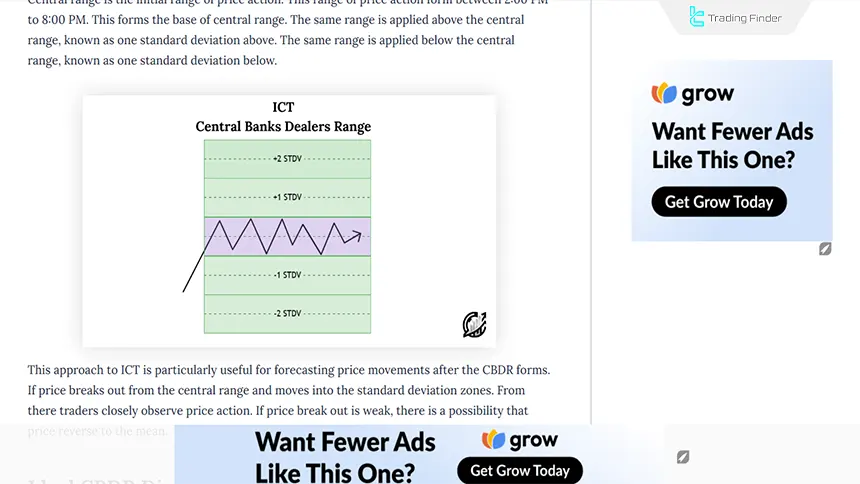
The CBDR price range in ICT Strategy is used to predict a trading day's highest and lowest price. This range is calculated between 2:00 PM and 8:00 PM New York time, and higher or lower ranges can be estimated using specific deviations from the average price.
The range can be expanded by incorporating deviations above and below the average price. Typically, this deviation reflects how prices are dispersedrelative to the mean.
Visual tutorial on how CBDR is formed from the Writo-Finance website:
Advantages and Disadvantages of CBDR
The CBDR range is a method for identifying liquidity zones, forecasting the range of volatility, and filtering out non-structural price movements.
This concept aligns with Smart Money logic and ICT and is applicable across most markets. However, high timing precision and analytical experience during news conditions are essential to avoid misleading signals. Table of Advantages and Disadvantages of CBDR:
Advantages | Disadvantages |
Precise identification of daily liquidity zones | High dependence on calculation timing accuracy |
Estimation of daily volatility range and direction | Weak performance in low-volatility markets |
Filtering price noise and eliminating weak signals | Requires specialized interpretation and high experience |
Aligned with Smart Money Concept structure | High sensitivity to news and macroeconomic data |
Applicable across different assets and timeframes | Analytical errors if the range is non-standard |
Provides precise boundaries for dynamic risk management | Relative incompatibility with algorithmic behavior of some currency pairs |
What Range is Ideal for CBDR?
Determining the appropriate size for the CBDR plays a fundamental role in analytical accuracy and the quality of trade entries.
The range must represent the true area of liquidity accumulation not so tight that it creates noise, and not so wide that the validity of the price structure is lost. Suitable ranges for CBDR:
- Range Height: Calculated by finding the highest and lowest price within the specified time. It is preferable to use the candlestick bodies; however, candlestick wicks can be included if the bodies are too small;
- Optimal Range: CBDR should ideally be less than 40 pips, with 10 to 20 pips yielding better results;
- Larger Ranges: Short-term trades tend to perform better if the range exceeds 40 pips.
CBDR training video from the airKam Trader YouTube channel:
Impact of Economic News and Macroeconomic Data on the CBDR Range
The release of macroeconomic data such as interest rates, CPI, and the NFP report usually leads to increased volatility and a breakout of the CBDR range. This reaction occurs due to liquidity shifts at the boundaries of the range and the activation of hidden orders from large banks.
In the ICT style, news is considered merely a time catalyst, not the primary driver of directional movement. When data contradicts market expectations, an initial deceptive move (false breakout) is often created in the opposite direction, after which the real liquidity flow enters the market.
A professional trader reviews the range after the news release and adjusts entries based on price behavior around the new boundaries. Understanding the relationship between macroeconomic data and CBDR structure is one of the key elements of analysis in the ICT style.
Example of the Impact of Macroeconomic Data on CBDR
Changes in monetary policy and macroeconomic data such as interest rates and the NFP employment report directly affect the range and direction of the CBDR.
These variables shift interbank liquidity flow, alter order distribution structure, and create the conditions for either a breakout or an expansion of the range on one side of the market. An example of the impact of fundamentals on CBDR:
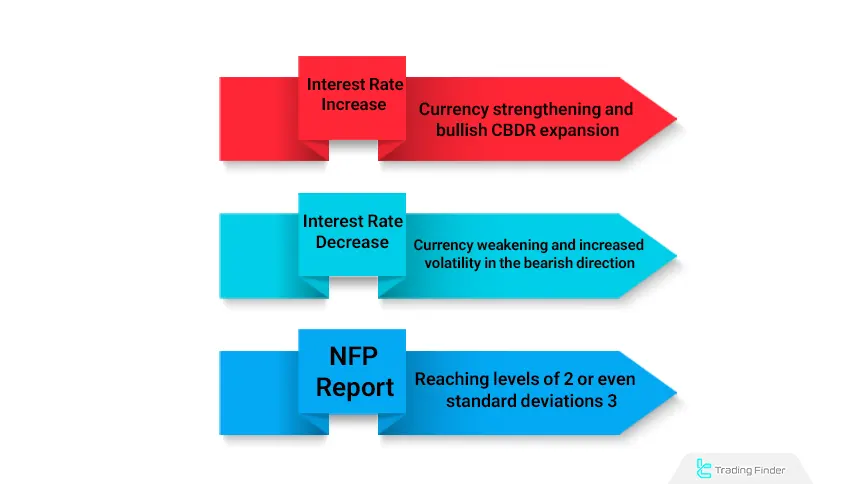
- Interest rate increase: Leads to strengthening of the currency value and expansion of the CBDR range in the bullish direction;
- Interest rate decrease or expansionary policies: Usually result in currency weakening and increased volatility in the bearish direction;
- NFP report (U.S. Non-Farm Payrolls): One of the most important reports, which often expands the CBDR range to levels of 2 or even 3 standard deviations.
Forex Factory Indicator for Fundamental Impact on CBDR
The Forex Factory indicator is one of the key analytical tools for identifying and monitoring economic events that affect the market.
This indicator displays data such as GDP growth rates, interest rates and unemployment, inflation data (CPI), and central bank decisions directly on the chart, and it has high analytical value for traders who use the ICT style and the CBDR range.
In the CBDR framework, volatility caused by economic news acts as a time catalyst for breaking or expanding the range.
Combining an economic calendar indicator with CBDR analysis allows traders to identify moments when macroeconomic data releases coincide with liquidity range breakouts.
For example, if the CBDR range is in a compression phase before a news release, the publication of a high-impact data point such as an interest rate decision or NFP can act as the trigger for a breakout on either side of the range.
The Forex Factory indicator, through its filter settings, allows selection of high-, medium-, or low-impact events and can display only data related to a specific currency such as the dollar, euro, or pound.
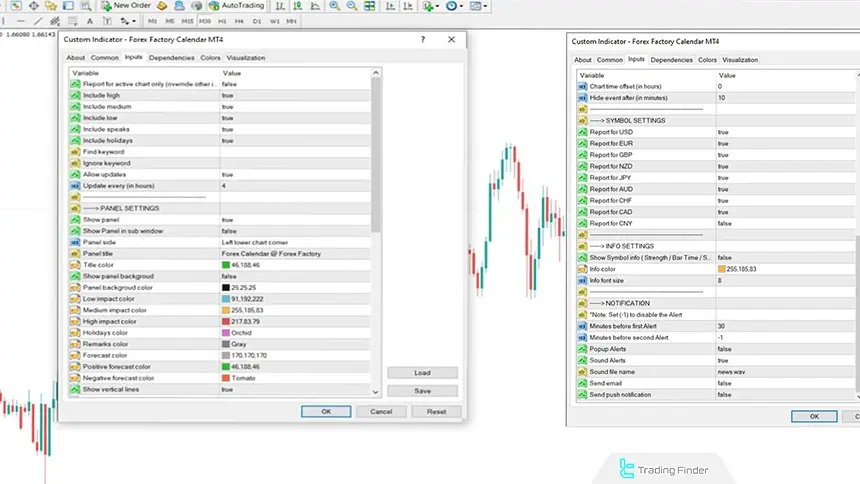
This feature is particularly important in CBDR analysis, as it allows the trader to align the CBDR formation window with the timing of news releases and evaluate the real impact of the data on the price range.
In practice, if the indicator shows that an important USD-related news event is released at 13:30, the trader can analyze price reaction within the CBDR range during the 14:00–20:00 (New York time) window.
A breakout or rejection from the range boundary serves as a signal of the day’s liquidity direction. Overall, the Forex Factory Calendar indicator acts as a complement to CBDR analysis.
This tool clarifies the timing and intensity of macroeconomic events and enables traders to analyze liquidity ranges with high temporal precision and in alignment with real Smart Money Flow. Forex Factory Calendar Indicator Download Links:
How to Use CBDR in Trading?
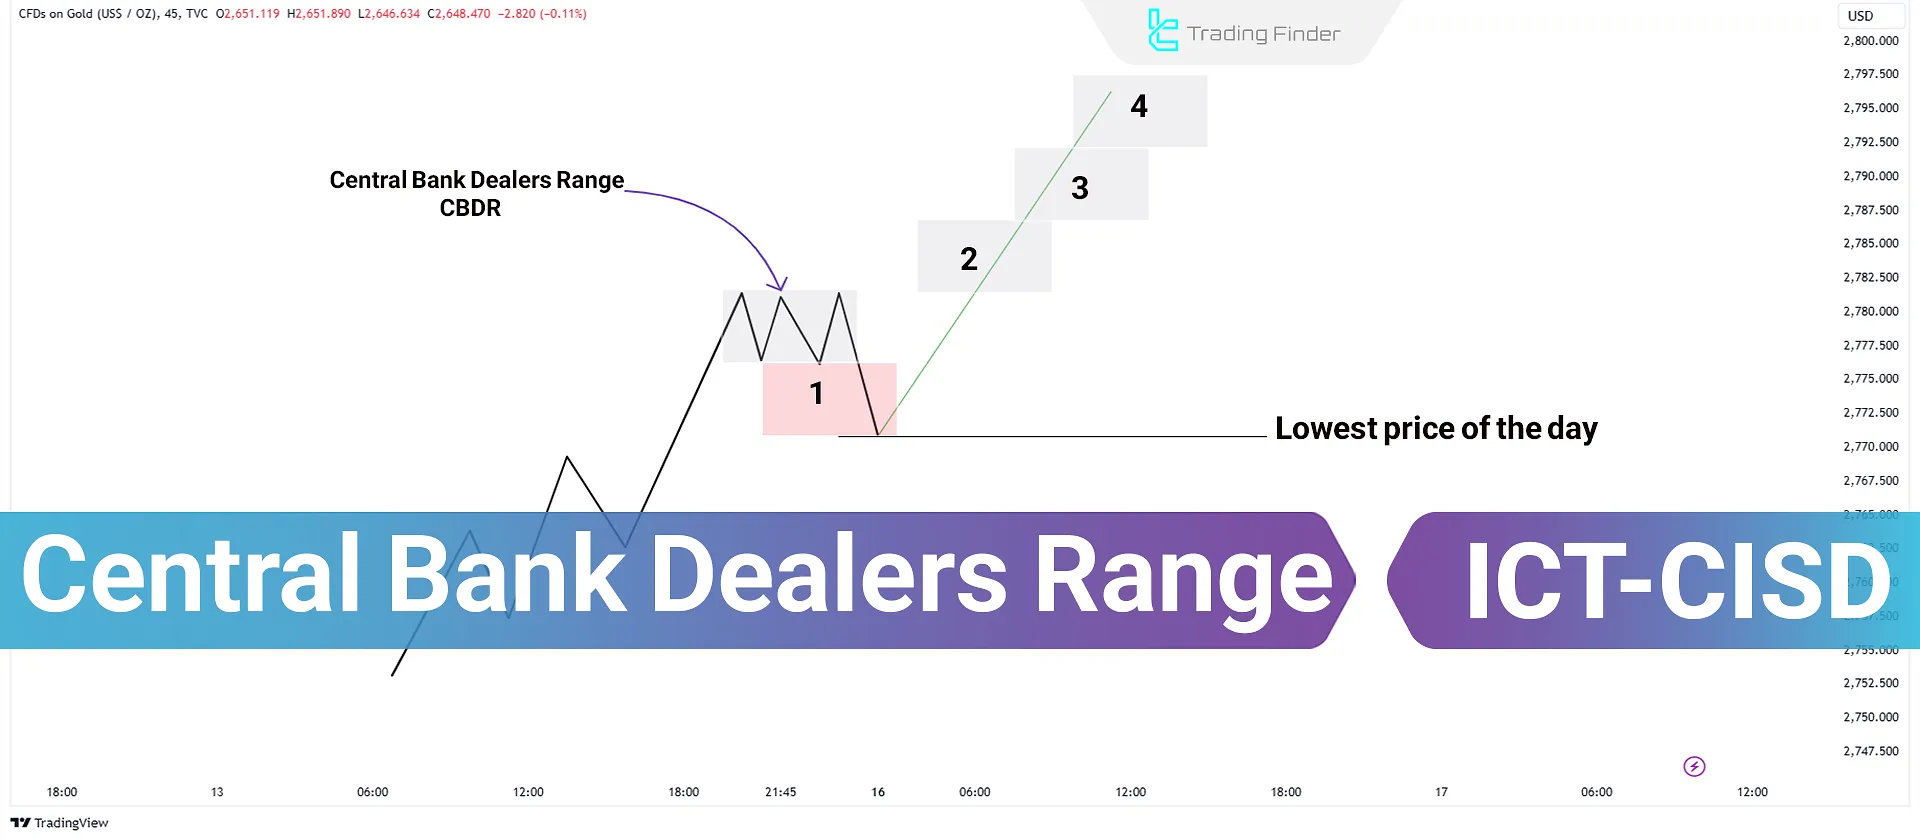
Each trading day, the market seeks to move the price at least 1–2 times the CBDR range against the trend in order to collect liquidity.
Then, it moves four steps in the trend direction, equivalent to the daily CBDR range.
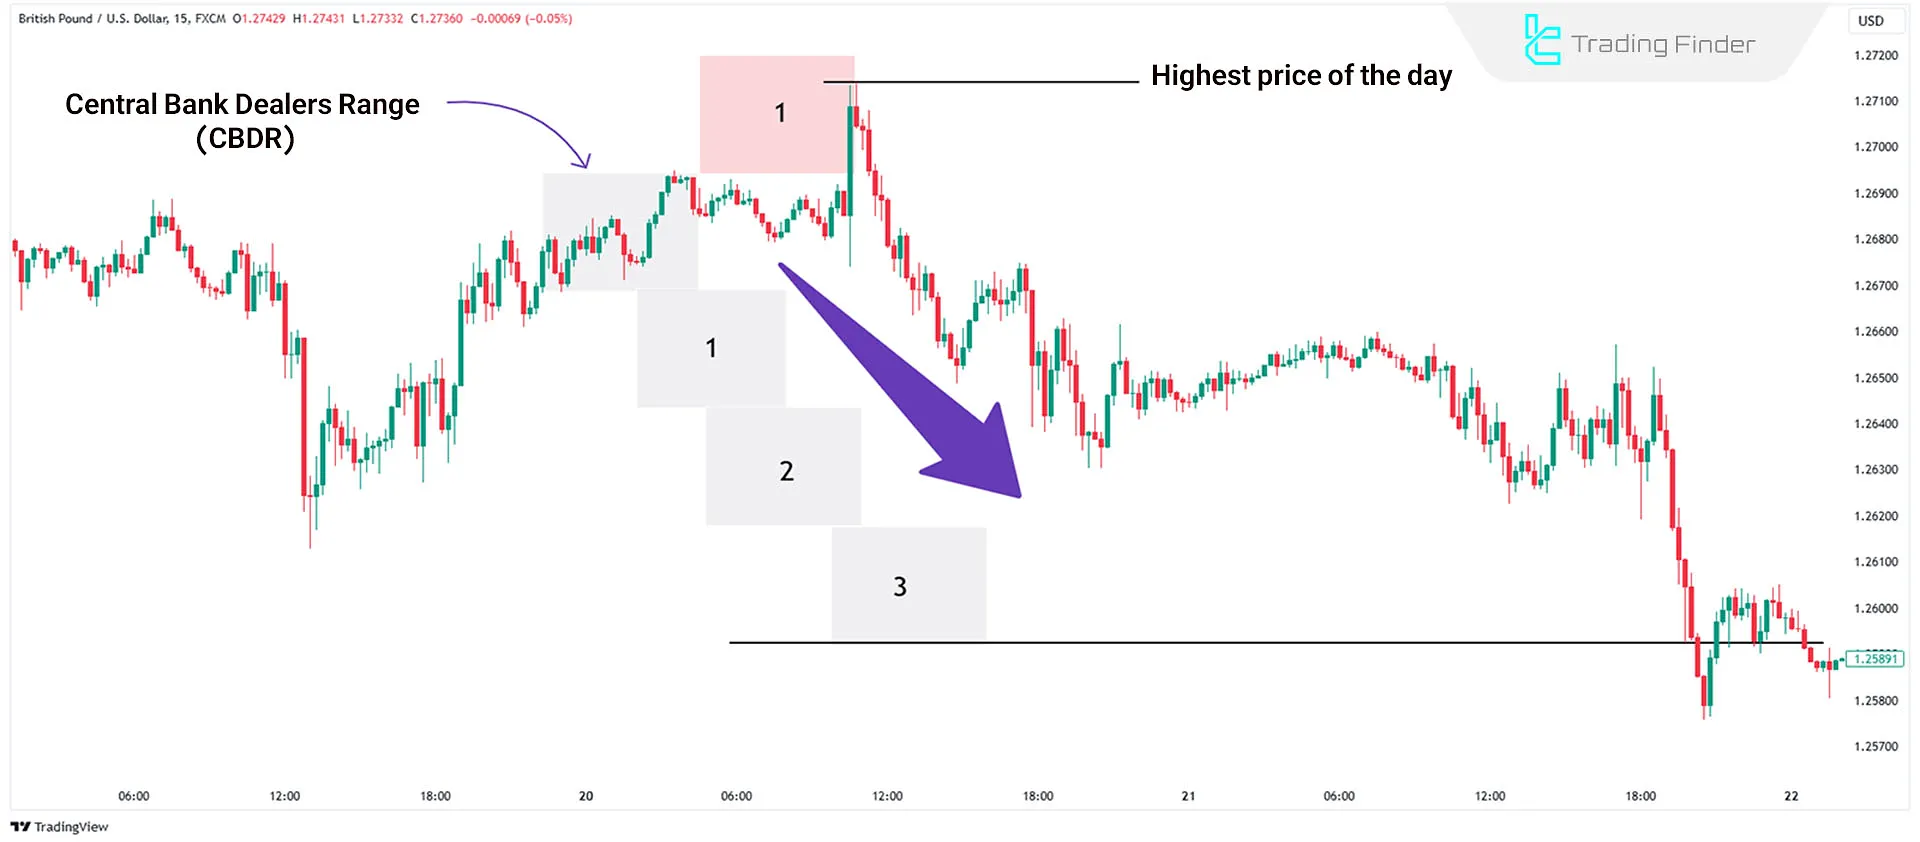
Bearish Days
On bearish days, the ideal scenario is for the price to exceed the CBDR range by no more than two units, typically moving just 1 unit up to collect liquidity.
The day's lowest price can be predicted as three units below the CBDR range, typically seen at the end of the London trading session.
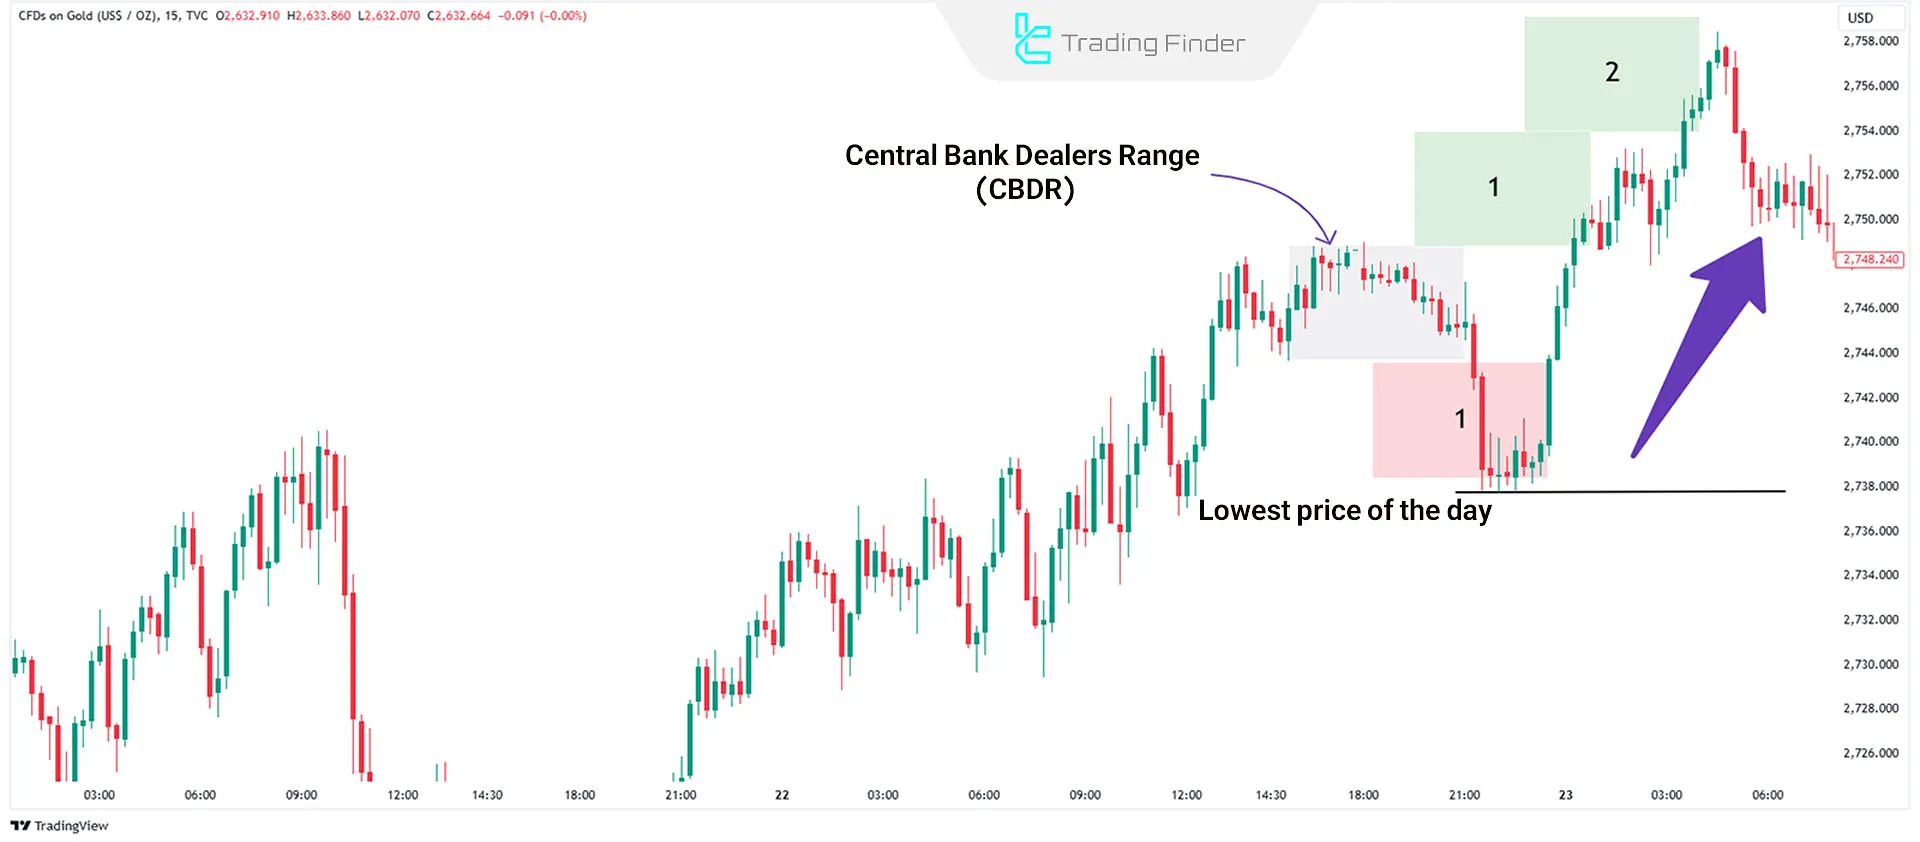
Bullish Days
On bullish days, the ideal scenario is for the price to drop no more than two units below the CBDR range, typically moving just 1 unit down to collect liquidity.
The day's highest price can be predicted as three units above the CBDR range, typically seen at the end of the London trading session.
Beside CBDR, ypu can learn how to use other strategies in TradingFinder forex education section.
Which Timeframes Are Suitable for CBDR?
The best timeframes for CBDR are 15-minute and 30-minute intervals:
- 15 Minutes: Ideal for short-term trades, providing a more precise view of price fluctuations;
- 30 Minutes: Better for an overall view and long-term planning.
Which Currency Pairs and Assets Are Suitable for CBDR?
CBDR was initially designed for trading NASDAQ and S&P500 indices. Following its success, this method expanded to other financial markets, including forex and precious metals.
Currency pairs like “GBP/USD” and “EUR/USD” are the best choices for this strategy. Additionally, it has performed well in the gold market (XAU/USD.)
How to Achieve Better Results with CBDR?
To succeed with CBDR, traders should focus on the following principles:
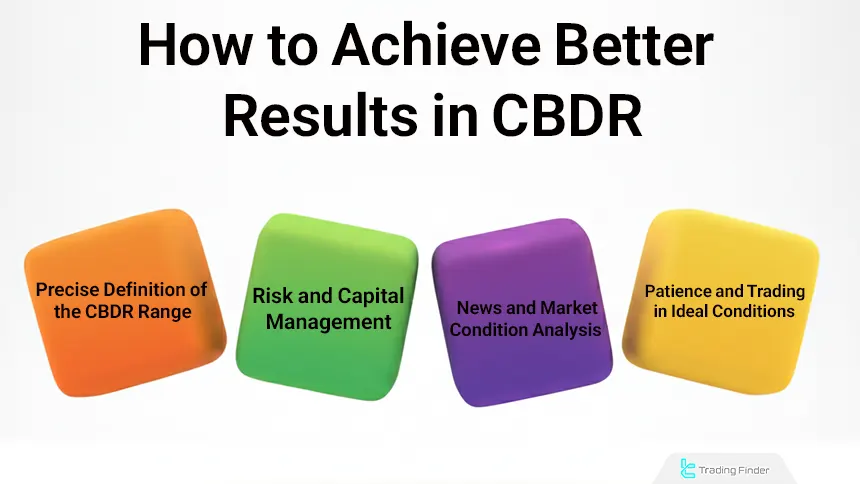
- Precise identification of the CBDR range;
- Risk and capital management;
- Analyzing news and market conditions;
- Exercising patience and trading under ideal conditions.
What Role Do Central Banks Play in CBDR?
Central banks and smart money significantly influence the CBDR and its formation:
- Interest Rate Decisions: Cause changes in price volatility and the CBDR range; You can be aware of these changes by using TradingFinder Central Bank Interest Rates Tool
- Monetary Stimulus Actions: Affect price ranges by increasing or decreasing liquidity
- Currency Interventions: Lead to sudden changes in the CBDR range
Which Days of the Week Are Best for CBDR?
- Tuesdays and Wednesdays: These days often mark weekly highs or lows, offering more opportunities for CBDR-based trades;
- Days with Significant Economic News: High-impact news releases (e.g., interest rate decisions, employment reports, or inflation data) can create volatility, driving prices toward CBDR targets;
- Overlap of Trading Sessions: The overlap between London and New York sessions, known as the kill zone, offershigh volume and suitable trading opportunities.
Common Mistakes in Using CBDR
In analysis and trading based on CBDR, precision in defining the range and interpreting price behavior is crucial. Even a small error in calculation or timing can invert the perceived liquidity direction and distort the analytical structure.
Most mistakes stem from incorrect execution of basic principles such as selecting the correct time window, filtering news, and distinguishing real breakouts from deceptive ones. Types of common mistakes in using CBDR:
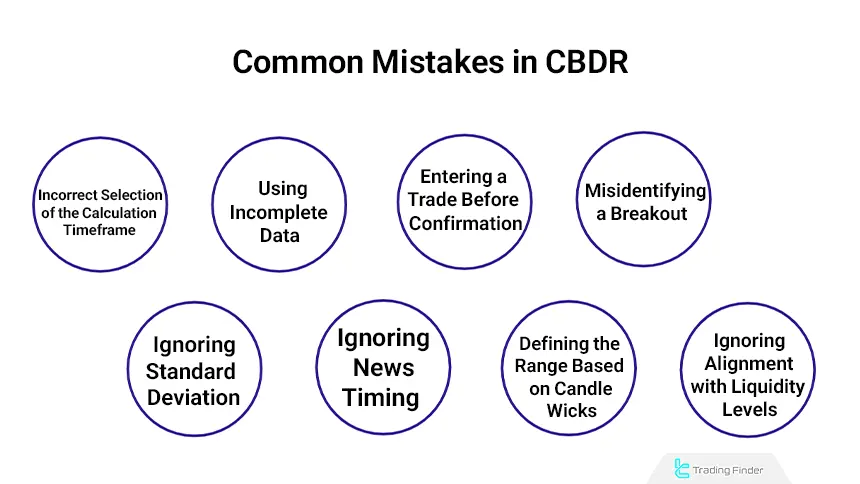
Incorrect Selection of the Calculation Time Window
Many traders do not adhere to the official CBDR time (usually between 14:00 and 20:00 New York time) and instead use data from other sessions. This mistake causes the real liquidity range-especially during the London-New York overlap-to be missed.
As a result, the drawn range does not represent true market liquidity, and the validity of analyzing breakouts, fake breakouts, and price direction decreases.
Using Incomplete Data or Invalid Candles
Defining the range based on candles with wide spreads or low liquidity leads to incorrect measurement of the range high and low. For greater accuracy, candles with normal volume and confirmed closes should be used.
This approach ensures that the drawn range reflects real institutional behavior and avoids the impact of random volatility or low-quality market moves.
Entering a Trade Before Range Confirmation
Early entry before the final reference candle closes is one of the main reasons for premature trade failure. CBDR is not valid until price stabilizes within it, and any early breakout may simply be a liquidity grab.
Final confirmation of the range occurs only after the full close of the reference candle; before that, any trading decision is based on unstable and high-risk assumptions.
Misidentifying a Real Breakout vs. a Fake Breakout
Many traders interpret the initial breaks after range formation as trend-direction signals. However, in ICT logic, these moves are often stop hunts, and the true direction becomes clear only after price returns.
Therefore, waiting for confirmation through price re-entry into the range and observing a structural reaction helps avoid rushed entries and liquidity traps.
Ignoring Standard Deviation (Deviation) and the Range-to-ATR Ratio
The Central Bank Dealing Range (CBDR) should be aligned with the average daily volatility (ATR). If the range is too small, the probability of deceptive breakouts increases; if it is too large, the market enters a compression phase.
Logical alignment between CBDR and ATR results in a balanced and reliable range that reflects real liquidity behavior and filters out false signals.
Ignoring the Timing of Economic News
The release of macroeconomic data can invalidate the range. Many traders continue using the old range without recalibrating it after news events, leading to misanalysis.
After major news releases, market reaction must be reassessed, and if structure changes or abnormal volatility occurs, the CBDR range should be recalculated to reflect new market conditions.
Defining the Range Based on Candle Wicks Instead of Valid Bodies
Non-structural wicks are usually the result of temporary volatility or large order executions. In professional analysis, CBDR should be calculated based on candle bodies (body range) to eliminate false deviations.
Focusing on candle bodies ensures the drawn range reflects true price consensus and removes the impact of emotional moves or momentary institutional orders.
Ignoring Alignment with Higher- and Lower-Timeframe Liquidity Levels
CBDR alone is not sufficient; it must align with higher-timeframe liquidity structures (liquidity pools). Ignoring this alignment increases the likelihood of trading against the true market direction.
Aligning CBDR with higher-timeframe liquidity provides a multidimensional market view and enables the trader to identify the true direction of price movement with a higher probability of success.
Conclusion
The Central Bank Dealers Range (CBDR) is designed to identify price highs and lows within a trading day. This style combines time analysis, price ranges; Central bank behavior, enables traders to make more informed decisions about daily trades.
This approach, by focusing on liquidity flow and price reactions during the main trading sessions, provides the trader with a deeper view of the market’s daily directional bias.


