


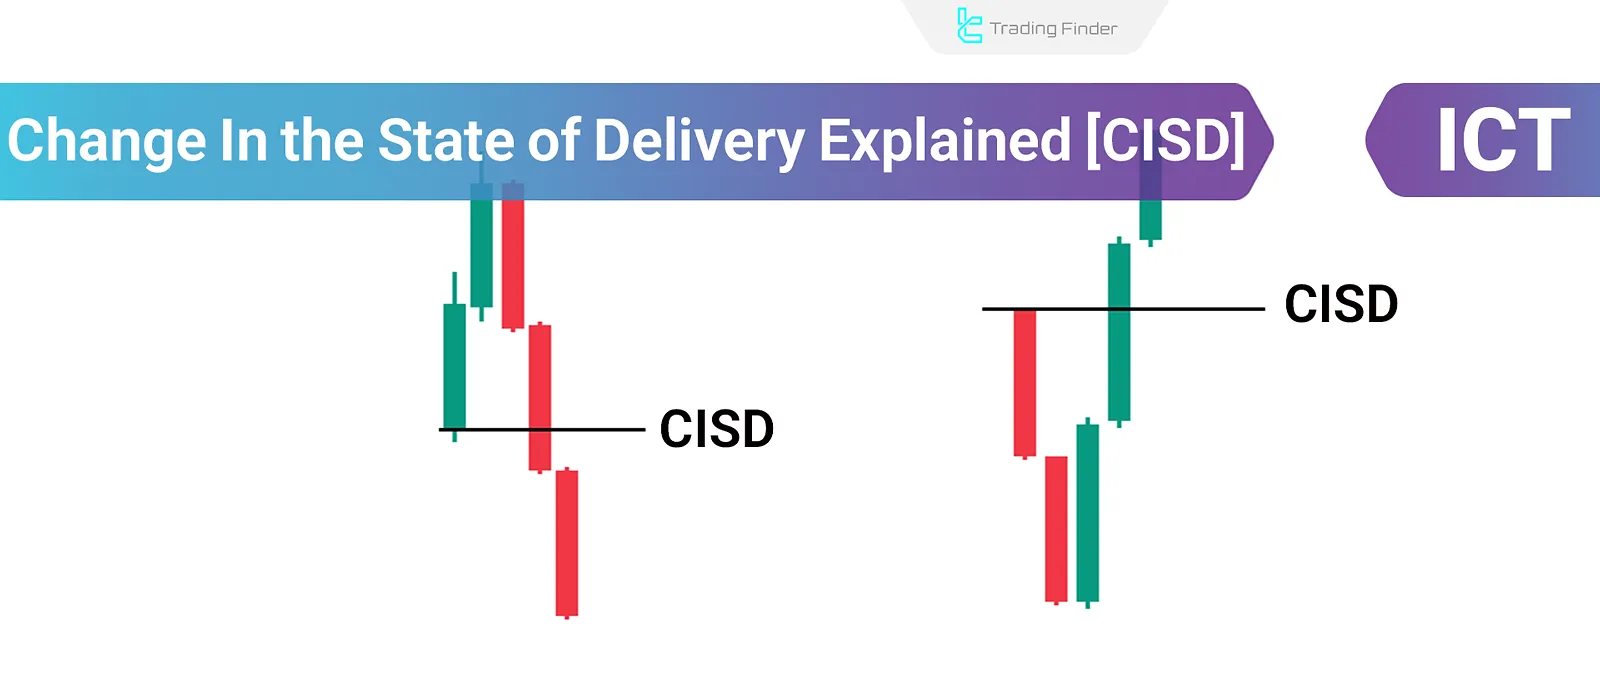
The Change in the State of Delivery (CISD) represents a shift in the price trend flow from bullish to bearish or vice versa in the ICT trading style.
When one or more candlesticks form in one direction, followed immediately by candlesticks forming in the opposite direction (closing below the opening price of the initial candles), a CISD occurs.
The best performance of CISD in forex occurs when it aligns with the daily bias and takes place during the major sessions (such as London/New York); in this situation, the error rate decreases.
Features of CISD
- Quick Identification of Price Direction Changes: CISD provides an early indication of potential price reversals before the Market Structure Shift (MSS) occurs;
- Focus on Candlestick Open and Close Levels: CISD analysis only considers candlestick open and close prices, disregarding wicks;
- Adaptability Across Markets: This style applies to all markets, including forex, stocks, indices, and cryptocurrencies.
For a visual tutorial on Change in State of Delivery (CISD), you can use the instructional video by TTrades:
Advantages and Disadvantages of CISD
Changes in the state of price delivery in ICT strategies can provide fast entry points, but if the limitations are ignored, they carry high risk. The table below shows the key advantages and disadvantages of Change in State of Delivery (CISD):
Advantages | Disadvantages |
Faster signaling than MSS and ChoCH; suitable for early entries | Possibility of false signals |
Focus only on Open/Close and removal of wick noise | High sensitivity to short-term volatility and lower timeframes |
Applicable in scalping (LTF) and for confirming structure in HTF | Requires confirmation with MSS or ChoCH to reduce risk |
Combines well with FVG and Order Block | Possibility of errors and consecutive losses without complementary tools |
Good performance in active trends and major sessions | Lower reliability in low-volatility ranges or during major news events |
Technical Aspects of CISD
The technical specifications of CISD include complex data analysis and decision-making optimization.
This system, by evaluating real-time changes in price structure and order flow, provides a more precise view of trend-shift points and trading opportunities. Technical specifications of Change in State of Delivery:
Multi-Timeframe Analysis
In analyzing and executing the CISD strategy, choosing the right timeframe plays a decisive role in the accuracy and reliability of the signals. A proper combination of higher timeframes to identify the overall trend and lower timeframes to determine entry points is used:
- Higher Timeframes: Use larger timeframes, such as daily or weekly, to confirm CISD signals as they provide a clearer view of overall market trends;
- Lower Timeframes: Use smaller timeframes, such as 15 minutes or 1 hour, to pinpoint exact entry points;
- Timeframe Combination: Combining higher and lower timeframes enhances signal strength and entry precision.
Identifying Order Blocks
In CISD, the type of order block formed depends on the direction of the trend change. After a bullish CISD occurs, the previous bearish candles turn into a support zone, and in a bearish scenario, the bullish candles before the shift take on a resistance role.
Market Timing
In analyzing price behavior with the CISD pattern, the timing of the signal is highly important.
This pattern has the greatest validity when it forms during active market hours or simultaneously with major economic events, because during these periods liquidity volume and price reactions reach their peak.
How CISD Differs from MSS
CISD is mainly used for identifying short-term changes and finding entry and exit points, while Market Structure Shift (MSS) is used to identify major changes in market structure.
Comparison table of CISD and MSS:
CISD | MSS |
Focus: Change in buying and selling strength. | Focus: Change in overall market trend. |
Level of Analysis: Details of candlesticks (open and close). | Level of Analysis: Key levels and decisive breakouts. |
Timeframe: Short-term analysis. | Timeframe: Long-term changes. |
Difference Between CISD and Change of Character (CHoCH) in ICT
For many beginner traders, CISD and Change of Character (CHoCH) look very similar, but in reality, they are two distinct concepts with different applications. Table of differences between CISD and CHoCH:
Comparison Criteria | CISD (Change in the State of Delivery) | CHoCH (Change of Character) |
Basis of analysis | Change in the delivery pattern of candles based on Open/Close | Break of market structure and changes in swing highs/lows |
Signal timing | Occurs earlier and provides an initial reversal signal | Occurs later and confirms the trend change |
Accuracy in lower timeframes | High, but with a high risk of failure | Lower in LTF, higher in HTF |
Main application | Capturing early and high-risk entry signals | Confirming trend and macro-structure shifts |
Disadvantages | High chance of false signals if used without confirmation | Late warning and missing part of the move |
Ideal combination | CISD as the initial trigger + CHoCH as trend confirmation | — |
The image below shows a tutorial on the difference between CISD and CHoCH from the ICT FR website:
How to Use CISD in Trading
To use CISD (Change in State of Delivery) in trading, follow these steps:
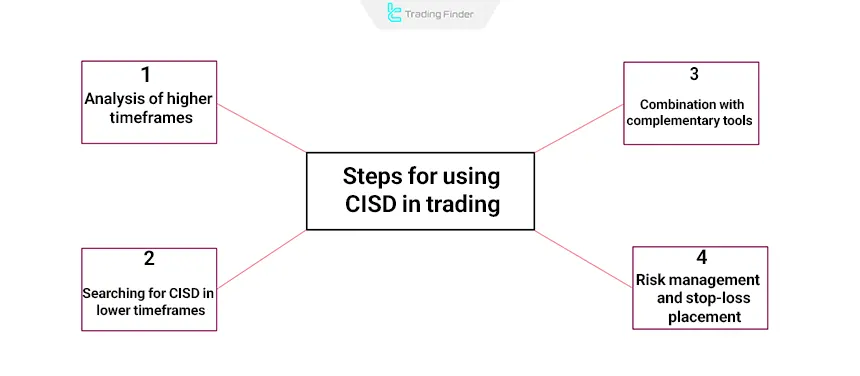
#1 Analyze Higher Timeframes
Determine the overall market trend using higher timeframes such as the daily or 4-hour chart, which provides the broader directional context. Tools like Market Structure and PD Arrays then help refine that directional bias and guide precise decision-making.
#2 Look for CISD in Lower Timeframes
Zoom into shorter timeframes (e.g., 15 minutes or 5 minutes) to identify smaller price movements.
#3 Combine with Additional Tools
After identifying CISD, apply MSS (Market Structure Shift) to confirm broader market changes, strengthening the validity of the signal. Then use Order Blocks and FVGs (Fair Value Gaps) to pinpoint the most precise and optimal entry points.
#4 Risk Management and Stop Loss
In CISD-based trading, precise placement of stop loss and take profit is an important part of risk management and must be adjusted according to market structure and key liquidity zones.
- Stop Loss: In CISD, the stop loss can be placed behind the order block or FVG;
- Take Profit: The take profit should be set at key areas such as the previous high or low, or premium and discount zones.
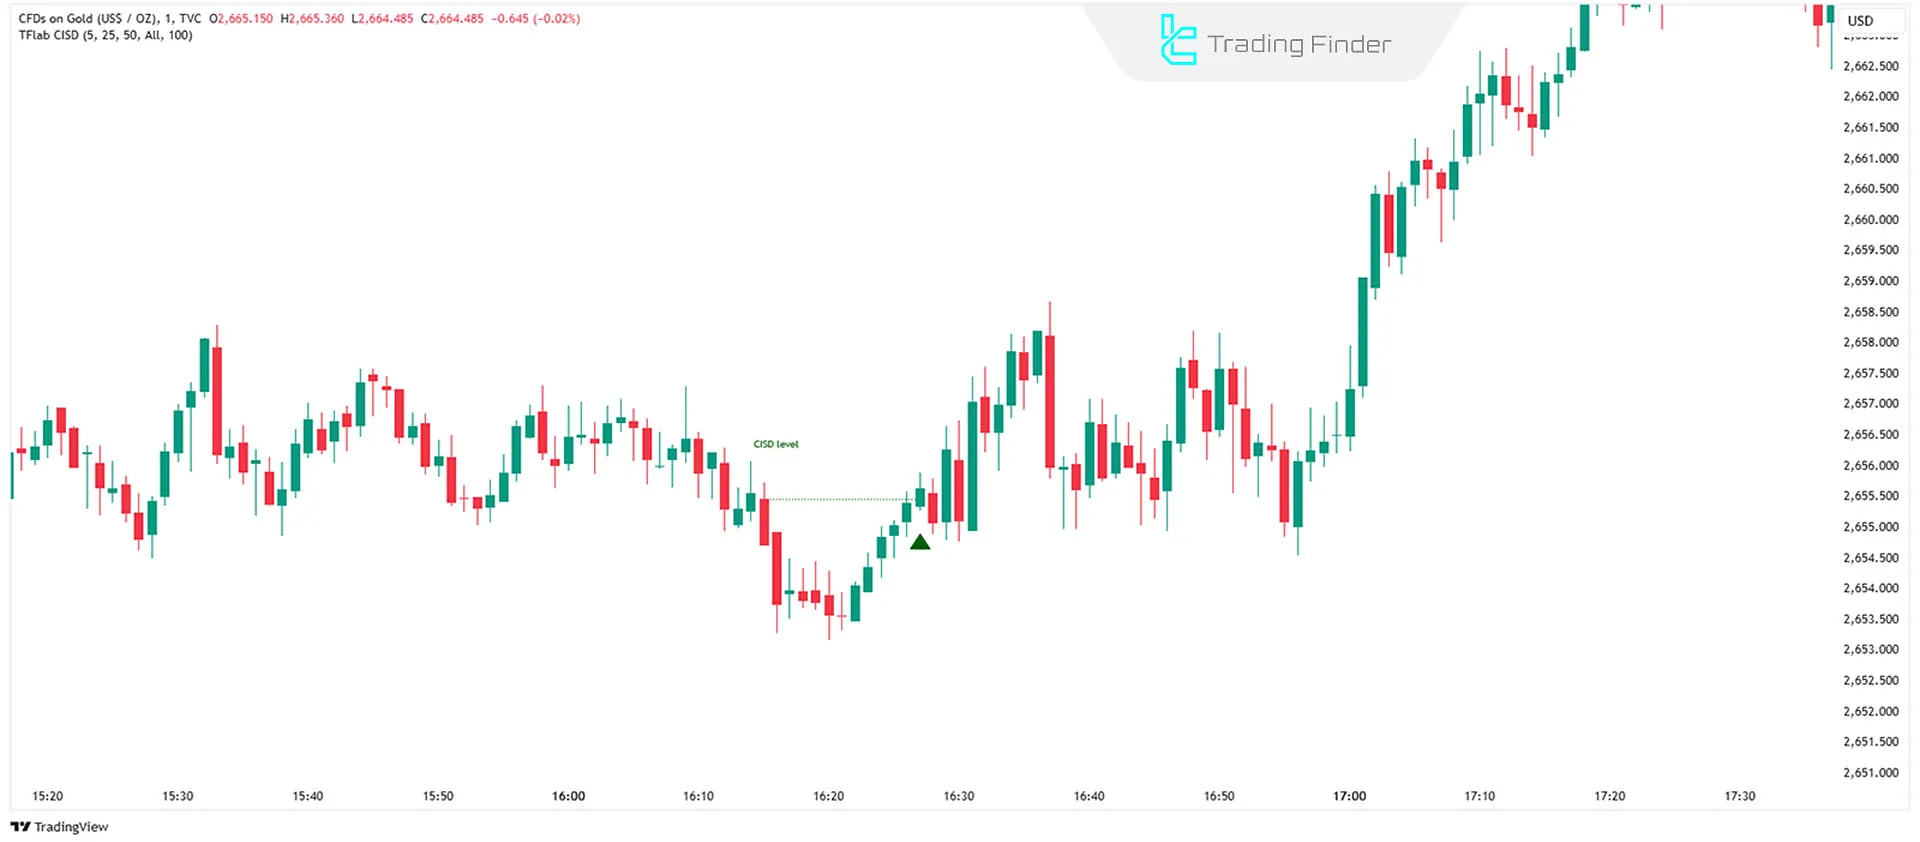
Indicator of Change in the State of Delivery (CISD)
The Change in the State of Delivery (CISD) indicator is one of the widely used tools in the ICT style, designed to identify CISD level breaks and provide trading signals.
Traders can observe the change in the state of delivery on the price chart and analyze buy or sell opportunities based on it.
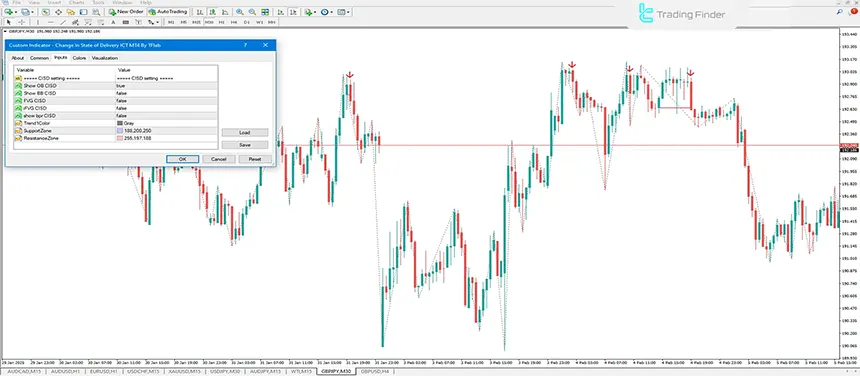
It is categorized under ICT indicators, Smart Money concepts, and signal/forecast indicators, and it can be used by traders of all skill levels from beginner to professional.
As a reversal and break indicator, CISD can display key levels such as FVG, OB, iFVG, BB, and BPR, allowing it to cover various market conditions.
It can also be used in different trading styles such as day trading, intraday trading, and scalping. This feature makes the tool useful for different markets including forex, stocks, and indices.
Tutorial video for using the CISD indicator:
One of the strengths of this indicator is its high flexibility in settings. The trader can enable or disable the display of various elements such as Order Block, Breaker Block, FVG, or BPR based on their needs. This capability allows users to focus more on their preferred structures and conduct more precise analysis.
Another advantage of this tool is issuing buy and sell signals after CISD level breaks, which operationally shows the potential market direction. These signals, combined with Smart Money concepts and market structure, provide suitable entry conditions for traders.
Overall, the CISD indicator is a comprehensive tool for analyzing trend changes and identifying reversal points. Its use, especially for traders working with the ICT style, can create significant added value in detecting breaks and trading opportunities.
Links to use CISD indicators:
- CISD Change in the State of Delivery Indicator for MetaTrader 4
- CISD Change in the State of Delivery Indicator for MetaTrader 5
- CISD Change in the State of Delivery Indicator for TradingView
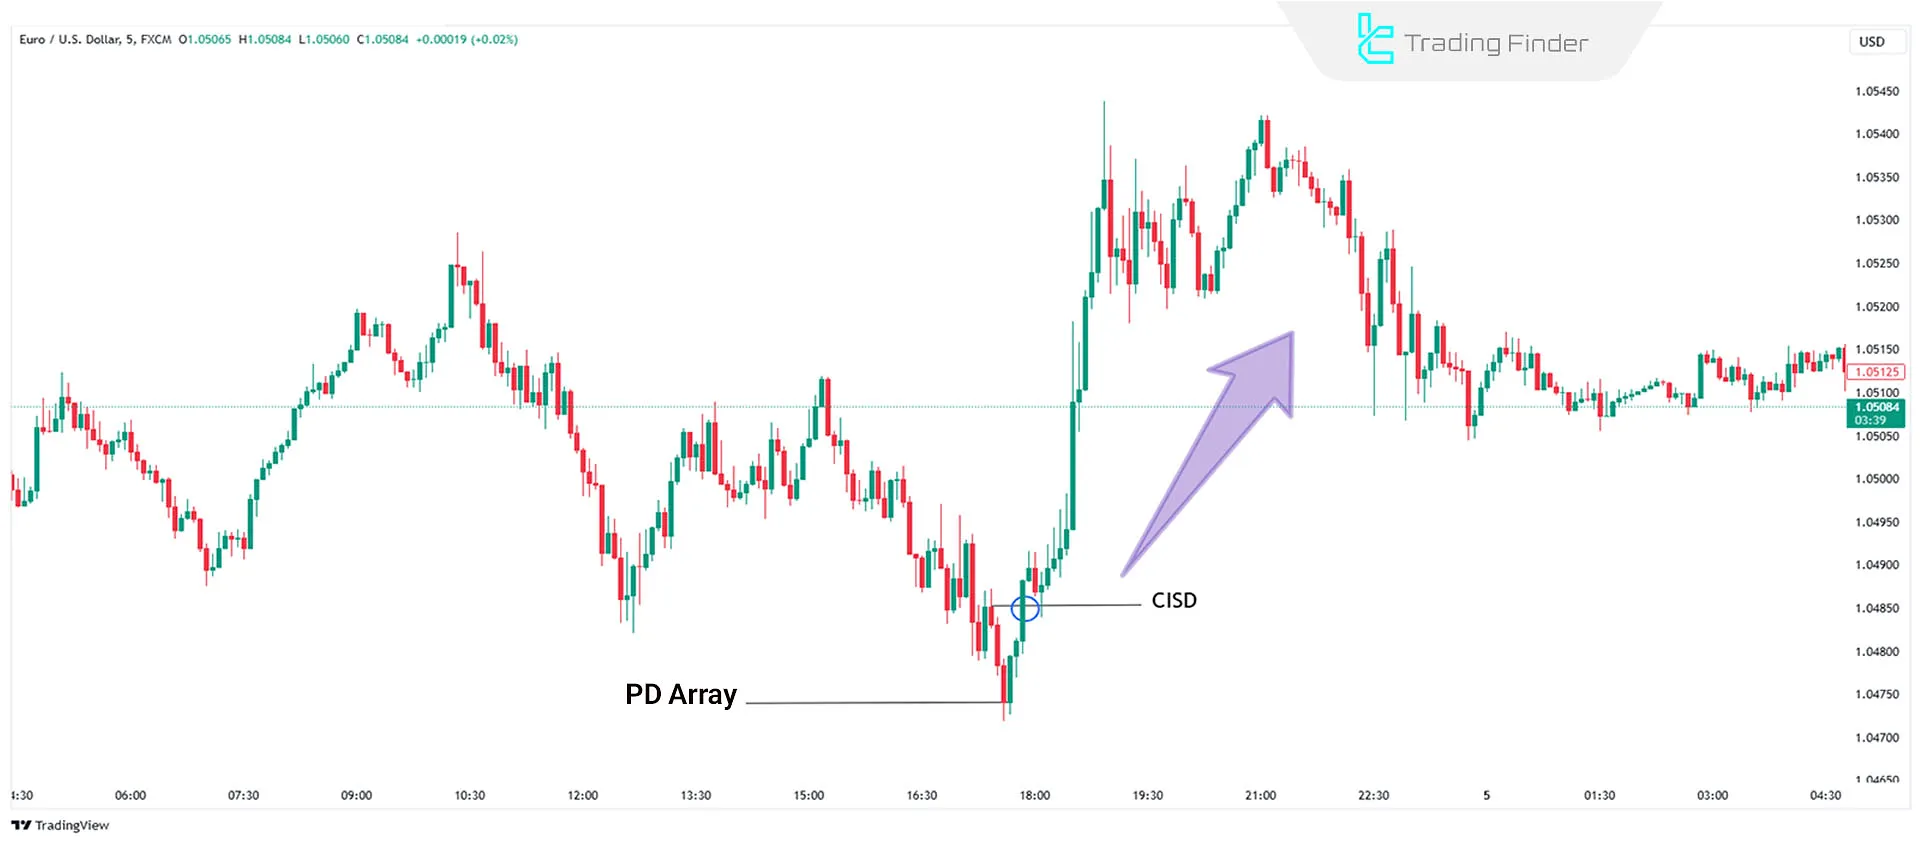
Example of CISD in Buy Trades
Occurs when the price closes above the opening price of a bearish candlestick or series of bearish candlesticks. This signals seller weakness and suggests a potential bullish reversal.
Traders can use tools like Order Blocks or FVGs to enter buy positions.
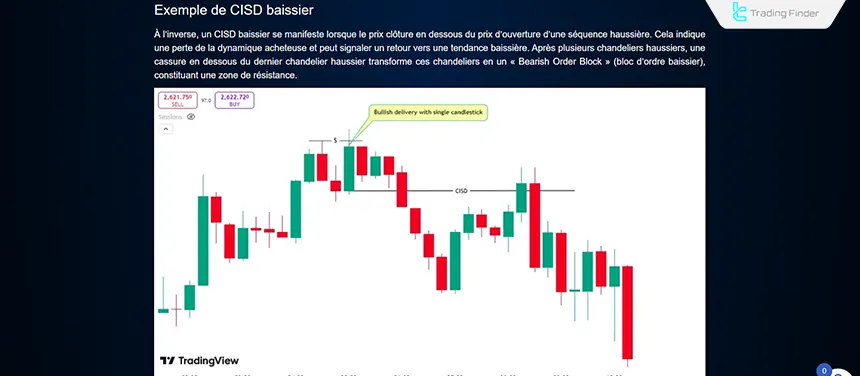
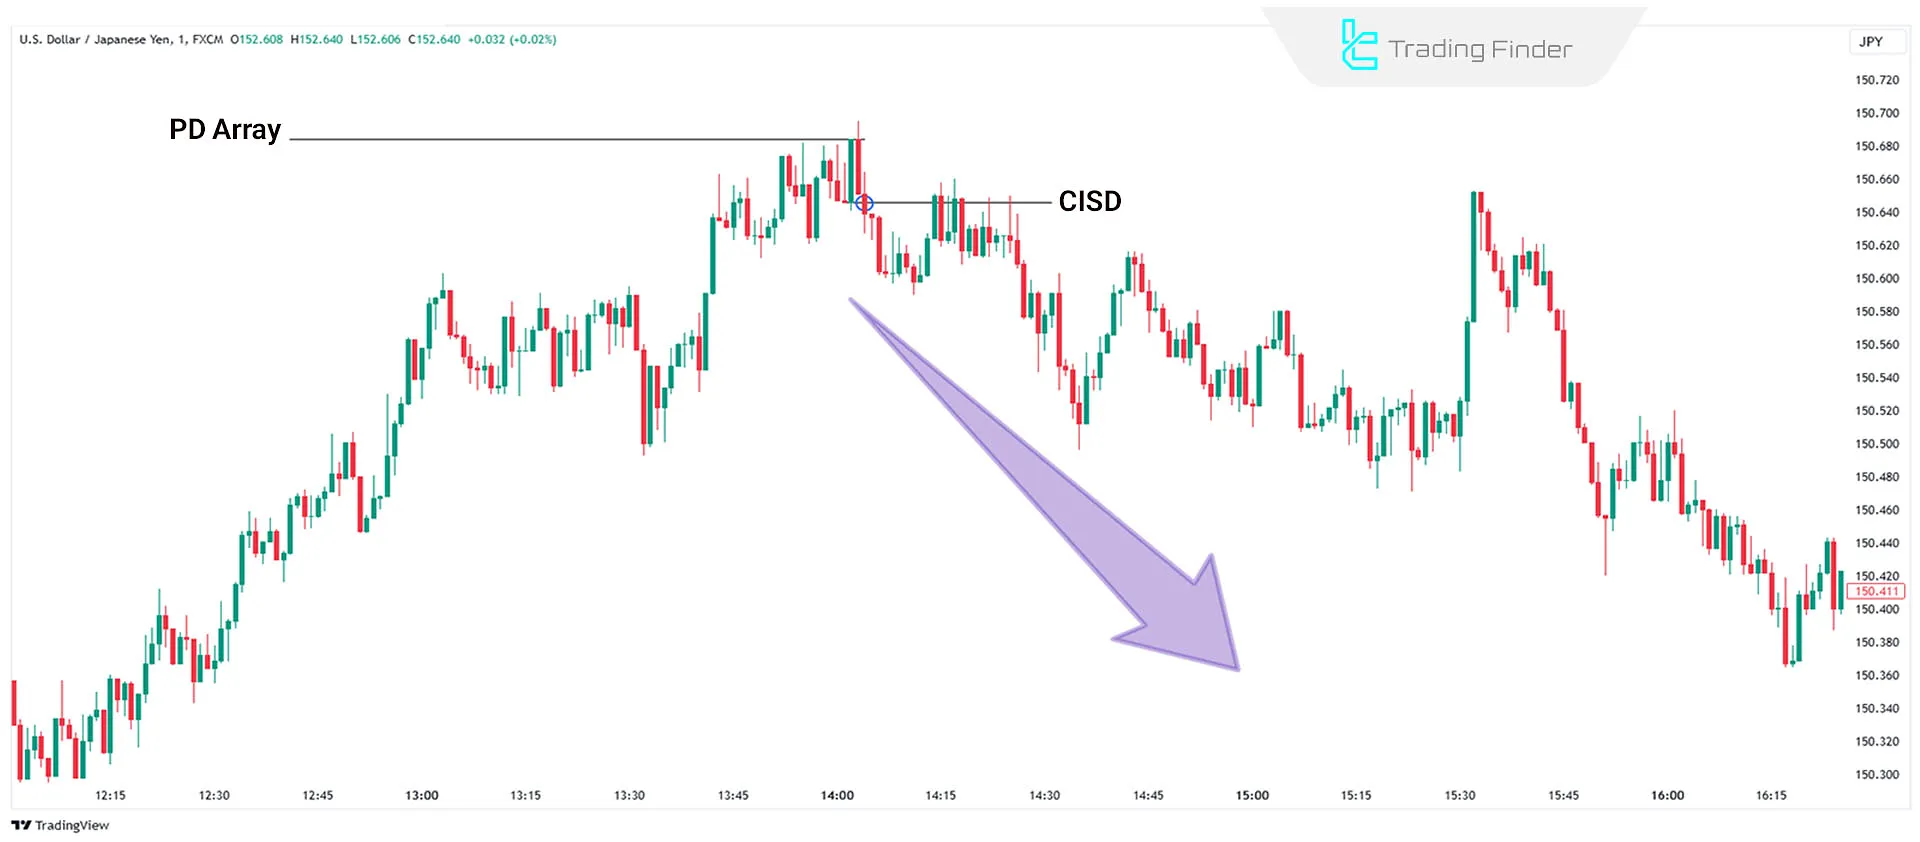
CISD in Sell Trades
This occurs when the price closes below the opening price of a bullish candlestick or series of bullish candlesticks.
It signals buyer weakness and suggests a potential bearish reversal. Traders can use tools like Order Blocks or FVGs to enter sell positions.
Conclusion
ICT CISD is an effective method for identifying price momentum and direction changes. It helps traders spot early signs of trend reversals and make better decisions for entering or exiting trades.
This method is useful for identifying entry and exit points for buy or sell positions and determining the right time to close trades.


