


Understanding daily profile trading in the London and New York sessions is a key concept in ICT trading methodology.
This concept refers to price movements occurring during specific timeframes in the London session, setting the stage for further price action in the New York session.
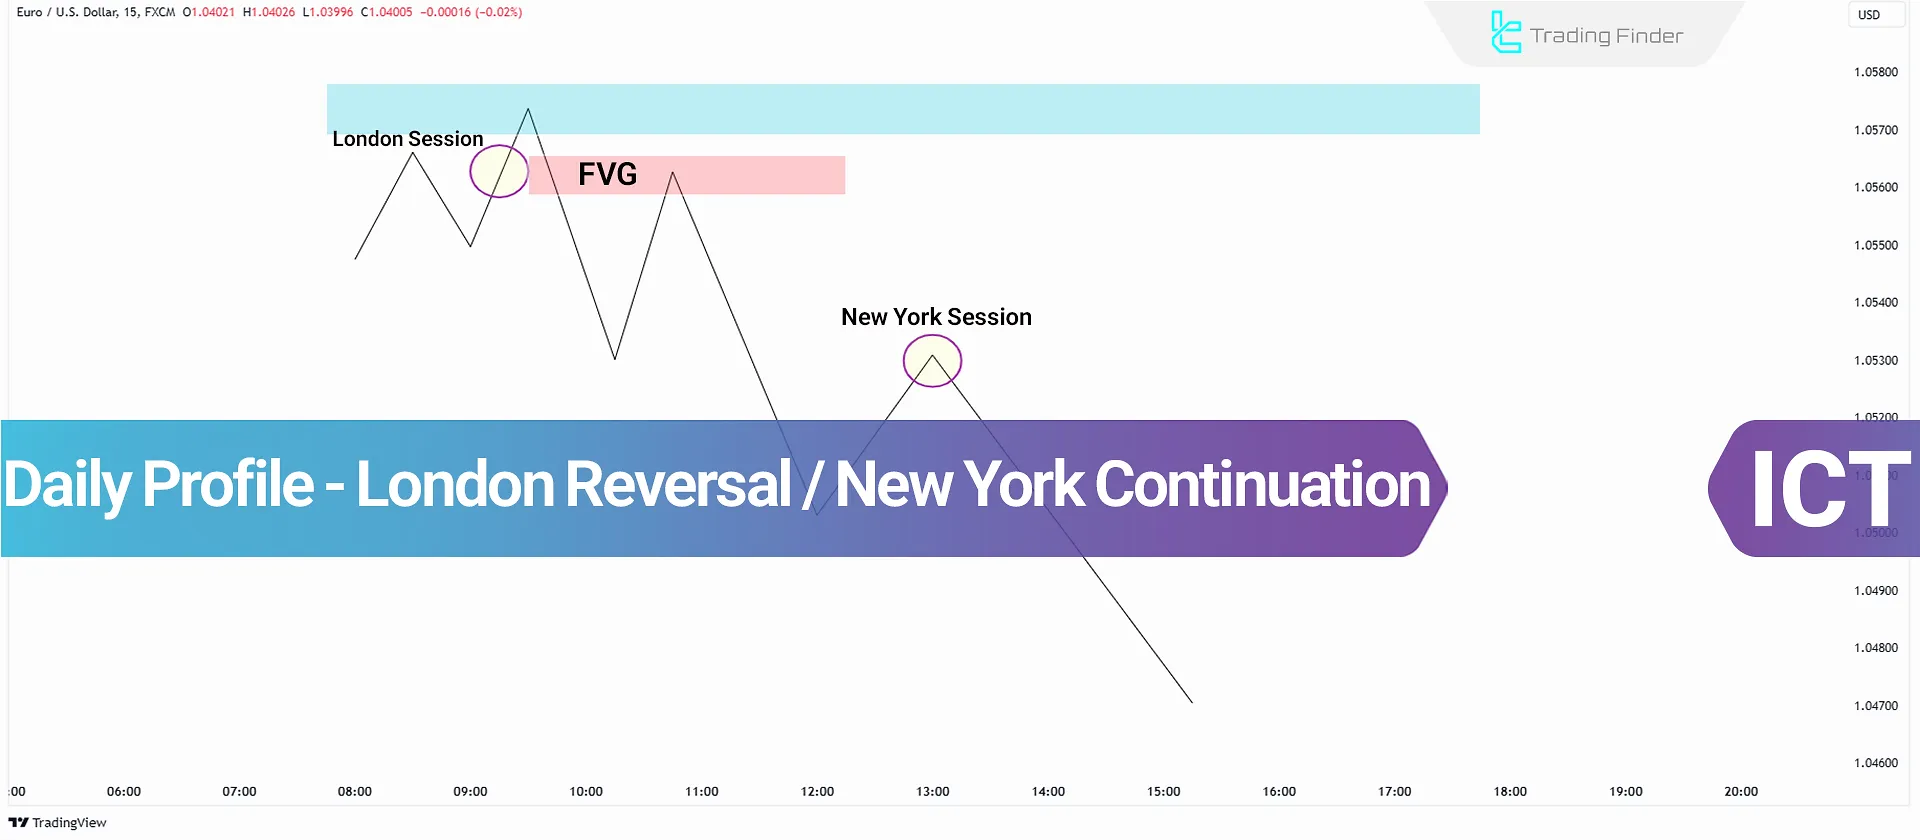 ICT-Based Strategy for the London and New York Session Daily Profile
Understanding Kill Zones and the London Session
To fully grasp the daily profile for London Session and New York trading, traders must first understand Kill Zones.
Kill Zones are specific time periods in trading sessions where significant price movements take place. The primary sessions include Asia, London, and New York.
For this analysis, we will focus on:
- London Session Kill Zone: 2:00 AM - 5:00 AM EST (Winter) | 3:00 AM - 6:00 AM EST (Summer)
- New York Session Kill Zone: 8:30 AM - 12:00 PM EST (Winter & Summer)
What is the London Reversal?
The London Reversal refers to a classic daily candlestick pattern where price expands in one direction before reversing and continuing in the opposite direction. This movement occurs in two scenarios:
Bullish London Reversal
For a Bullish Reversal in the London Session, Consider the Following Points:
- The price declines during the London session before reversing and moving higher;
- The reversal is typically confirmed with a Market Structure Shift (MSS);
- The movement continues into the New York session, completing the daily candlestick formation.
Bearish London Reversal
For a Bearish Reversal in the London Session, Consider the Following Points:
- The price rises during the London session before reversing and moving lower;
- The bearish reversal is confirmed with a market structure change and continues in the New York session.
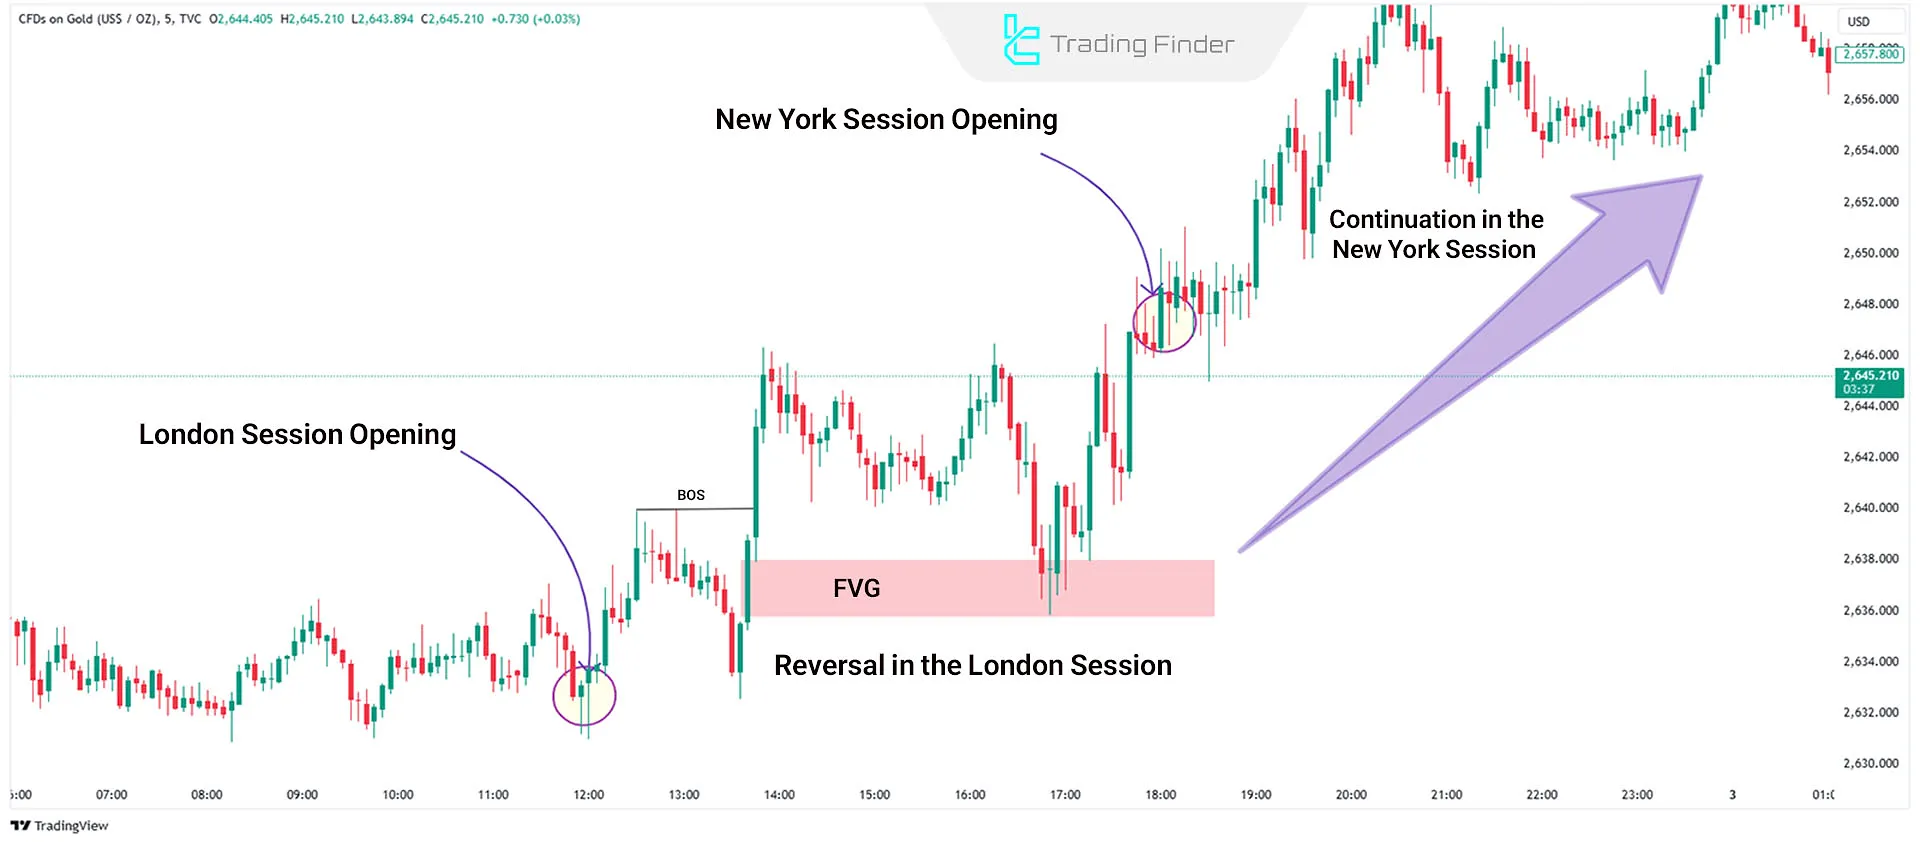
Example Bullish London Reversal
In a 5-minute XAU/USD chart, a bullish reversal pattern is observed. During the London session, the price initially declines before reversing upwards.
This movement is often accompanied by an entry into a Fair Value Gap (FVG) or an equilibrium level. The continuation of this move in the New York session targets liquidity zones.
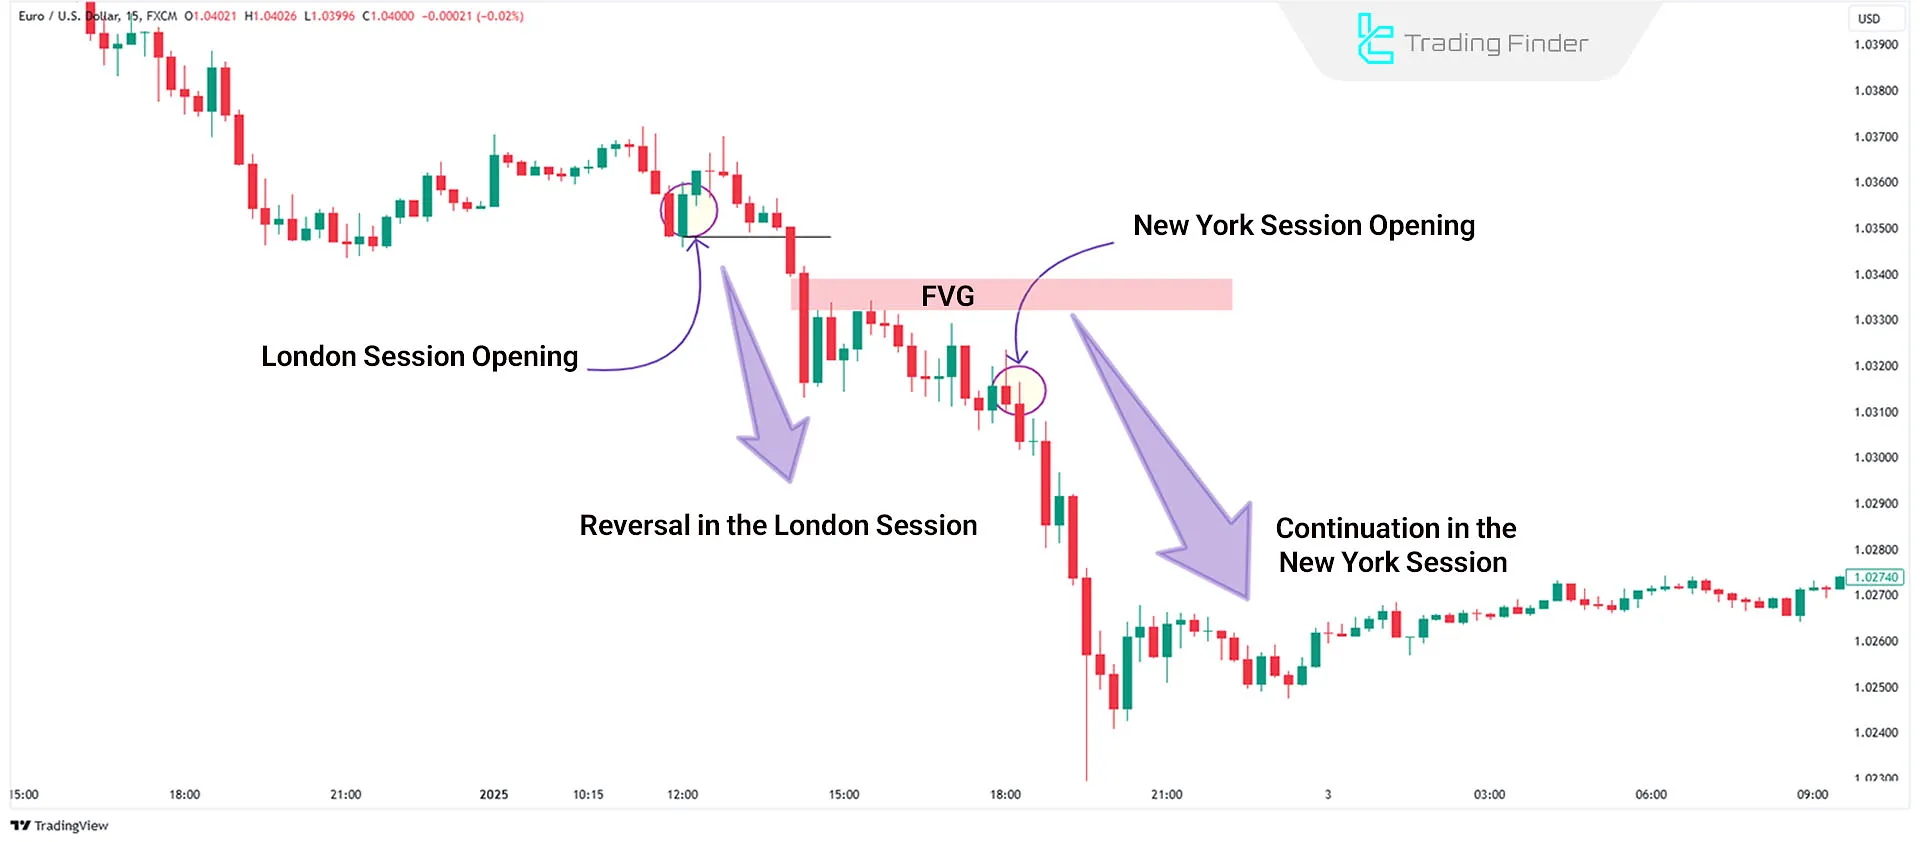
Example Bearish London Reversal
In a 15-minute EUR/USD chart, the price reaches a session high in the London session before reversing downward.
During this reversal, traders can enter sell positions as price approaches a Fair Value Gap (FVG). The move continues in the New York session, breaking previous lows.
Combining the London and New York Sessions for London Reversal
In some cases, the price reaches a key level at the end of the London session and retests the same level during the New York session before continuing towards liquidity targets.
Key Considerations for Using the London Reversal Strategy
Successful London Reversal trading relies on identifying market structure shifts, utilizing Order Blocks (OBs) for trade entries, and setting stop losses at key levels like previous day highs or lows. These factors help traders manage risk effectively and optimize their entries.
Conclusion
The daily profile for London and New York trading is a core strategy in ICT trading, helping traders identify key market movements.
The London Reversal plays a crucial role in daily candlestick formations, with its continuation into the New York session providing further trading opportunities.
By analyzing key levels such as FVGs, Order Blocks, and implementing proper risk management, traders can enhance their performance and capitalize on market movements across these sessions.


