Educational video on the daily high and low prices from the Shule ya Forex YouTube channel:
In the image below, the price of the EUR/USD currency pair is shown on the daily chart.


HOD (High of Day) and LOD (Low of Day) are fundamental concepts in technical analysis and intraday trading. They represent the peak and lowest price levels during a trading day.
These levels are crucial for traders as they provide valuable signals about market behavior and price trends.
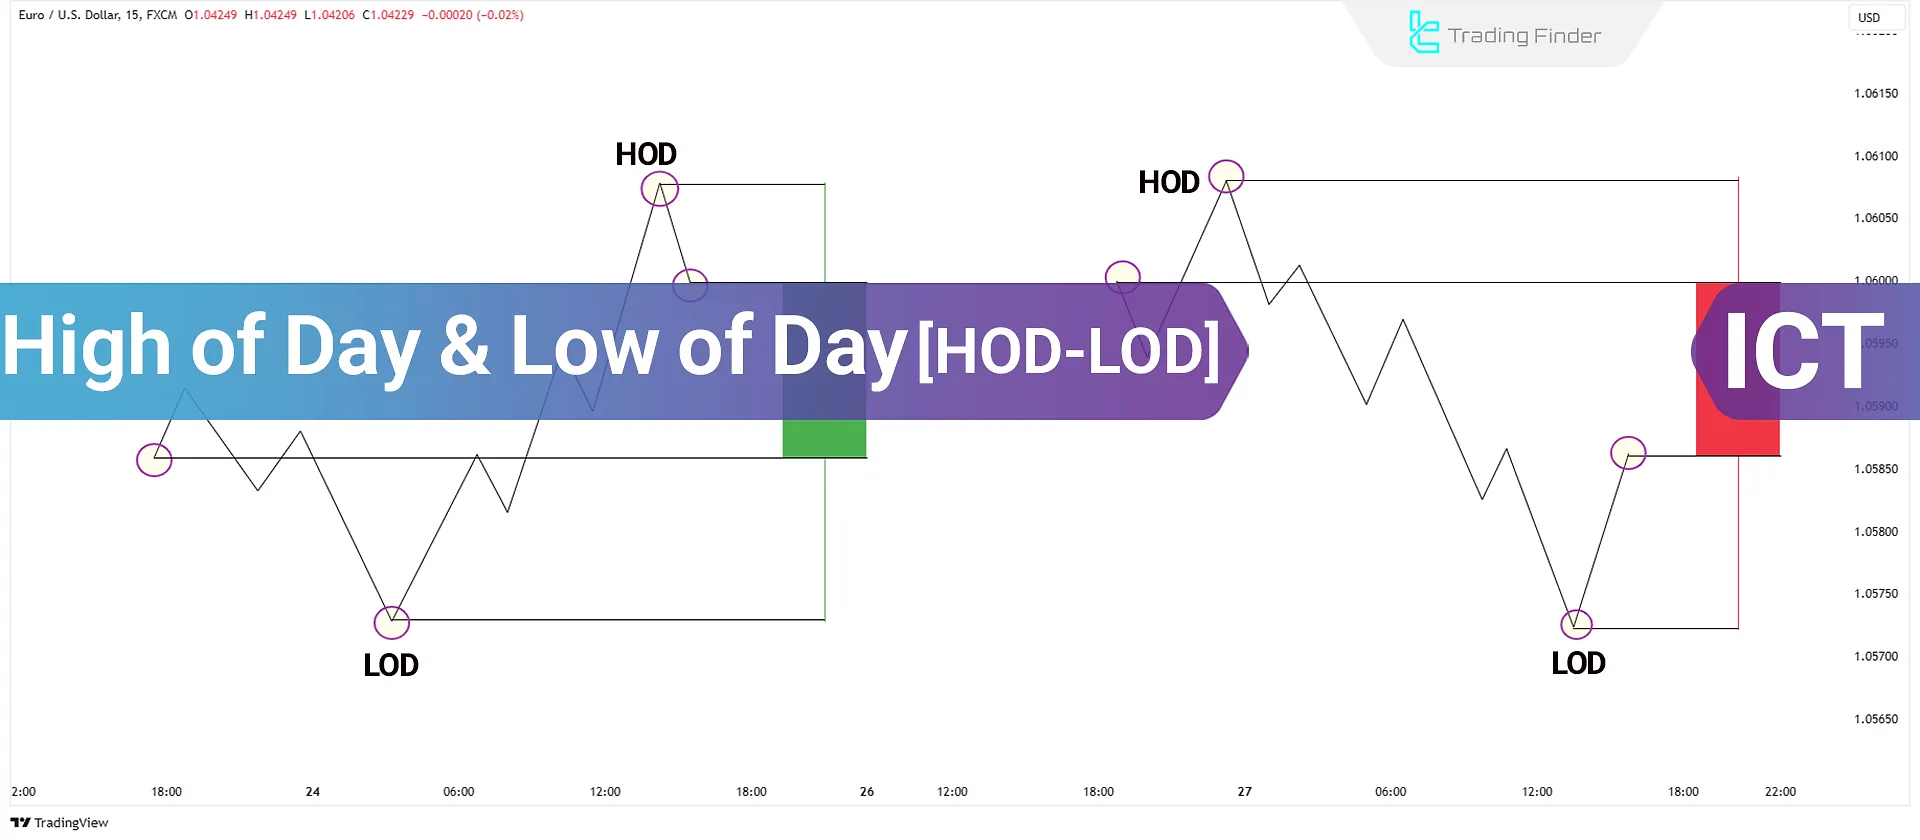
The Highest of the Day (HOD) and the Lowest of the Day (LOD) are, respectively, the maximum and minimum prices recorded for an asset during the daily trading session and are extracted directly from raw OHLC data.
Educational video on the daily high and low prices from the Shule ya Forex YouTube channel:
In the image below, the price of the EUR/USD currency pair is shown on the daily chart.
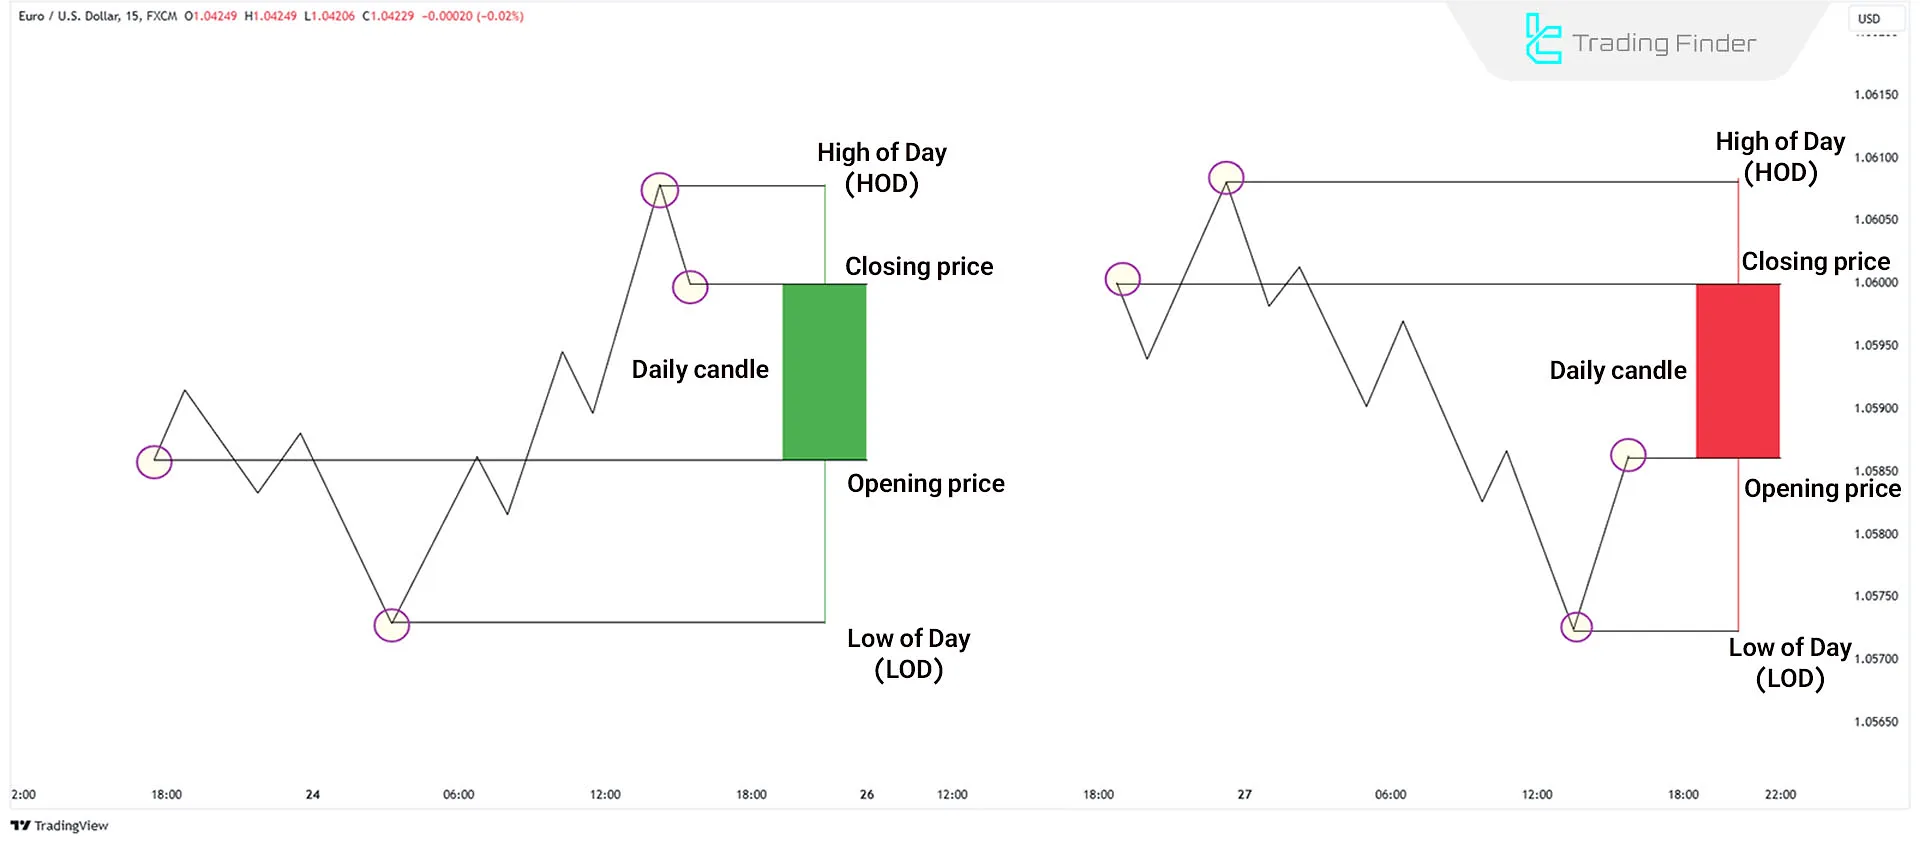
This level represents the highest price that an asset (e.g., stocks, cryptocurrencies, or commodities) reaches during a trading day. It often serves as a temporary resistance level.
Traders may consider selling in this region as prices will likely reverse from these heights.
Thelowest price that an asset records during a trading day is the Low of Day (LOD). It can act as a temporary support level and often provides buying opportunities, as prices tend to rebound from this point.
The applications of HOD and LOD become meaningful when a trader intends to model price behavior on the daily scale with high precision.
These two levels define the main framework of daily volatility and determine the range in which price has experienced the greatest buying and selling pressure.
Since any change in HOD or LOD is the result of the direct interaction between order flow and real-time liquidity, analyzing them provides precise information about daily structure, the quality of breakouts liquidity distribution, and optimal risk thresholds.
Types of applications of HOD and LOD:
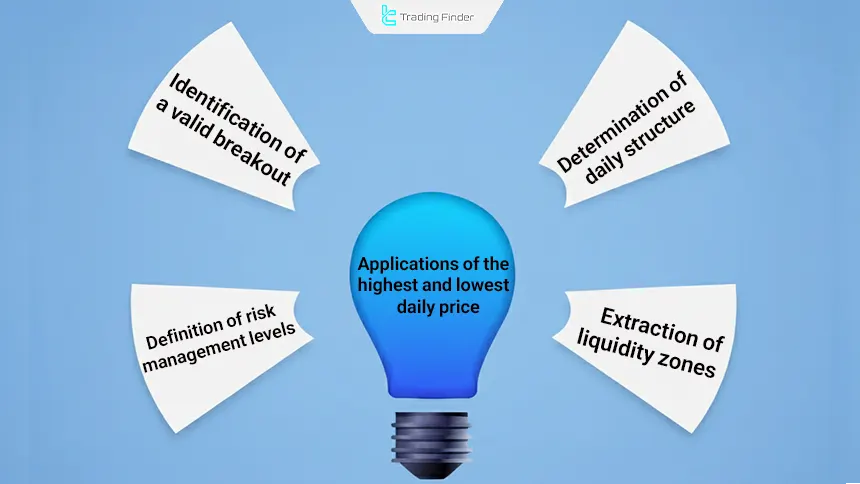
By examining the distance between HOD and LOD and the pattern of rallies and pullbacks, the type of day can be identified.
trending days are observed with a wide range and a sequence of aligned highs and lows, while balanced days exhibit narrow fluctuations and frequent reversals. Identifying the day type makes it possible to choose an appropriate strategy.
A breakout above HOD or below LOD is considered valid when it is accompanied by an increase in volume or tick rate, a reduction in opposing orders in the order book, and the absence of a rapid price retracement.
In this case, the level breakout indicates a real shift in the supply and demand balance and is used for more precise entries.
Because HOD and LOD are areas where stop orders accumulate, when price moves rapidly through these levels it typically absorbs stop orders and then retraces due to liquidity depletion. Confirmation of this retracement identifies a suitable zone for a reversal entry.
After this retracement, observing structural signals such as a change of character or BOS can increase the validity of the entry zone.
These two levels are considered points of invalidation for the analysis, and the distance of the position to them determines position size and stop-loss placement.
The stop loss is usually placed outside the level so that short-term noise does not trigger an exit. The width of the daily range also dynamically affects risk exposure and position sizing.
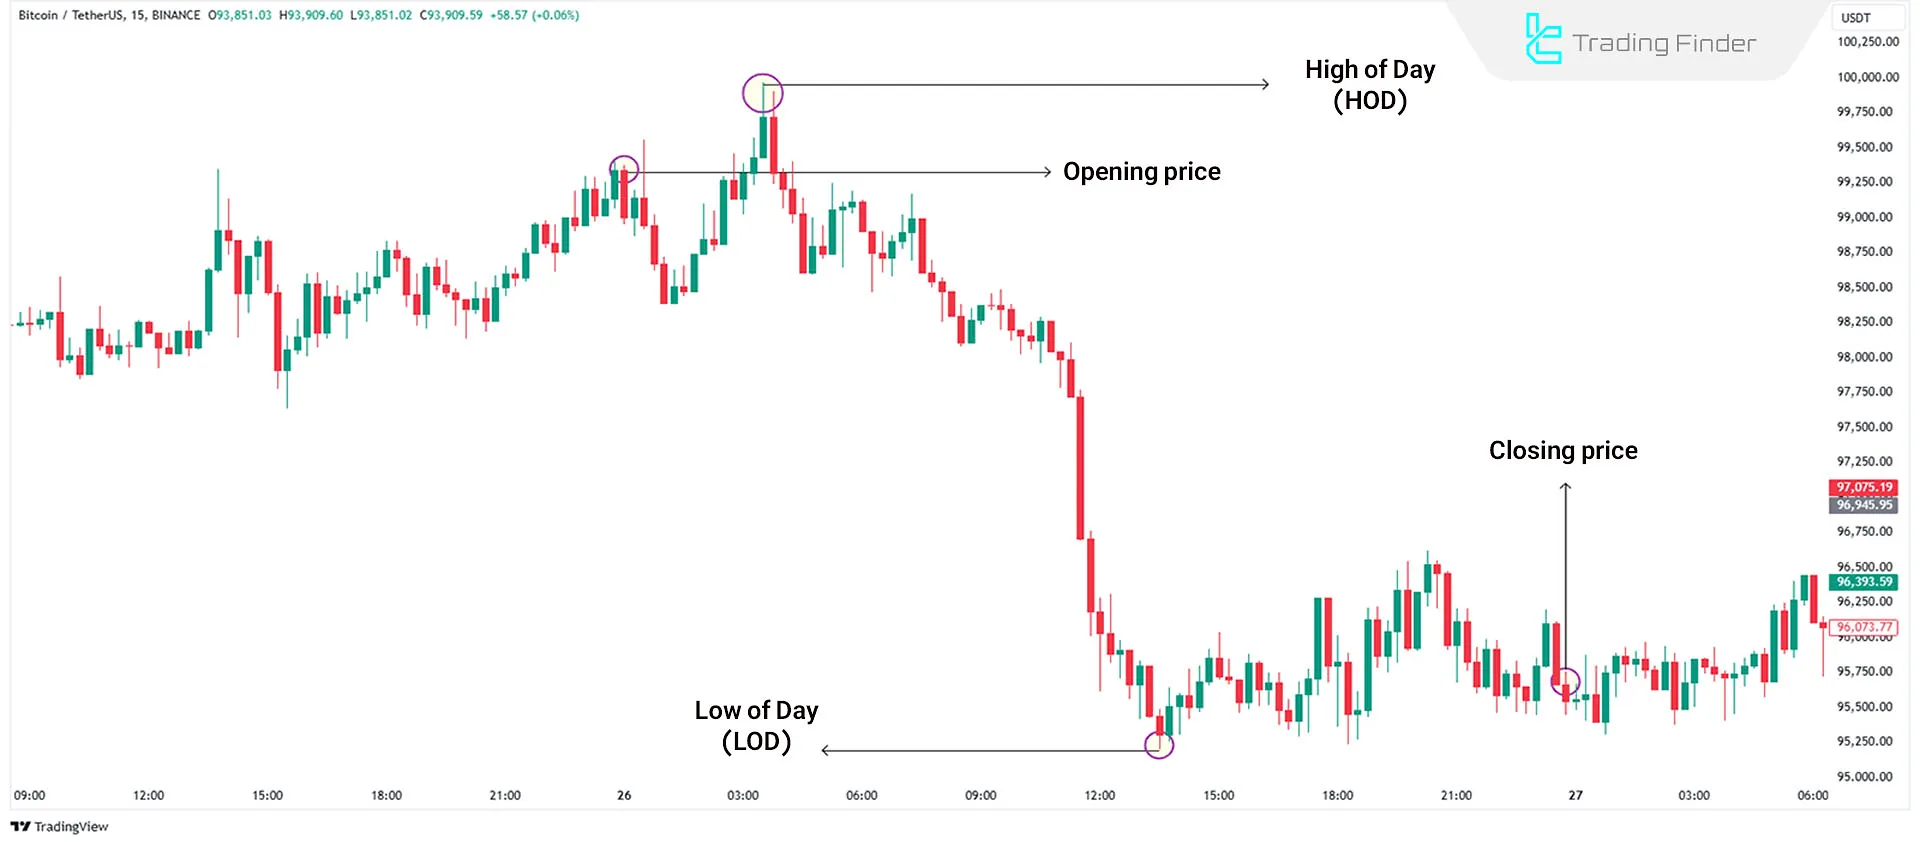
The Bitcoin (BTC) chart for a trading day shows an opening price of 99,325. The highest price recorded during the session is 99,952, representing the High of Day (HOD).
Conversely, the price dropped to 99,191, indicating the Low of the Day (LOD). The session closed at 95,670.
Previous day, previous week, and previous month levels become meaningful when a trader intends to analyze price behavior across multiple timeframes simultaneously.
Comparing HOD/LOD with these levels shows which price boundaries have absorbed more liquidity and therefore carry greater analytical weight within order flow.
Comparison table of HOD/LOD with previous day, previous week, and previous month levels:
Comparison Period | Level Characteristics | Reason for Importance | Analytical Application |
Previous Day High/Low | Short-term reactive level; close to current price | Accumulation of short-term pending orders; strong market memory on lower timeframes | Identifying daily breakouts; defining the intraday range; quick reference for risk management |
Previous Week High/Low | Medium-term level with lower sensitivity to daily noise | Concentration of institutional liquidity; higher energy in weekly breakouts | Identifying trend phase changes; validating multi-day breakouts |
Previous Month High/Low | Stable macro level; slow-changing but influential | Presence of institutional orders; correlation with large capital flows | Defining the main trend boundary; building swing strategies; valid reversal zones |
Why some levels are more important | - | Importance proportional to accumulated liquidity, number of historical touches, and timeframe confluence | Higher reactivity and greater probability of valid breakouts at multi-timeframe levels |
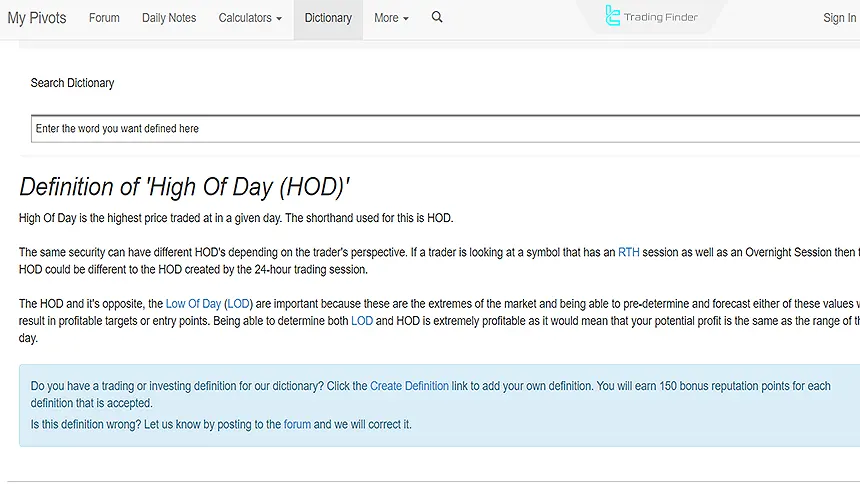
The limitations and risks of HOD/LOD become apparent when a trader expects these two levels alone to provide a complete picture of market behavior. Educational material on the highest daily price from the My Pivots website:
Although these levels are important reference points, they only show the final outcome of daily volatility and do not describe the details of the price path. Types of challenges and limitations of HOD and LOD:
HOD/LOD only show the final result of the day’s volatility and do not provide information about how volume was distributed, how liquidity shifted, or how orders behaved along the path toward these levels.
Without observing order flow or market depth, analysis based on these levels may conceal the true nature of the move.
As a result, relying solely on these levels can lead to an incomplete market interpretation, with decisions based on the consequences of price movement rather than an understanding of the actual order flow.
These levels are constructed based on daily data and therefore lack sufficient sensitivity to structural changes on higher or lower timeframes.
In some cases, the weekly or monthly trend moves in the opposite direction, and price reactions to HOD/LOD represent only short-term corrective moves.
In such situations, using multi-timeframe analysis to align these levels with the broader market structure is essential to avoid entries against the primary trend.
Highly volatile or low-liquidity markets may break HOD/LOD levels multiple times with fast price movements, while these breaks lack meaningful volume or liquidity backing.
This increases the likelihood of false entries or premature exits and makes exclusive reliance on HOD/LOD risky.
HOD/LOD record only the price “location”, not the “driver” behind it. Movement toward these levels may be caused by news, institutional money flow, short term manipulation, or even liquidity shortages.
The absence of fundamental data and capital flow information leaves the analysis incomplete.
Therefore, to understand the true cause of price movement, these levels must be combined with complementary information such as news timing, smart money behavior, and order flow signals.
The previous high and low indicator operates based on raw price data and, by extracting High and Low points over specified time intervals, provides an organized structure of reactive market levels.
These levels, similar to the logic of HOD and LOD, directly reflect actual price behavior and show where the market has experienced the strongest buying or selling pressure.
The difference from analyzing HOD/LOD alone is that the indicator aggregates these points not only for the current day but also for past periods and plots them as stable or dynamic horizontal lines on the chart.
This enables multi timeframe analysis and comparison of price behavior across different periods. Educational videos on using the previous high and low indicator:
Because these levels are derived from actual highs and lows, they are highly effective at displaying support and resistance zones.
A price reaction at a previous high can signal weakening buying pressure and a potential reversal, while a valid breakout of the same level is considered a reinforcement of the bullish trend.
In a downtrend, a price move below a previous low similar to a LOD break-signals continued selling pressure and confirmation of bearish structure. If price returns to the broken level and that level acts as new support or resistance, it provides a precise entry zone.
The key advantage of this indicator lies in extracting the structure of highs and lows from real price fluctuations and allowing full customization through settings such as zigzag period, lookback limitation, line thickness, and label display.
This flexibility enables traders to adjust the tool’s sensitivity according to market conditions or their trading style, especially when more precise identification of highs and lows is required.
Overall, the previous high and low indicator can be considered an extended version of the HOD and LOD concept.
It preserves the same logic of identifying the highest and lowest price points but generalizes it across multiple timeframes and converts these points into reactive levels, providing a precise framework for trend identification, entry and exit zones, and evaluation of breakout validity.
Download links for the previous high and low indicator:
The Highest of the Day (HOD) and Lowest of the Day (LOD) are useful concepts for identifying temporary resistance and support levels in the market. By using these levels, strategies such as Break of Structure (BOS) or price reversal can be designed.
However, to effectively use these concepts, it is essential to combine them with other technical analysis tools and risk management strategies
Quiz
5 Questions
Q1: What does HOD represent in trading terminology?
Q2: How do traders typically view the Low of Day (LOD) level?
Q3: In the Bitcoin example provided, what was the High of Day (HOD) price?
Q4: What trading strategy might traders consider when price reaches the HOD level?
Q5: What is essential for effectively using HOD and LOD concepts in trading?
These levels help identify key market zones, aiding in trading decisions such as entries, exits, stop-loss, and take-profit levels.
Yes, these concepts are relevant across all financial markets, including stocks, cryptocurrencies, forex, and commodities.
No; these two levels are updated in real time with every price tick. As long as the market is open, any new value that exceeds the current record high or low replaces the previous one. Therefore, HOD/LOD are dynamic outcomes, not merely end-of-day figures.
The stability or breakout of these levels is highly dependent on real time volume. Breakouts accompanied by increasing volume are more likely to be valid. In contrast, low-volume breaches are often noisy and tend to result in quick price reversals.
If price consistently moves toward one of these two levels and stabilizes near it, the likelihood of a trending day increases.
However, if price repeatedly oscillates between them, the market is more likely in a balanced or ranging state. Price orientation relative to these levels is a key criterion in intraday structure.
When liquidity at the level is low or large orders are positioned behind price, the market can pass through the level without hesitation. In such cases, the level lacks support or resistance strength, and the move is driven more by institutional or short-term order flow.
Using lower timeframes such as 1-minute charts or tick data provides greater precision in rapidly recording the daily high and low. The higher the data resolution, the faster reactions are captured. However, the level of noise also increases.
Yes; these levels are natural points of analysis invalidation. Placing a stop loss slightly beyond these levels helps reduce false exits. The distance between the position and HOD/LOD is also a criterion for adjusting position size.
No; a breakout may simply be a liquidity sweep. If the market reverses immediately after the break, the breakout is not valid. Volume and behavioral confirmations are required for the move to be considered sustainable.
No; these levels only show the final points of price fluctuation. For a complete analysis, they must be evaluated alongside order flow, volume, market structure, and higher timeframes. Using them in isolation leads to incomplete signals.


