


High-resistance liquidity run (HRLR) and low-resistance liquidity run (LRLR) are two technical concepts; These can be used to analyze the strength of price movements and the likelihood of trend continuation or reversal.
These two patterns show how much resistance price experiences when moving through different liquidity zones and the quality of order execution.
Understanding the difference between HRLR and LRLR allows the trader to determine whether the market is absorbing liquidity for trend continuation or whether only a shallow and temporary breakout has formed.

What is Liquidity in Trading?
Liquidity refers to the availability of buyers and sellers ready to trade at the current price. This ICT concept relates to a specific asset that can be easily bought or sold while maintaining relative price stability.
Price generally move toward areas with high liquidity to absorb it; therefore, traders need to be aware of liquidity zones to capitalize on them.
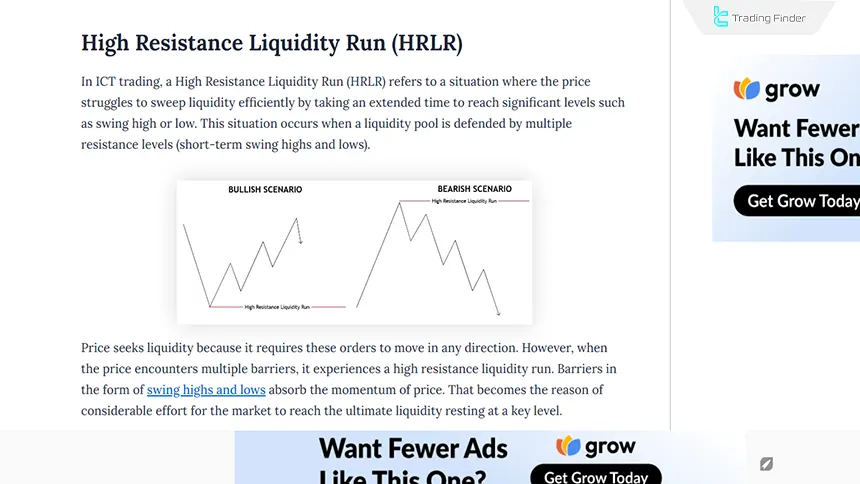
What is High-Resistance Liquidity Run (HRLR)?
A High-Resistance Liquidity Run (HRLR) occurs when the price faces numerous resistances (e.g., intermediate highs and lows, Order Blocks & PD Arrays) to reach anold high or low.
These movements are typically slow and time-consuming, often driven by significant economic news.
HRLR usage tutorial from the Writo-Finance website:
Characteristics of HRLR
HRLR describes a specific market condition that reflects the interaction between price behavior and institutional activity. Understanding its characteristics helps traders better identify potential shifts in momentum or emerging reversal zones.
- Slow price movement;
- High trading volume at key levels;
- Potential indication of a trend reversal or a slowdown in trend momentum.
Bullish Example of High-Resistance Liquidity Run (HRLR)
The "USD/JPY" 2-hour chart demonstrates a bullish HRLR.In this example, the price approaches a key support level, and upon breaking this level, Sell Stop orders are triggered. After these orders activate, the price rapidly rises, creating an opportunity for a Buy trade at the reversal point.

Bearish Example of High-Resistance Liquidity Run (HRLR)
The “USOIL” 15-minute chart shows a bearish HRLR. Here, the price approaches a key resistance level, and upon breaking this level, Buy-stop orders are triggered.
After activation, the price decreases, presenting a favorable Sell trade opportunity at the reversal point.

What is a Low-Resistance Liquidity Run (LRLR)?
A Low-Resistance Liquidity Run (LRLR) happens when the price moves smoothly through liquidity zones without significant resistance.
These movements often create Liquidity Voids or Fair Value Gaps (FVGs).
- In a downtrend, the price forms short-term lows and effortlessly sweeps sell-side liquidity below them;
- In an uptrend, the price forms short-term highs and easily clears buy-side liquidity above them.
Educational video on using strong and weak resistance liquidity from the TTrades YouTube channel:
Characteristics of LRLR
LRLR represents a market condition where price moves decisively with the dominant order flow. Recognizing these characteristics helps traders confirm trend strength and continuation as price efficiently moves through liquidity zones.
- Rapid price movement through liquidity zones;
- Lower volume compared to HRLR;
- Confirmation of the prevailing market trend.

Bullish Example of Low-Resistance Liquidity Run (LRLR)
When executing a bullish trade using LRLR [such as on Bitcoin chart], the process includes:
- Identifying liquidity around a key support level;
- Waiting for the support level to break and trigger sell orders;
- Observing price rebound upwards with reversal signals;
- Entering a Buy trade upon confirmation of the reversal.

Bearish Example of Low-Resistance Liquidity Run (LRLR)
When executing a bearish trade using LRLR [such as on a “EUR/USD” chart], the process includes:
- Identifying liquidity around a key support level;
- Waiting for the support level to break and trigger buy orders;
- Observing price drops with reversal signals;
- Entering a Sell trade upon confirmation of the reversal.

HRLR vs. LRLR
For a more precise comparison between HRLR and LRLR, the table below presents the structural and behavioral differences of these two types of liquidity execution in short and clear terms.
This comparison helps better understand the nature of each pattern and the quality of price movement in each case. HRLR vs. LRLR comparison table:
Feature | HRLR (High Resistance) | LRLR (Low Resistance) |
Price path structure | High-resistance path, multiple highs and lows | Smooth path, low noise, no major obstacles |
Price movement speed | Slow and step-by-step movement | Fast and continuous movement |
Target liquidity type | Deep and old liquidity | Shallow and nearby liquidity |
Trading volume | High volume at key zones | Moderate or low volume |
Probability of false breakout | Higher probability | Lower probability |
Market behavioral signal | Trend weakness or potential reversal | Confirmation of the dominant trend |
Type of activated orders | Activation of large stop orders | Activation of retail liquidity |
Trade setup quality | Precise but later entry | Fast, trend-following setup |
Risk of adverse movement | Higher risk | Lower risk |
Need for further confirmation | Requires HTF and volume analysis | Less need for confirmation |
HRLR and LRLR Strong and Weak Resistance Indicator
The HRLR and LRLR indicator is a specialized tool for analyzing price behavior based on liquidity structure in the ICT style. This indicator is designed to identify zones to which price tends to return in order to collect liquidity.
In the HRLR state, the indicator identifies the lowest valid low a low that is usually accompanied by liquidity absorption. From this point, price begins a new bullish move and, by forming a series of higher lows and higher highs, provides a signal of the start of a strong bullish trend.
Educational video on using the HRLR and LRLR indicator:
The indicator tracks this trend as long as the price structure continues without a significant break of medium-term lows. Whenever one of the short-term lows is broken, the indicator quickly identifies a new low and recalibrates the trend analysis accordingly.
On the other hand, LRLR displays price movement when the market advances toward liquidity above short-term highs without encountering major resistance and with a smooth structure.
In this case, price forms higher lows and breaks small highs, creating an orderly and low-pressure trend one that is usually sustained and targets shallower liquidity zones. This pattern often indicates trend strength and sufficient room for continuation.
In bullish trends, the indicator helps the trader identify suitable entry zones in situations where price shows strong reversal patterns after liquidity has been taken. These signals may include pin bars, strong bullish candles, or breaks of short-term structures.
In bearish trends as well, the indicator shows price weakness in forming new highs and the beginning of a corrective or bearish move. This situation usually occurs after liquidity is taken and price fails to create a sustainable bullish structure.
In addition to displaying the liquidity path, this indicator is also useful for identifying profit targets. LRLR zones are usually reached faster and with less pressure, whereas in HRLR zones, reaching targets takes more time and sometimes requires the occurrence of major fundamental events.
Overall, this tool provides a precise view of structural price behavior and is highly efficient for liquidity-style analysts. Indicator download links for strong and weak resistance liquidity:
Why Is Low-Resistance Liquidity More Important Than High-Resistance Liquidity?
Low-resistance liquidity is more attractive to traders due to the higher probability of price expansion, faster reactions, and greater clarity in analysis.
These zones usually contain more untouched liquidity and are easier to break, whereas high-resistance liquidity moves with difficulty and offers fewer trading opportunities.
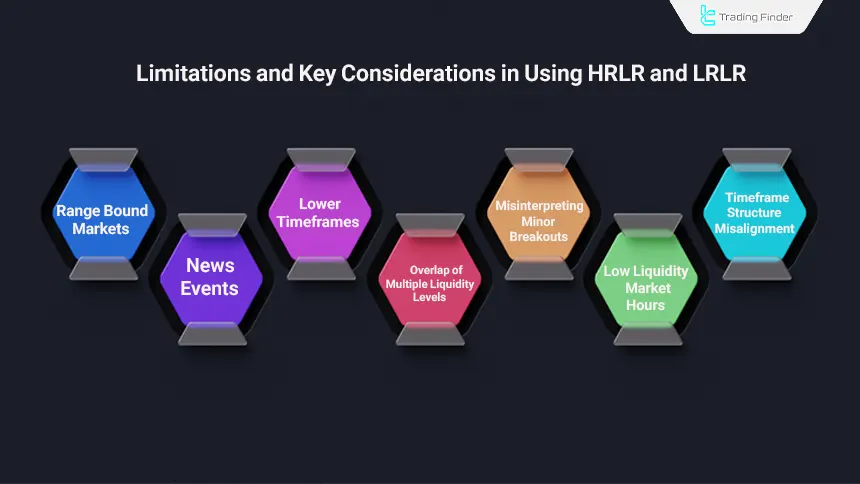
Limitations and Key Considerations in Using HRLR and LRLR
Although HRLR and LRLR movements are effective in identifying liquidity paths and market behavior, they lose effectiveness under certain conditions.
Understanding these limitations prevents trading errors and emotional entries. Types of limitations and challenges in using HRLR and LRLR:
Range-Bound Markets (Ranging Structures)
In ranging structures, balance between order flows prevents the formation of valid liquidity execution. Liquidity becomes trapped between the range high and low, and breakouts usually function as stop executions.
The price path lacks clarity, and repeated breakouts generate false signals. In such conditions, HRLR and LRLR are not reliable, and they should only be trusted in markets with a clear direction.
News Events and Macroeconomic Data
During the release of data such as NFP, CPI, or FOMC, the relationship between volume and price becomes distorted. Rapid reactions hide intermediate resistance levels, and sudden volume removes HRLR or LRLR structures from analytical validity.
Breakouts at these moments are more the result of news shock than liquidity execution. After data releases, redefining market bias is necessary, as prior movements are no longer a reliable basis for decision-making.
Very Small Timeframes and Increased Price Noise
On 1- to 3-minute timeframes, the presence of small lots and scalping algorithms increases noise, and breakouts occur without structural logic. Strong and weak resistance liquidity movements are based on macro liquidity flow; therefore, their behavior weakens on such timeframes.
Identifying the true path becomes difficult, and repeated breakouts mislead the trader. Using higher timeframes improves signal quality.
Overlap of Multiple Liquidity Levels Along One Price Path
When multiple liquidity zones are positioned consecutively, determining the price target becomes difficult. Price may clear only the first level and then reverse, while the trader expects continuation toward the next level.
Identifying which level the market is targeting is not possible without precise higher-timeframe context analysis. Combining HRLR and LRLR with tools such as PD Arrays reduces analytical error.
Misinterpreting Minor Breakouts (Minor Sweeps) as Real Liquidity Execution
In many cases, the first small breakout is only a preliminary stage of the liquidity process, not a full HRLR or LRLR. These breakouts are usually carried out to access small order blocks or collect limited liquidity.
The main move begins when the three common liquidity phases (sweep, break, and repricing) are fully formed. Misidentifying a minor breakout leads to premature entries.
Low-Liquidity Market Hours and Inefficient Order Flow
During times such as the Asian session, late New York, or bank holidays, effective market volume decreases. This volume reduction limits directional movement and causes breakouts to lose validity.
Price behavior during these periods is usually slow, inconsistent, and lacking systematic liquidity structure. Many liquidity executions during these hours result from limited activity by small market participants rather than institutional movement.
Timeframe Structure Misalignment
If the higher-timeframe structure direction conflicts with HRLR or LRLR on a lower timeframe, the resulting move is usually considered a simple correction.
Small breakouts in this case are part of a corrective structure, and after a short displacement, the market returns to the primary higher-timeframe path. To avoid misanalysis, defining the higher-timeframe bias before examining lower-timeframe structures is essential.
Conclusion
HRLR and LRLR can be used to define profit targets. Traders typically prefer simple, quick, and hassle-free setups, which LRLR embodies. These zones are more likely to succeed due to their ease of liquidity absorption.
In contrast, reaching HRLR zones, such as an old high or low, usually takes more time and may require major events like the NFP report or FOMC meetings to push prices to these levels.


