


Analyzing ICT time levels, such as market openings, major news releases, and candlestick formations, is crucial in predicting price movements. These time levels help identify key market points.
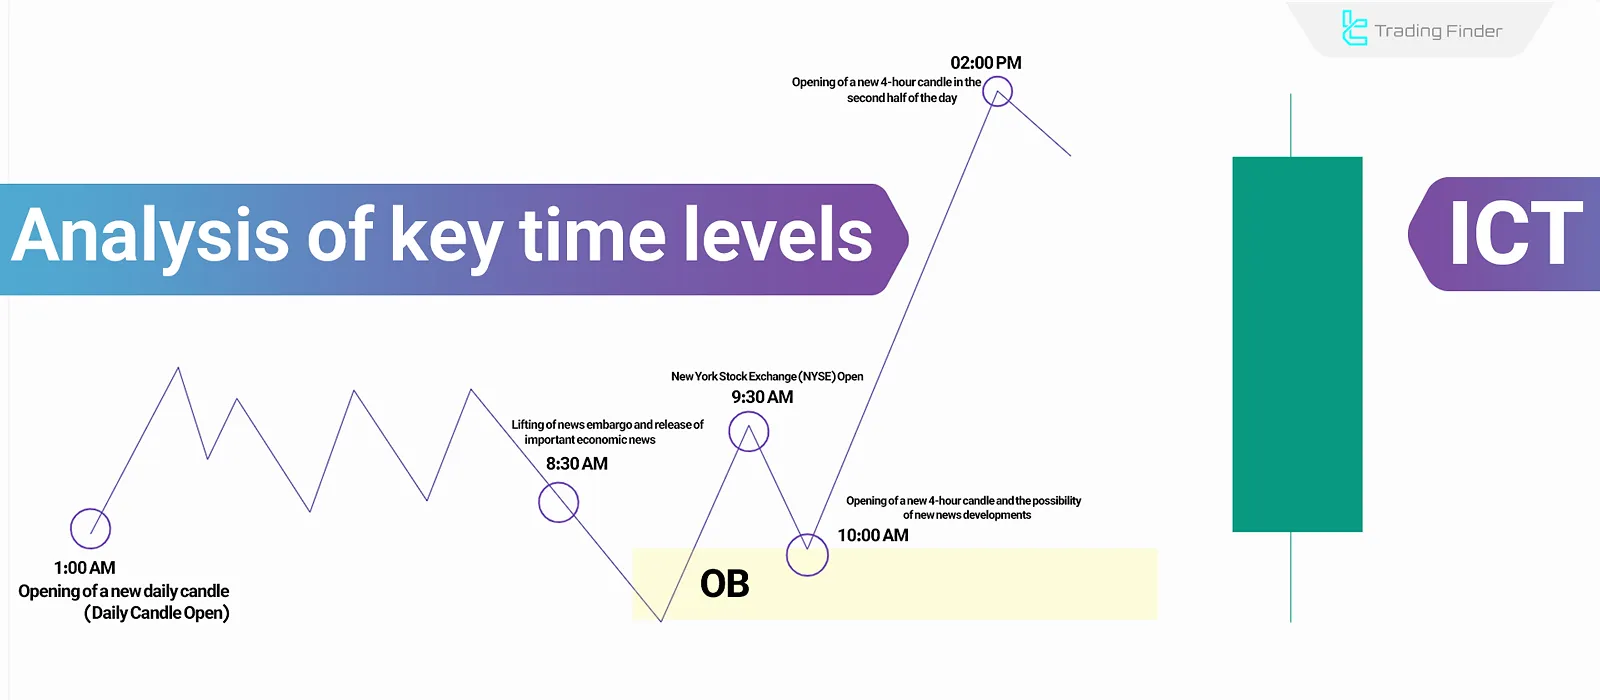
The key ICT time levels include the daily candle open (01:00 AM), news releases (08:30 AM), New York Stock Exchange (NYSE) open (09:30 AM), and the formation of 4-hour candles (10:00 AM & 2:00 PM), which are used in technical analysis.
Key ICT Time Levels
In ICT trading, specific time levels are used for market analysis. These points are determined based on different time frames and significant market events. Key ICT Time Levels:
Time (EST) | Significance |
01:00 AM | Opening of the new daily candle (Daily Candle Open) |
08:30 AM | Lifting of the news embargo (News Embargo) and release of major economic news |
09:30 AM | New York Stock Exchange (NYSE) open |
10:00 AM | Opening of a new 4-hour candle and possibility of new news developments |
02:00 PM | Opening of a new 4-hour candle in the second half of the day |
Traders use ICT time levels to analyze liquidity and price trend changes. These time levels serve different purposes, which are discussed below.
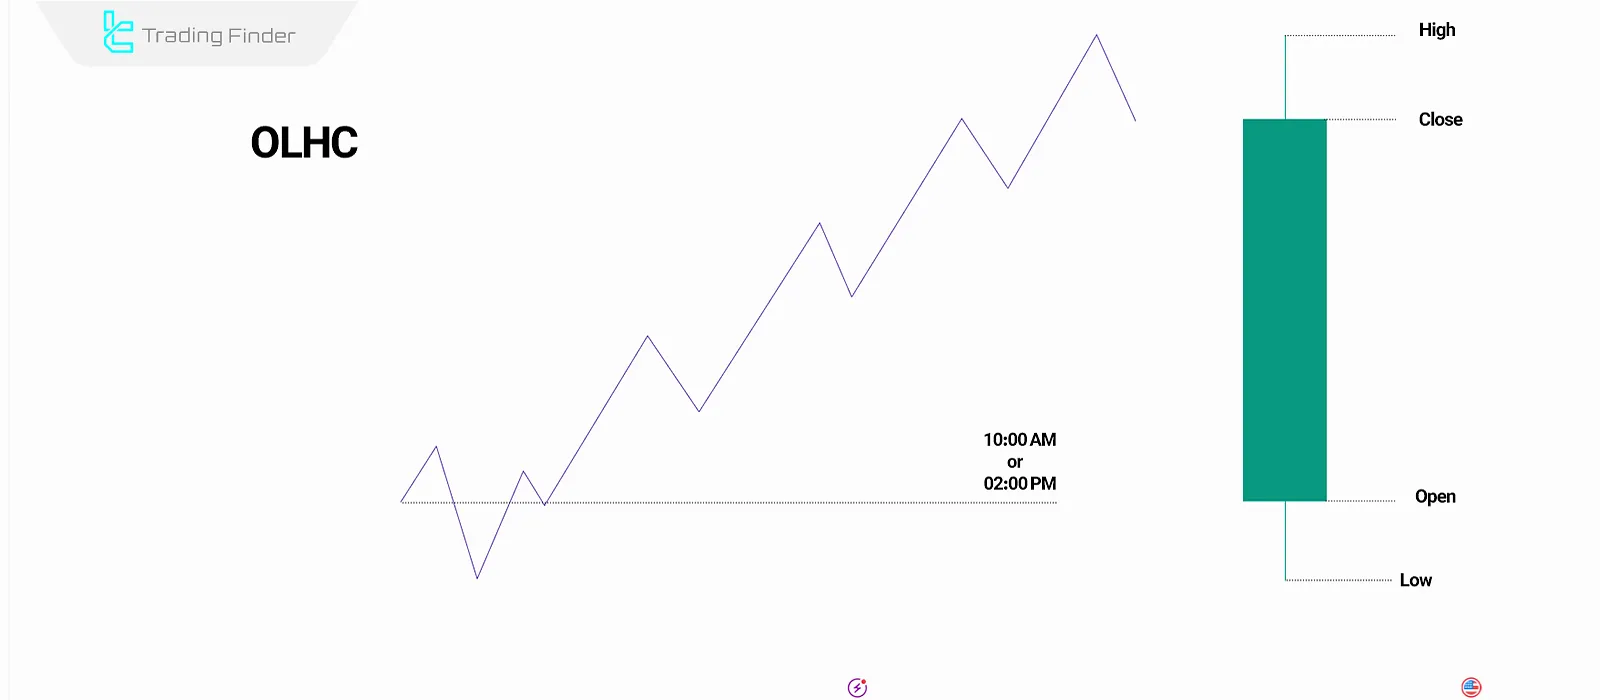
Using Time Levels to Analyze Bullish and Bearish Candles (OLHC & OHLC)
The 1:00 AM, 12:00 AM, 10:00 AM, and 2:00 PM time levels are highly important for analyzing daily and 4-hour candles. By examining OLHC and OHLC structures—identifying the open, high, low, and close at these times—traders can assess potential trend reversals.
- If the price rises at midnight open (12:00 AM) but the trend is bearish, this level is considered a Premium zone, typically followed by a price decline;
- If the price remains below both opening levels, it is regarded as a Discount zone, which suggests a higher probability of a price increase.
The Role of Midnight Open and 8:30 AM in Support and Resistance
The Midnight Open and 8:30 AM levels often act as support and resistance. If the price moves upward near these levels, they can be considered as support.
Conversely, if the price fails to break above these levels and moves downward, it can act as strong resistance.
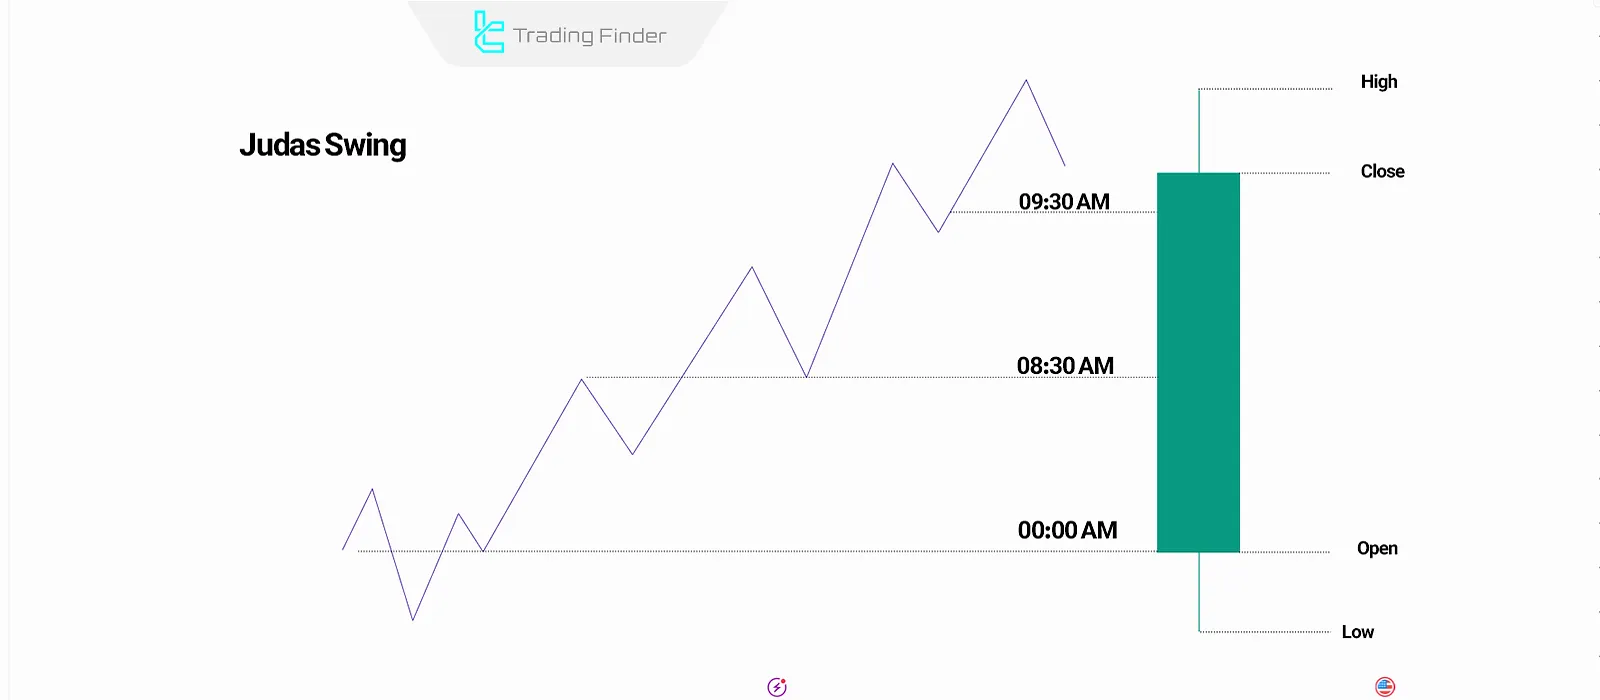
Price movements around 8:30 AM and the Midnight Open often result in Judas Swings or fake moves, which are intended to trap liquidity and reverse market direction.
Using Judas Swing and Order Blocks at Key Time Levels
The Midnight Open, 8:30 AM, and 9:30 AM are often accompanied by Judas Swing movements or Order Block formations, which help in identifying potential trend reversals.
For example:
- In an uptrend, if a bearish move occurs at 08:30 AM but the price later closes above that level, it is considered a Judas Swing, indicating a high probability of further price increase;
- If a bearish move happens at 09:30 AM, but the next candle pushes the price back up, this suggests the formation of a bullish Order Block.
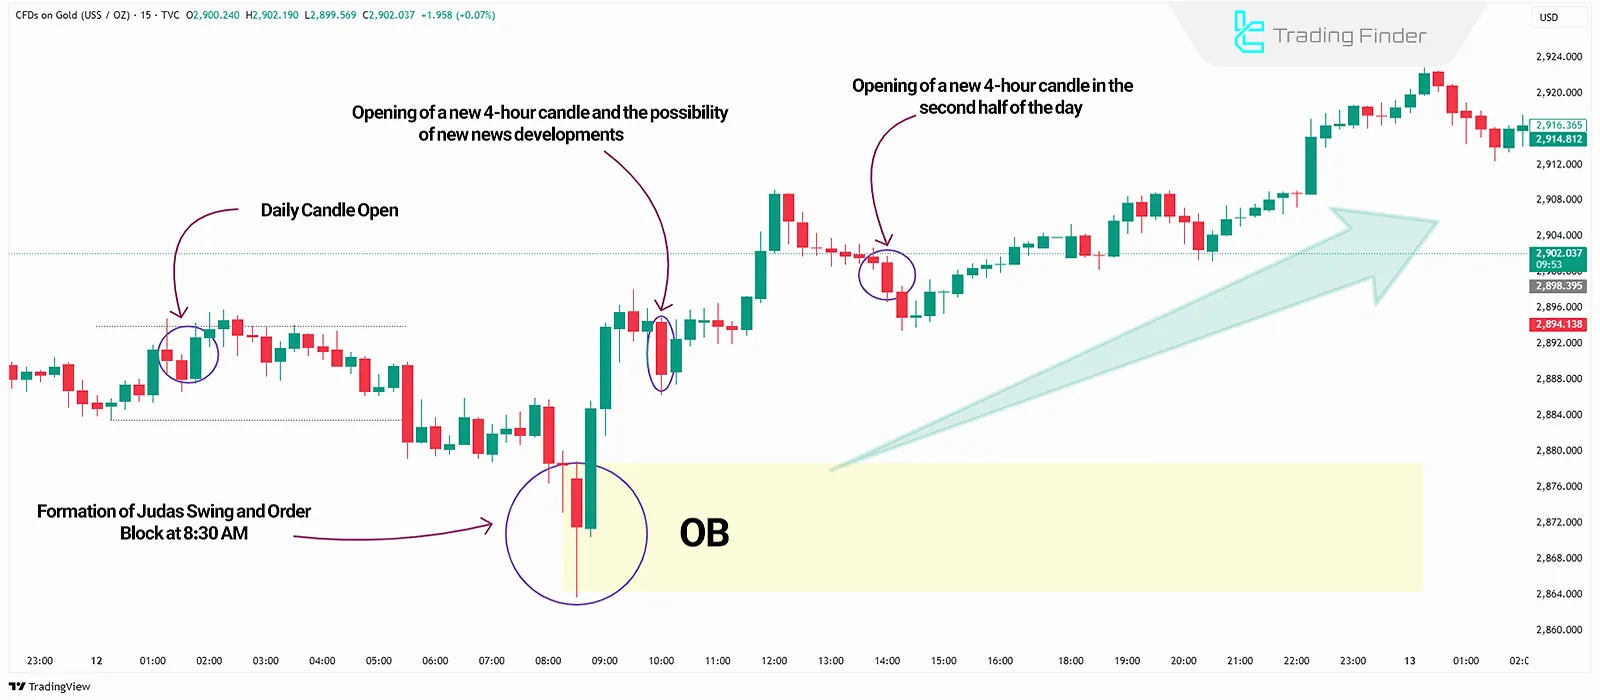
Bullish Example in ICT Time Level Analysis
In the 15-minute gold chart, a new daily candle forms at 01:00 AM. Around 08:30 AM, after the release of economic news, the price experiences a Judas Swing and creates an Order Block before continuing its uptrend.
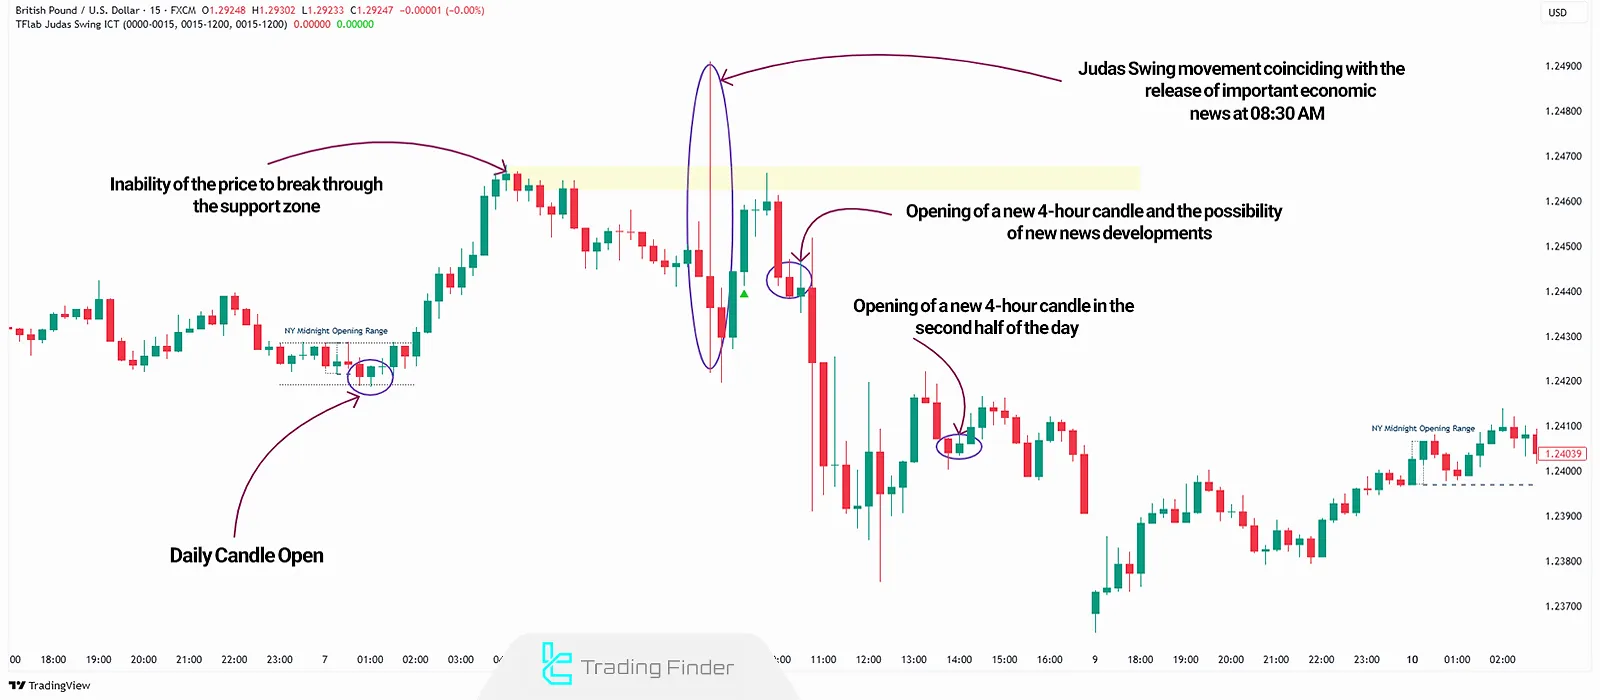
Bearish Example in ICT Time Level Analysis
The GBP/USD chart demonstrates a bearish market move using ICT time levels analysis. The price initially moves upward after the daily candle opens, reaching a support zone.
However, after failing to break above the support, a Judas Swing occurs at 08:30 AM, coinciding with major news releases, leading to a continuation of the downtrend.
Conclusion
ICT time levels are essential for market analysis and price movement prediction. Traders can identify OLHC & OHLC patterns, Order Blocks, and Judas Swings to develop effective trading strategies.


