


Recognizing "Daily Bias" using the concepts of Internal Range Liquidity (IRL) and External Range Liquidity (ERL) is essential for determining the general price movement direction in a trading day.
Based on analyzing key liquidity zones andalgorithmic market behavior, these concepts provide a framework for predicting price movements.
Price action in the ICT trading model constantly oscillates between external and internal liquidity levels.
What is Daily Bias?
Daily Bias refers to predicting the predominant price direction throughout a trading day. The concept begins by analyzing higher timeframes, such as weekly and daily, and then drills down into lower timeframes using internal and external liquidity principles.
Identifying Daily Bias with Internal and External Liquidity enhances traders’ win rates.
How to Identify Daily Direction
To identify a valid daily bias, the analysis process must be carried out in a step-by-step and continuous manner so that the market’s behavioral picture aligns across all timeframes. This analytical framework includes the following steps:
- Higher-timeframe analysis
- Determining the dominant market trend
- Identifying internal and external liquidity
- Analyzing recent price behavior
- Confirming direction with lower timeframes
#1 Analyzing Higher Timeframes
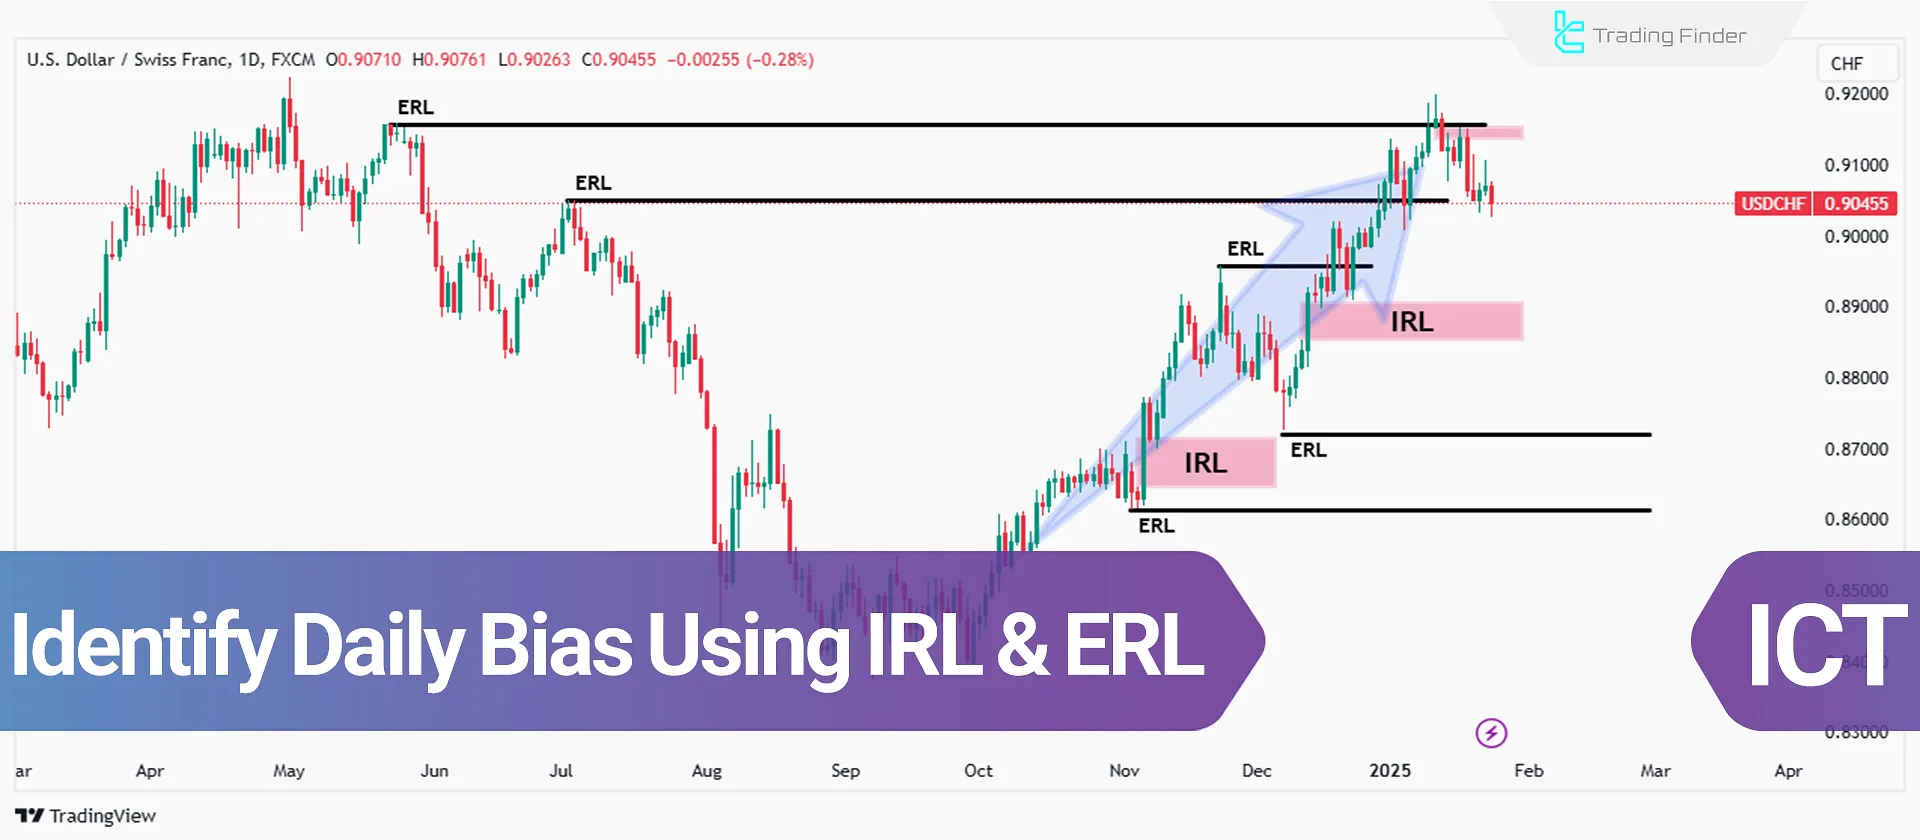
To identify daily bias with IRL and ERL, start by examining the weekly and daily timeframes. In this phase, old highs and old lows should be marked as external range liquidity (ERL).
These levels indicate areas that the market tends to move towards. Additionally, Fair Value Gaps (FVGs) within these timeframes should be identified, as they act as internal range liquidity (IRL), attracting price movement.
#2 Identifying the Market’s Dominant Trend
The overall market trend should be determined once key levels like support and resistance are identified on higher timeframes.
The trend can be bullish, bearish, or neutral. This analysis considers displacement moves (signaling liquidity grabs) and market structure shifts (MSS).
The trend is bullish if the market continuously breaks previous highs and forms new ones. Conversely, breaking previous lows consistently indicates a bearish trend.
#3 Identifying Internal and External Liquidity
To identify daily bias with IRL and ERL, focus on areas likely to attract price movement. Internal liquidity (IRL) is often found within Fair Value Gaps (FVGs) and imbalance zones.
These areas indicate points where the market tends to fill gaps. This concept is fully explained in the educational article on learning internal and external liquidityzones on the Writo-Finance website.
On the other hand, external liquidity (ERL) corresponds to old highs and lows, which attract price movement due to the accumulation of stop orders.
To recognize these areas, examine long-term and mid-term highs and lows.
#4 Analyzing Recent Price Action
After determining key areas, recent price action should be reviewed in the daily timeframe. If the price has recently collected external liquidity (ERL), its next target is typically an internal liquidity (IRL) zone.
Conversely, if the market moves away from an FVG, it is likely to head towards previous highs or lows.
#5 Confirming Bias Using Lower Timeframes
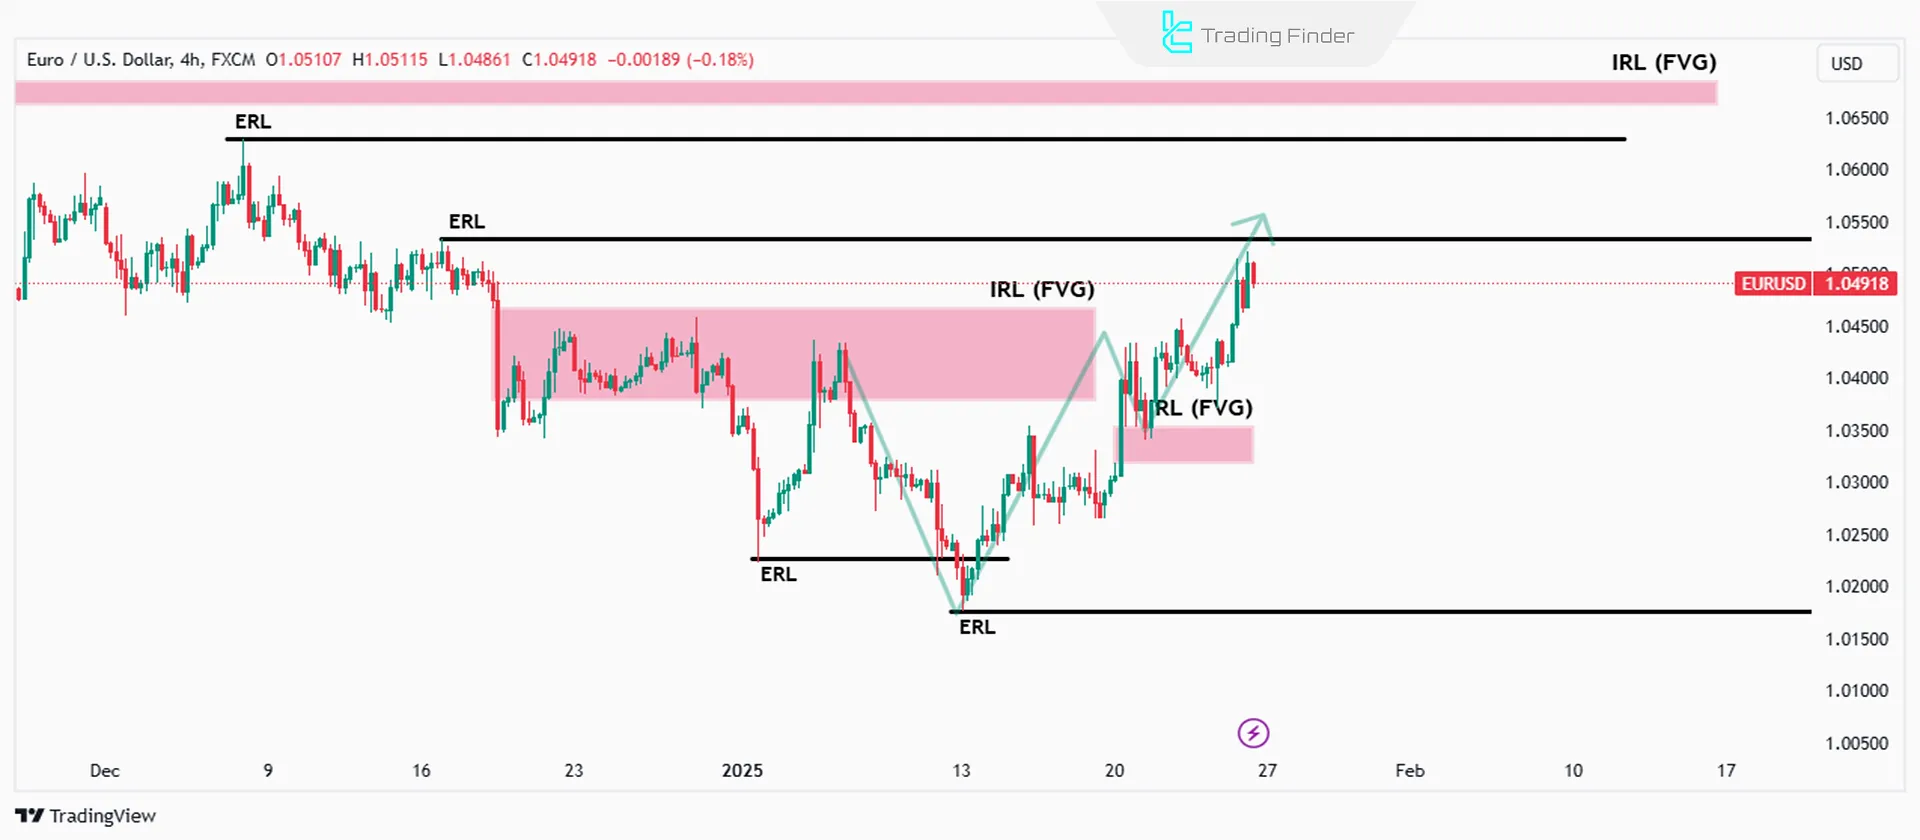
Once daily bias is identified using IRL and ERL, lower timeframes (such as 1-hour and 4-hour) should be analyzed. Look for signs like market structure shifts (MSS) or displacement moves in the direction of the daily bias.
These confirmations enable traders to enter trades with higher confidence. On the TTrades YouTube channel, the method for identifying daily bias using external and internal liquidity is taught in video format:
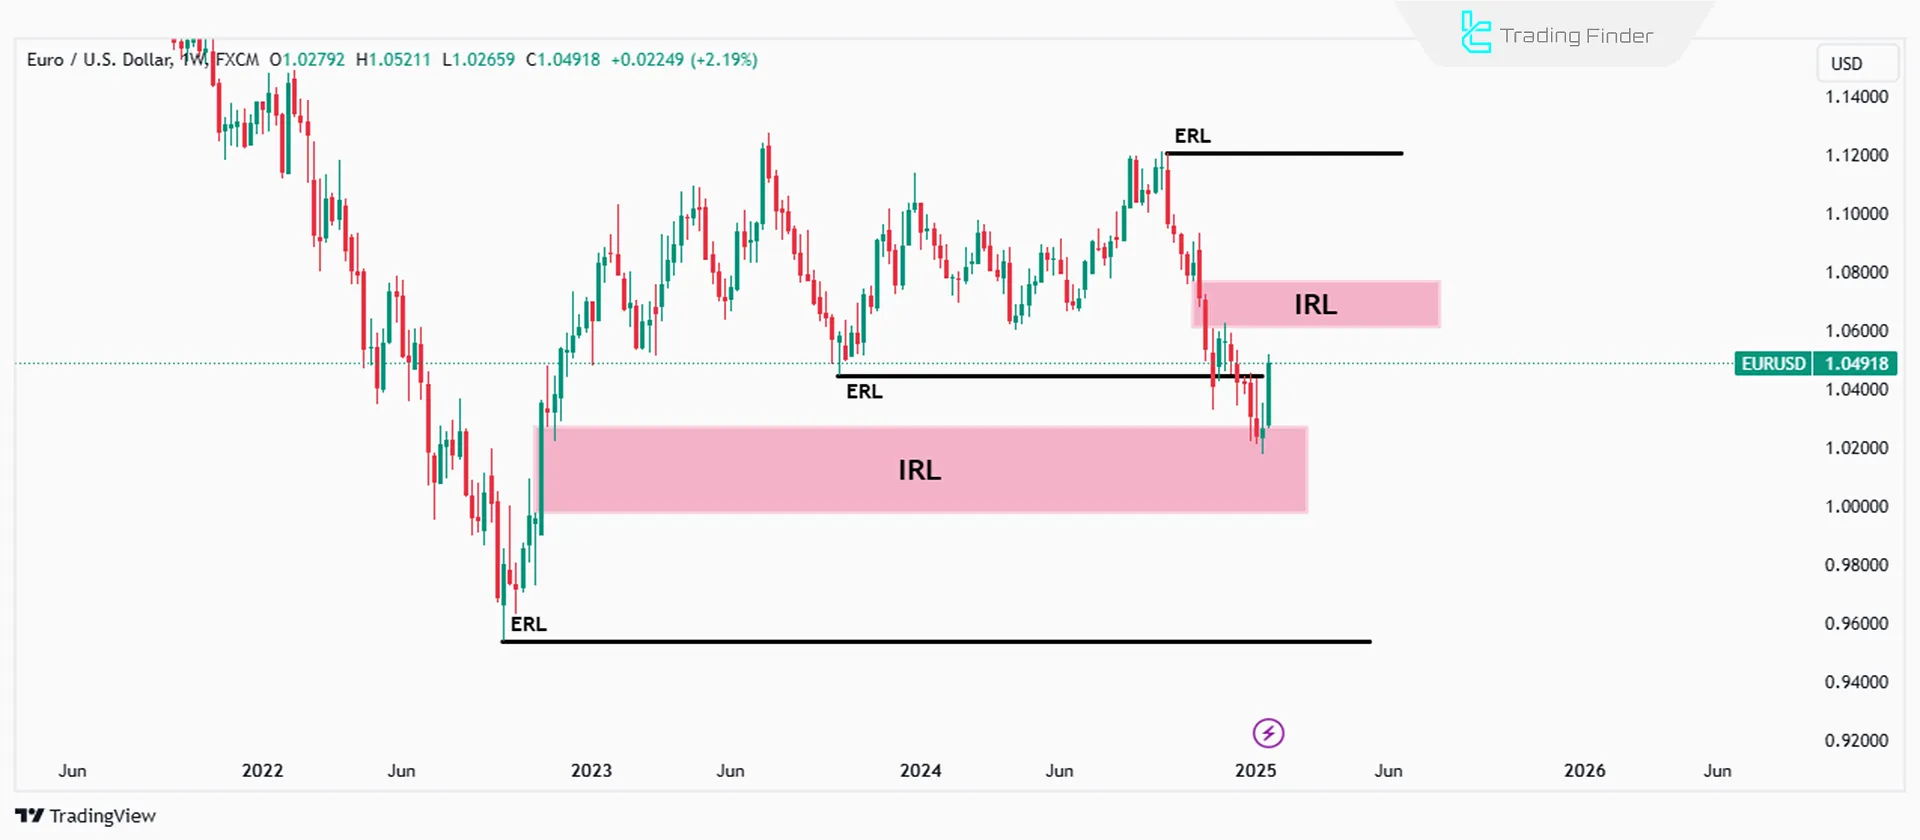
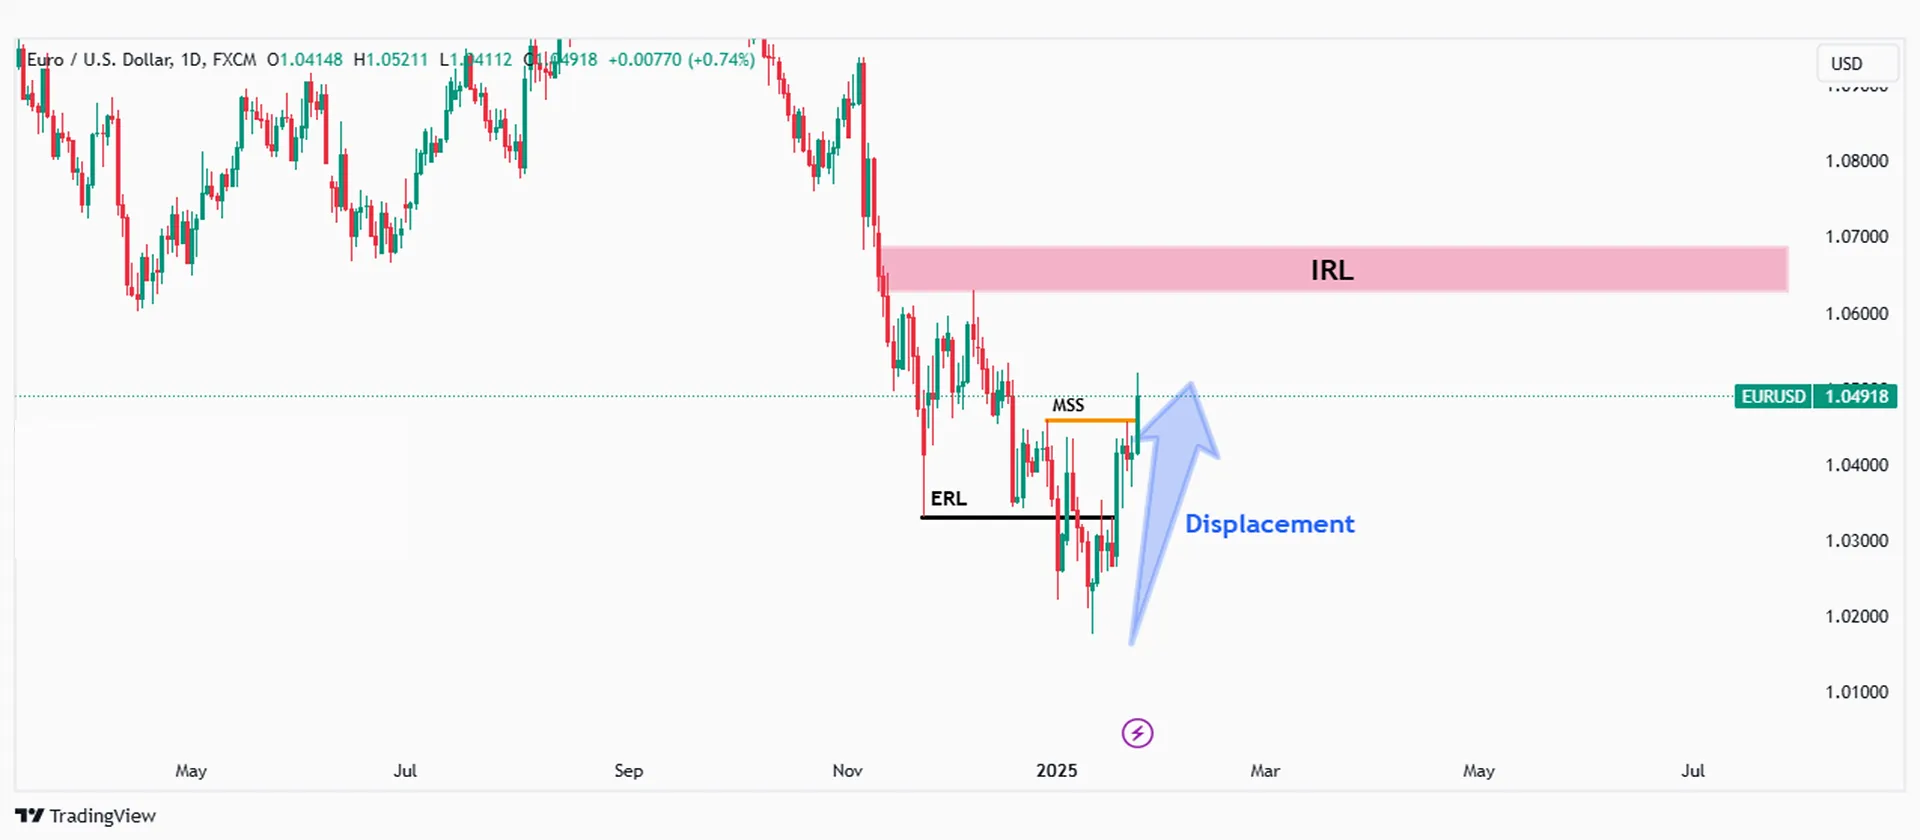
Practical Example of Identifying Daily Bias Using IRL and ERL
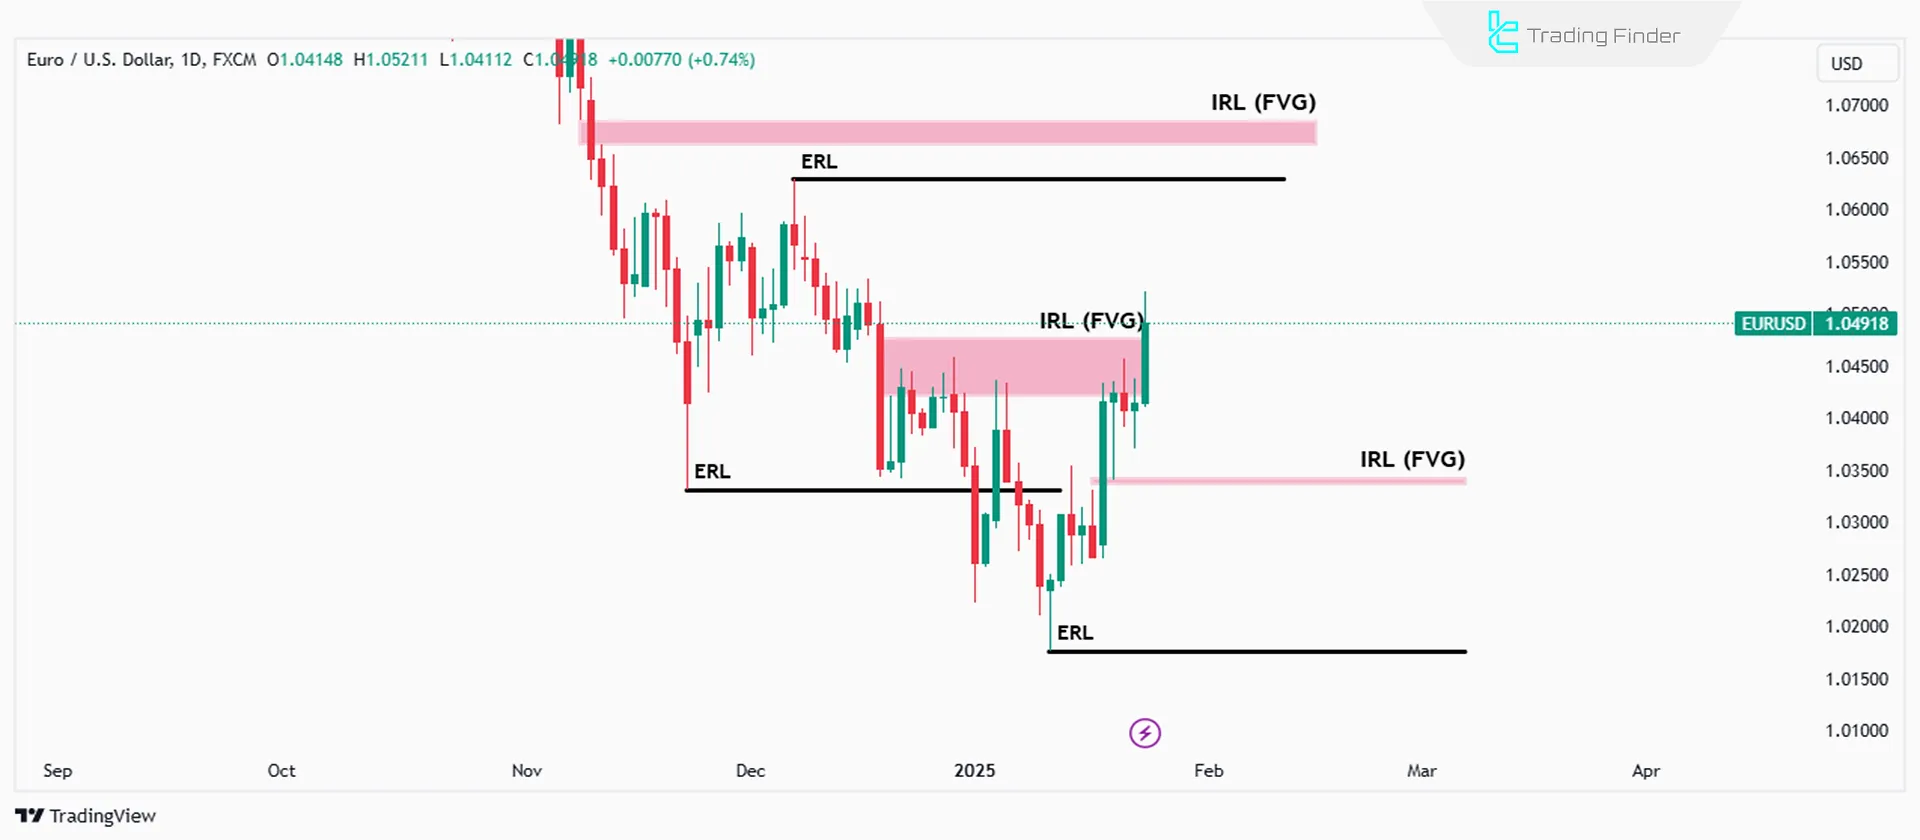
In this example, price behavior on the EURUSD pair is analyzed based on the concepts of internal liquidity (IRL) and external liquidity (ERL), a framework widely discussed as erl and irl in trading and commonly referenced as erl irl in professional market structure analysis.
First, the market’s prior lows are identified as external liquidity zones, which price collects through its downward movement. After this liquidity sweep, the market structure shifts and price enters a retracement phase.
Next, price reacts to internal liquidity zones defined as Fair Value Gaps (FVG), representing internal range liquidity within the broader structure, and after mitigating these areas, continues its path upward with an aggressive move.
This behavior indicates the formation of a bullish daily bias and increases the probability of price moving toward higher external liquidity.
This example demonstrates how ERL collection and price reaction to IRL, especially within the context of internal range liquidity, can provide a reliable framework for determining the market’s daily directional bias.
Comparison of Internal Liquidity (IRL) and External Liquidity (ERL) in Identifying Daily Bias
To better understand the role of internal liquidity and external liquidity in identifying daily bias, comparing these two concepts in terms of their formation location, price behavior, and trading application is highly important.
Within professional market analysis, these relationships are commonly discussed under irl erl trading and the broader framework of ict irl erl and erl irl ict, while the terminology behind erl meaning in trading and irl ict is used to clarify their structural roles.
The table below illustrates the main differences between IRL and ERL within the framework of daily market direction analysis.
Comparison Table of IRL and ERL:
Feature | Internal Liquidity (IRL) | External Liquidity (ERL) |
Formation Location | Inside the market price range | Previous highs and lows, forming external range liquidity |
Common Examples | Fair Value Gaps (FVG), imbalance zones | Prior swing highs and lows |
Role in Daily Bias | Mitigation and correction of price movement | Defining the primary target of price movement |
Reference Timeframe | 1-Hour and 4-Hour (H1, H4) | Daily and Weekly |
Typical Price Reaction | Pause, retracement, or temporary reversal | Breakout, liquidity sweep, or structural shift |
Trading Application | Identifying more precise entry points | Determining the dominant daily direction |
Position in Market Structure | Within the current structure | Outside the current structure |
Common Scenarios in Identifying Daily Bias
In the process of identifying daily bias using IRL and ERL, several recurring price behavior scenarios can be observed.
Understanding these scenarios supports more accurate decision-making and illustrates how the market transitions between internal and external liquidity:
- External liquidity sweep followed by return to internal liquidity: In this scenario, after breaking prior highs or lows, price enters a corrective phase and tends to move toward Fair Value Gaps (FVG) or other imbalance zones;
- Price exits a valid IRL and moves directly toward ERL: This behavior is commonly seen in markets with strong momentum and signals continuation of daily bias in the same direction;
- Fake breakout and change of direction: Here, price reaches external liquidity but fails to hold, then reverses direction. This scenario is often accompanied by a Market Structure Shift (MSS) and may indicate a change in daily bias.
Differences in IRL and ERL Behavior Under Various Market Conditions
The behavior of IRL and ERL is not uniform across all market conditions. Understanding these differences plays a critical role in accurately identifying daily bias.
Financial markets generally operate in two states: Trending and Ranging, and price reactions to liquidity zones differ in each.
Comparison Table of IRL and ERL Behavior in Different Market Conditions:
Comparison Feature | Trending Market | Ranging or Neutral Market |
Dominant Liquidity Role | External liquidity (ERL) guides price direction | Internal liquidity (IRL) acts as the primary volatility center |
Price Behavior Toward ERL | Price actively moves in trend direction to collect ERL | Price shows less tendency toward ERL and often remains without meaningful breakouts |
Price Behavior Toward IRL | Entry into IRL is usually temporary, forming retracements or pullbacks | Price mostly oscillates between IRL zones within a limited range |
Probability of ERL Collection | High, especially after trend structure is confirmed | Low, unless the range phase is broken |
Use of IRL in Trading Decisions | Primarily for entry timing and risk management | Main reference for defining consolidation ranges and short-term trading opportunities |
Accuracy of Daily Bias via ERL | High, as trend structure is confirmed through ERL | Low, since price movement forms mostly within internal structure |
Risk of Misanalysis from Wrong Focus | Over-focusing on IRL may cause missing major trend movement | Over-focusing on ERL may lead to incorrect directional predictions |
Role of Trading Sessions in Confirming Daily Bias
Trading sessions, especially London and New York, play a significant role in confirming or weakening daily bias.
In many cases, the daily direction forms during the early hours of the London session and is later completed or corrected during the New York session.
If price moves in the direction of the daily bias during the London session and shows signs of liquidity collection or market structure shift, the probability of continuation in the same direction increases.
Conversely, price reaction during the New York session can serve as final confirmation or indicate a potential change in scenario.
Combining IRL and ERL analysis with session timing significantly enhances the accuracy of daily direction identification.
When Not to Trade Based on Daily Bias?
Although daily bias is one of the main pillars of market structure analysis, its validity does not remain constant under all conditions. In certain scenarios, relying directly on daily bias may reduce trading decision accuracy.
Identifying these conditions before entering a trade plays a key role in risk control and avoiding misinterpretation of price behavior.
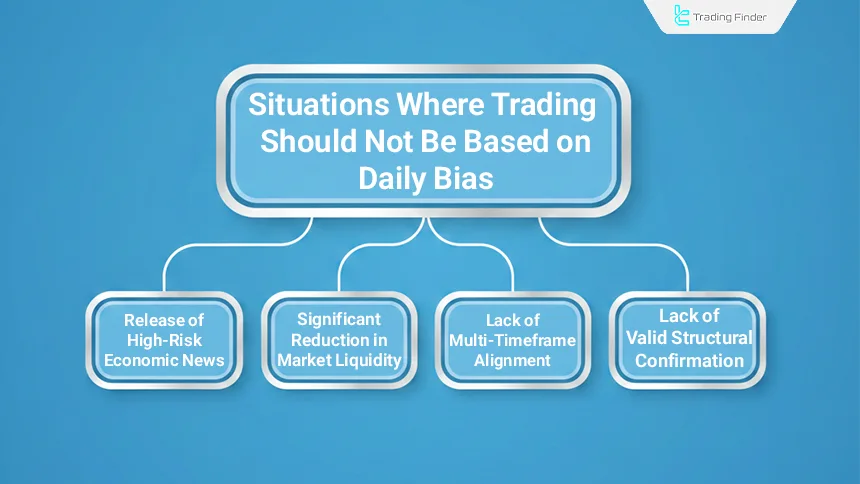
Situations where trading based on daily bias should be avoided:
- High-impact economic news releases: On days when major economic data causes sharp volatility that weakens the reliability of IRL and ERL levels and disrupts market structure;
- Significant reduction in market liquidity: When trading volume drops and price reactions to liquidity zones become irregular and unreliable;
- Lack of multi-timeframe alignment: When higher-timeframe daily bias conflicts with lower-timeframe structure and market direction lacks clarity;
- Absence of valid structural confirmation: When price reaches IRL or ERL zones but fails to produce clear structural signals on lower timeframes, increasing the likelihood of false signals.
Key Points in Identifying Daily Bias with Internal and External Liquidity
To accurately use the concepts of identifying Daily Bias with IRL and ERL, pay attention to the following points:
- Internal liquidity (IRL) is typically observed as Fair Value Gaps (FVGs);
- External liquidity (ERL) consists of old highs and lows where significant order accumulation occurs;
- Analyzing recent price action is crucial for better understanding future movements;
- Utilizing lower timeframes helps pinpoint precise entry and exit points.
Common Mistakes in Identifying Daily Bias
Despite the apparent simplicity of the IRL and ERL concepts, commonly referenced as irl and erl and widely discussed within erl irl in trading and ict erl irl frameworks, several mistakes exist among traders that can lead to incorrect identification of daily bias when applying an irl and erl trading strategy and broader erl trading methodologies:
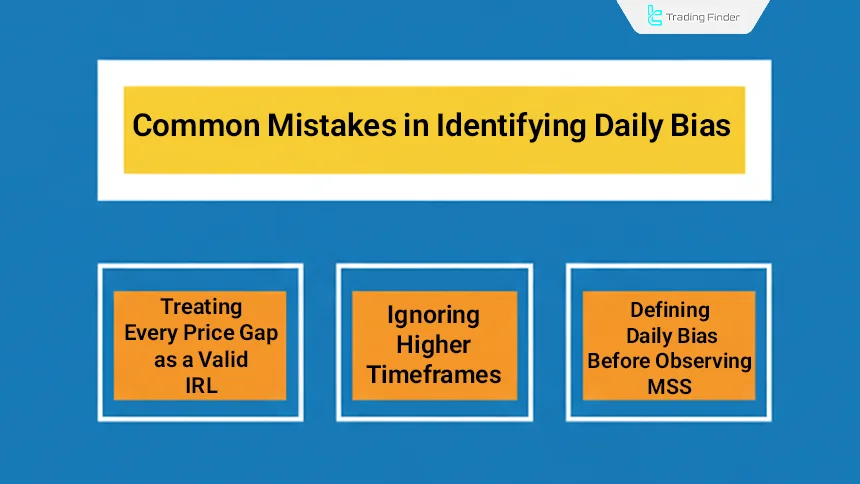
- Considering every price gap as a valid IRL: while only Fair Value Gaps (FVG) that are formed within the correct market structure have analytical validity;
- Ignoring higher timeframes: identifying daily bias without reviewing weekly and daily structure can result in entries against the primary market direction;
- Defining daily bias before observing market structure shift: this mistake causes the analysis to be based on subjective assumptions rather than actual price behavior.
Market Structure and Liquidity Sweep Indicator (Inducement and Sweep ICT)
The Inducement and Sweep ICT indicator, abbreviated as MSIS, is an advanced analytical tool based on ICT and Smart Money concepts, with its core analytical logic aligning closely with ict erl irl and irl and erl trading strategy models.
This indicator focuses on reading market structure and liquidity behavior, identifying inducement moves; movements that typically appear as market traps and guide traders into incorrect entries.
The core functionality of MSIS is built on the simultaneous identification of Change of Character (CHoCH), Break of Structure (BOS), Liquidity zones, and Inducement levels (IDM).
This analytical combination demonstrates how the market uses False Breakouts to trigger traders’ stop losses and subsequently collect the necessary liquidity for price continuation. Such an approach provides deeper insight into the behavioral logic of major market participants.
In bullish structures, the indicator first highlights inducement zones and market Change of Character, then after the liquidity collection phase, it displays price returning to the primary trend.
In bearish structures, the tool focuses on identifying false inducements before continuation of the dominant trend. These behavioral patterns are clearly observed in currency pairs such as GBP/USD and USD/JPY and enable precise analysis of Entry and Exit points.
The MSIS concept is designed for professional traders and trading styles such as scalping and day trading, and is applicable in Forex, Cryptocurrency, Stocks, and Forward Markets.
By providing a cohesive structural framework, this indicator delivers a transparent view of price movement logic and liquidity interaction and is recognized as a specialized tool in market structure analysis.
- Market Structure & Liquidity Sweep Indicator for MT5 (Inducement and Sweep ICT)
- Market Structure & Liquidity Sweep Indicator for MT4 (Inducement and Sweep ICT)
Conclusion
Higher timeframes serve as the foundation for daily bias identification. Weekly and daily charts provide critical reference points for external liquidity grabs, while lower timeframes refine entry points. Without this top-down Analysis, traders risk misinterpreting short-term fluctuations.
This approach achieves its highest level of accuracy when it is aligned with multi-timeframe structure, market momentum, and daily liquidity conditions, which form the core framework of irl trading and clarify the erl meaning in forex within the broader concept of external and internal liquidity.
Ignoring the broader market context or applying these concepts in isolation can lead to incomplete interpretations of price behavior.
Understanding the interaction between IRL and ERL across different market scenarios provides the foundation for more stable and controlled trading decision-making.


