


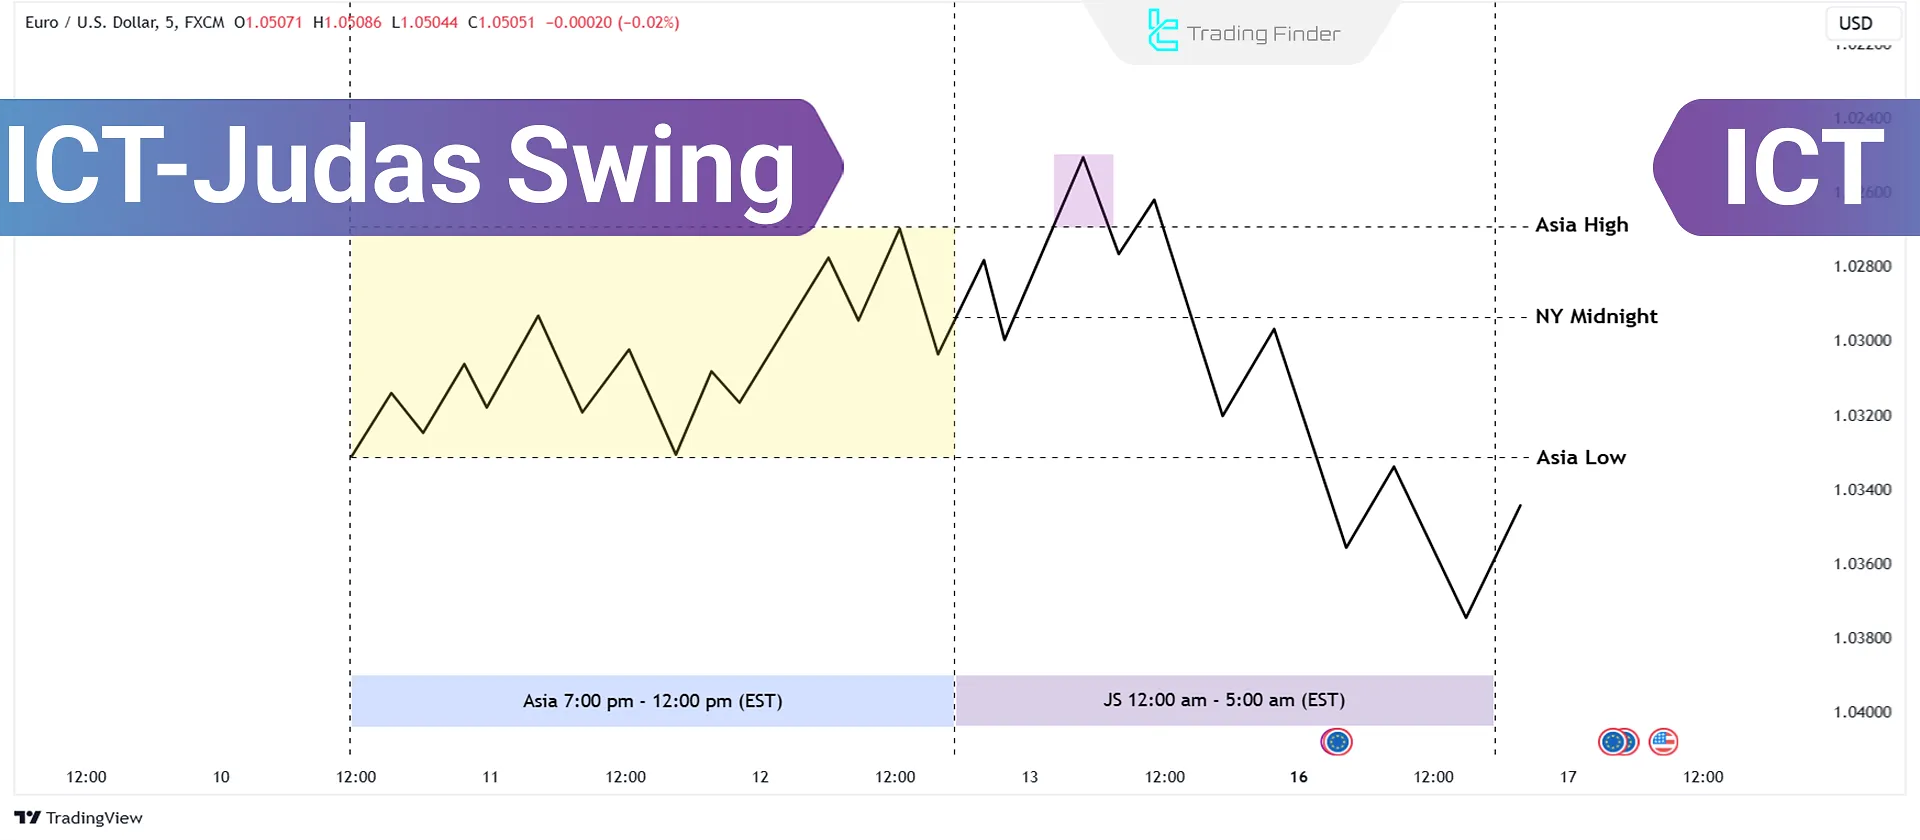
The ICT Judas Swing Strategy represents a false move against the main trend initiated by Smart Money. This tactic misled retail traders into misinterpreting the market’s trend direction. It typically occurs between the New York Midnight Open (00:00) and 5:00 AM New York Time.
Understanding the Judas Swing guides the trader in identifying the deceptive early-day movements and prevents rushed entry; then a path is created so that, after liquidity is taken and price returns to the main structural direction, the trader can choose an appropriate entry point.
What is an ICT Judas Swing?
A Judas Swing in ICT trading refers to a deceptive price movement designed to mislead retail traders.
- The price temporarily moves in a specific direction, creating an illusion of trend continuation;
- However, the trend abruptly reverses, and the market moves in the opposite direction.
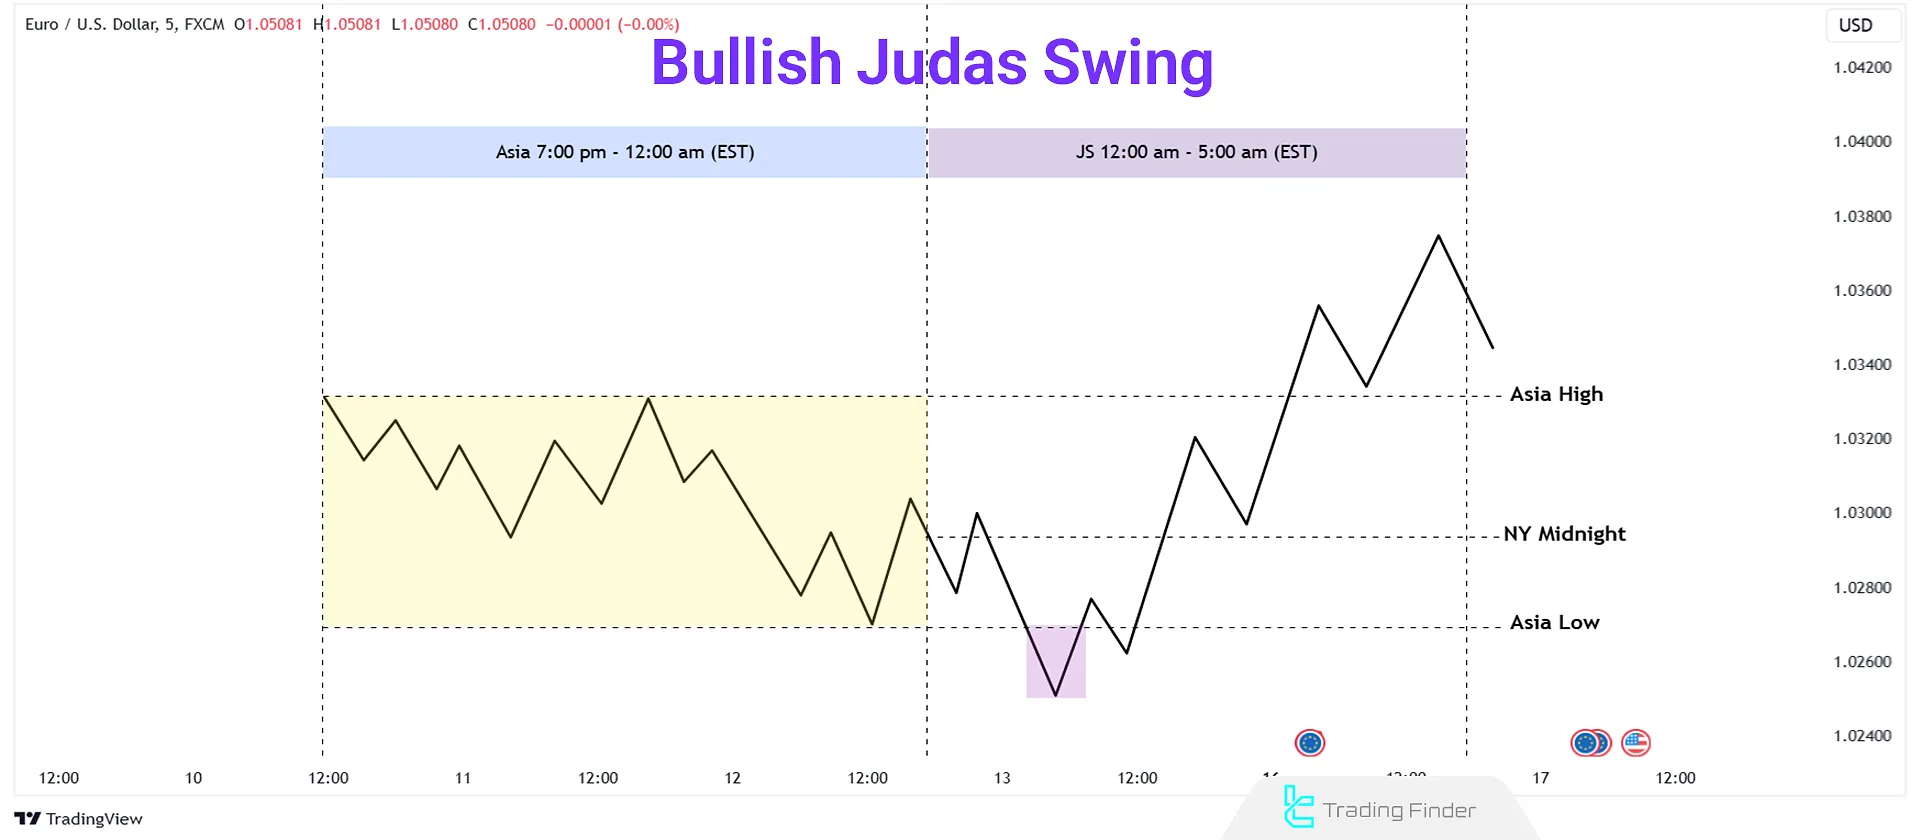
#1 ICT Bullish Judas Swing
In a Bullish Judas Swing, a false downward move below the opening price deceives traders into believing a downtrend will continue. Then, the price reverses upward, collecting liquidity.
- Smart Money triggers stop-losses of traders who bought at the opening price, forcing them to sell;
- Smart Money gathers liquidity as retail traders sell, pushing the market upward.
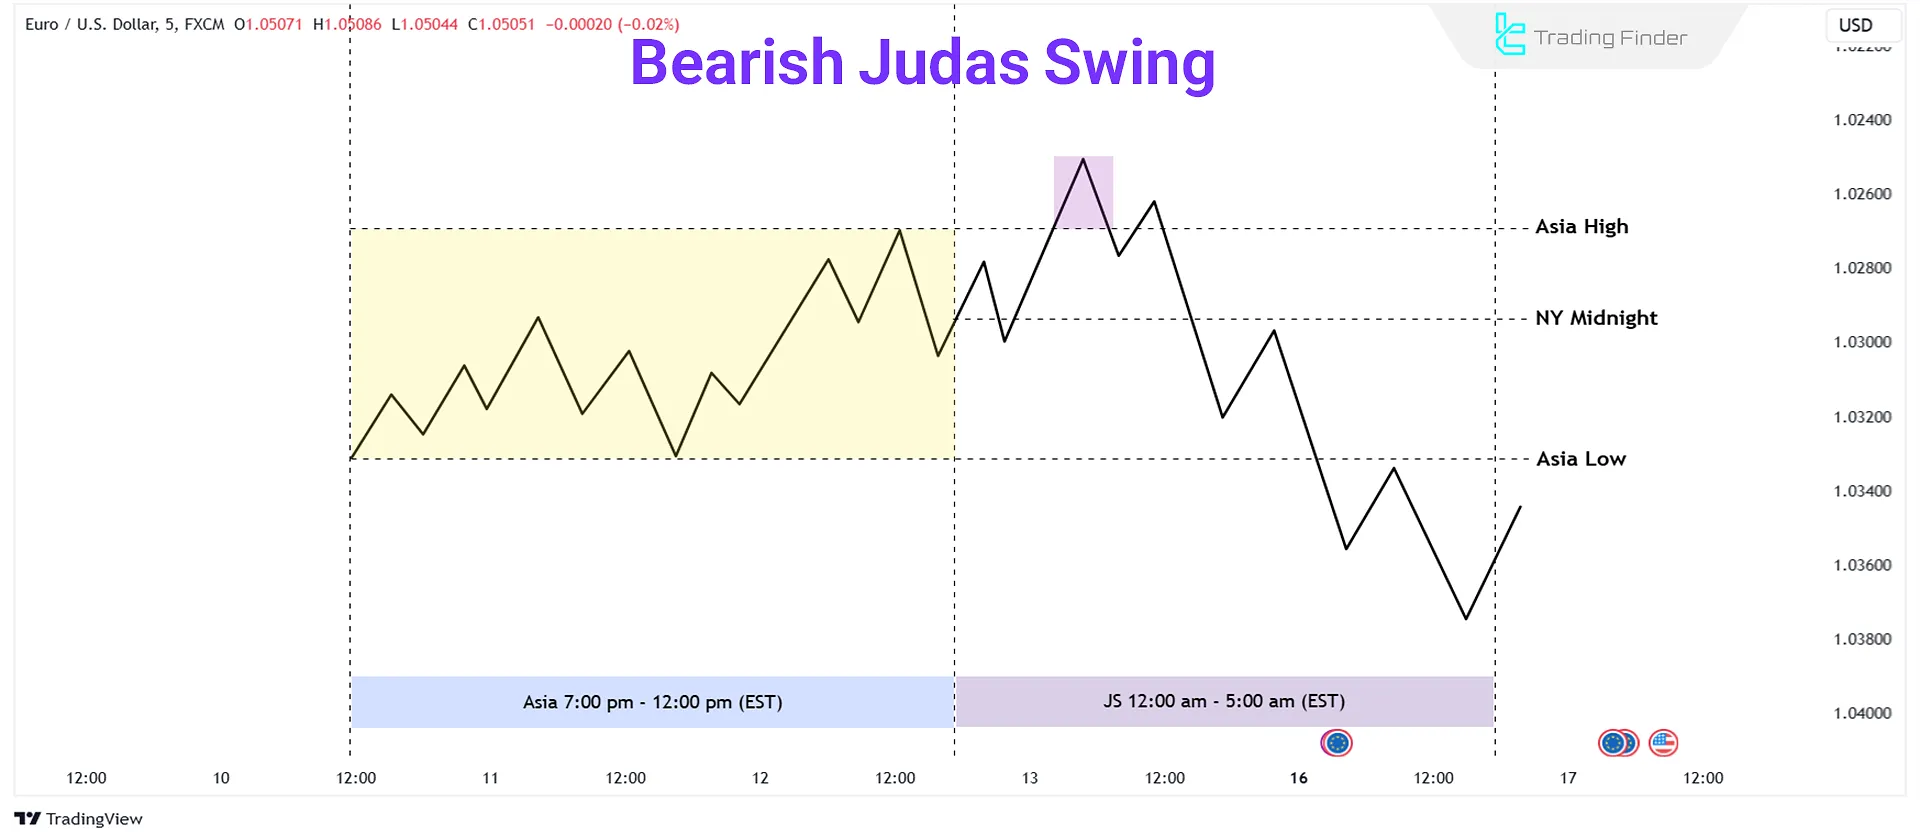
#2 ICT Bearish Judas Swing
In a Bearish Judas Swing, a false upward move above the opening price misleads traders into believing an uptrend will continue. Then, the price reverses downward, collecting liquidity.
- Smart Money triggers stop-losses of traders who sold at the opening price, forcing them to buy back;
- Smart Money gathers liquidity as retail traders buy, pushing the market downward.
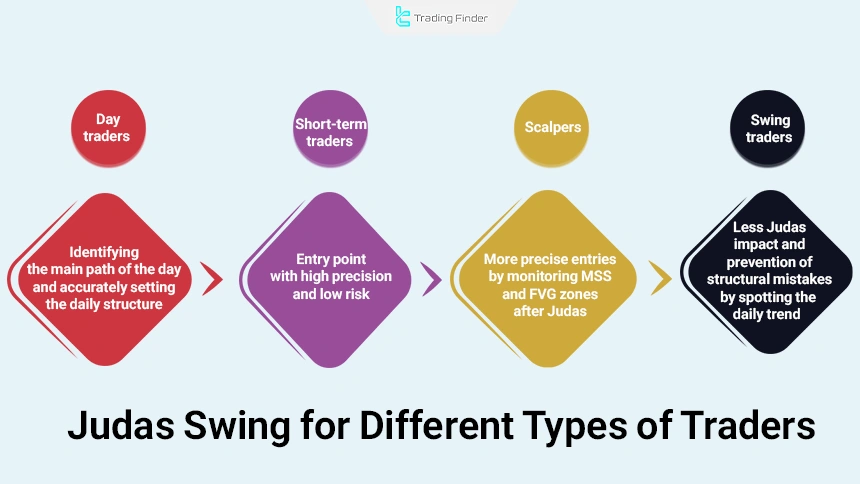
For Which Types of Traders is the Judas Swing Suitable?
Based on the trading style, the impact of the Judas Swing for traders varies, and each group receives different value from this structure:
- Day traders with 15m to 1h timeframe: Identify the main direction of the day through Judas and set the daily framework with high precision;
- Short-term traders with daily focus: Judas creates a precise and low-risk entry point for them;
- Scalpers with 1 to 5m timeframe: After Judas, they record more precise entries by monitoring MSS and FVG zones;
- Swing traders in multi-day trades: The effect of Judas is less for this group, but identifying the daily direction prevents structural mistakes.
What is the Difference Between Judas Swing and Inducement?
In the ICT style, the concept of inducement refers to a move created to encourage the entry of retail traders and absorb their liquidity.
The Judas Swing is an advanced version of this pattern and has specific characteristics. In the table below, we present an accurate comparison between Judas Swing and Inducement:
Item of comparison | Inducement | Judas Swing |
Definition | A deceptive move to absorb the liquidity of retail traders | A time-based liquidity-grab pattern at the start of the day |
Objective | Creating the illusion of trend continuation or breakout and collecting stops | Early-day trap and liquidity collection before the main reversal |
Time framework | Any time and any session | After the close of the New York session and before the opening of the London session |
Direction of movement | With or against the trend | Move against the bias of the day |
Place of formation | Liquidity zones such as highs and lows | The Asian range or near the New York midnight opening price |
Movement structure | Small or large deceptions in price | A sharp move against the direction and a fast return toward the main flow |
Role in liquidity | Triggering stops and retail orders | Collecting accumulated liquidity at the start of the day |
Scale/Fractal | Present in all timeframes | Intraday and daily positioning at the beginning of the day |
Conceptual relation | General deceptive pattern | A timed and specific subset of inducement |
Trading application | Warning zone for cautious entry | Point of formation of an aggressive early-day setup |
The Role of the Asian Session in Forming the Judas Swing
Before the start of the London session, the market usually moves within a quiet range during the Asian session.
Smart money uses this range to design its deceptive move.
Therefore, to identify the Judas Swing, mark the following zones:
- The Asian High
- The Asian Low
In most cases, the Judas move breaks one of these two zones to collect the liquidity below or above it and then moves in the main direction of the day.
When Does the ICT Judas Swing Occur?
The ICT Judas Swing typically occurs between New York Midnight Open (00:00) and 5:00 AM New York Time.
It often aligns with the London session opening at 3:00 AM New York Time, developing between the start of the London session and 5:00 AM.
The structural characteristics of the Judas Swing are as follows:
- A false move against the main trend of the day;
- Formation within the limited time window of 00:00 to 05:00 New York;
- Breaking the highs/lows of the Asian session or the New York opening price;
- Absorbing a significant volume of stop-loss orders (Liquidity Grab);
- Creating motivation for retail traders to enter in the wrong direction;
- Rapid market structure shift (MSS);
- Price returning toward the order block or FVG after the false break;
- The start of the main move of the day immediately after liquidity is taken.
The educational video from the Faiz SMC channel provides supplementary information about the structure of the Judas Swing and its formation time on the chart, which will be useful for ICT and SMC traders.
How to Trade ICT Judas Swing?
You must first determine the correct Daily Bias to trade the ICT Judas Swing. Daily Bias refers to the anticipated market direction for the day, identified using various technical analysis methods.
Once you have the correct Daily Bias, you can use the ICT Judas Swing entry strategy effectively.
The Judas Swing training article in Smart Money on the writofinance.com website also mentions important points that interested individuals can use as well.
Trading the Judas Swing in a Bullish Market
In a bullish market, follow these steps to trade the ICT Bullish Judas Swing:
- Identify the New York Open Price;
- Spot a false downward move below the opening price;
- Detect a market structure shift (MSS) upward after the false downward move.
After collecting liquidity below the opening price and the market structure shift (MSS) to the upside (between 00:00 and 05:00 New York time), find a fair value gap (FVG) or a bullish order block (OB+) on the buy side.
When prices return to the order block or the fair value gap (FVG), you can execute a buy trade with the stop-loss placed a few pips below the Judas Swing. For the take-profit, target the buy-side liquidity (BSL).
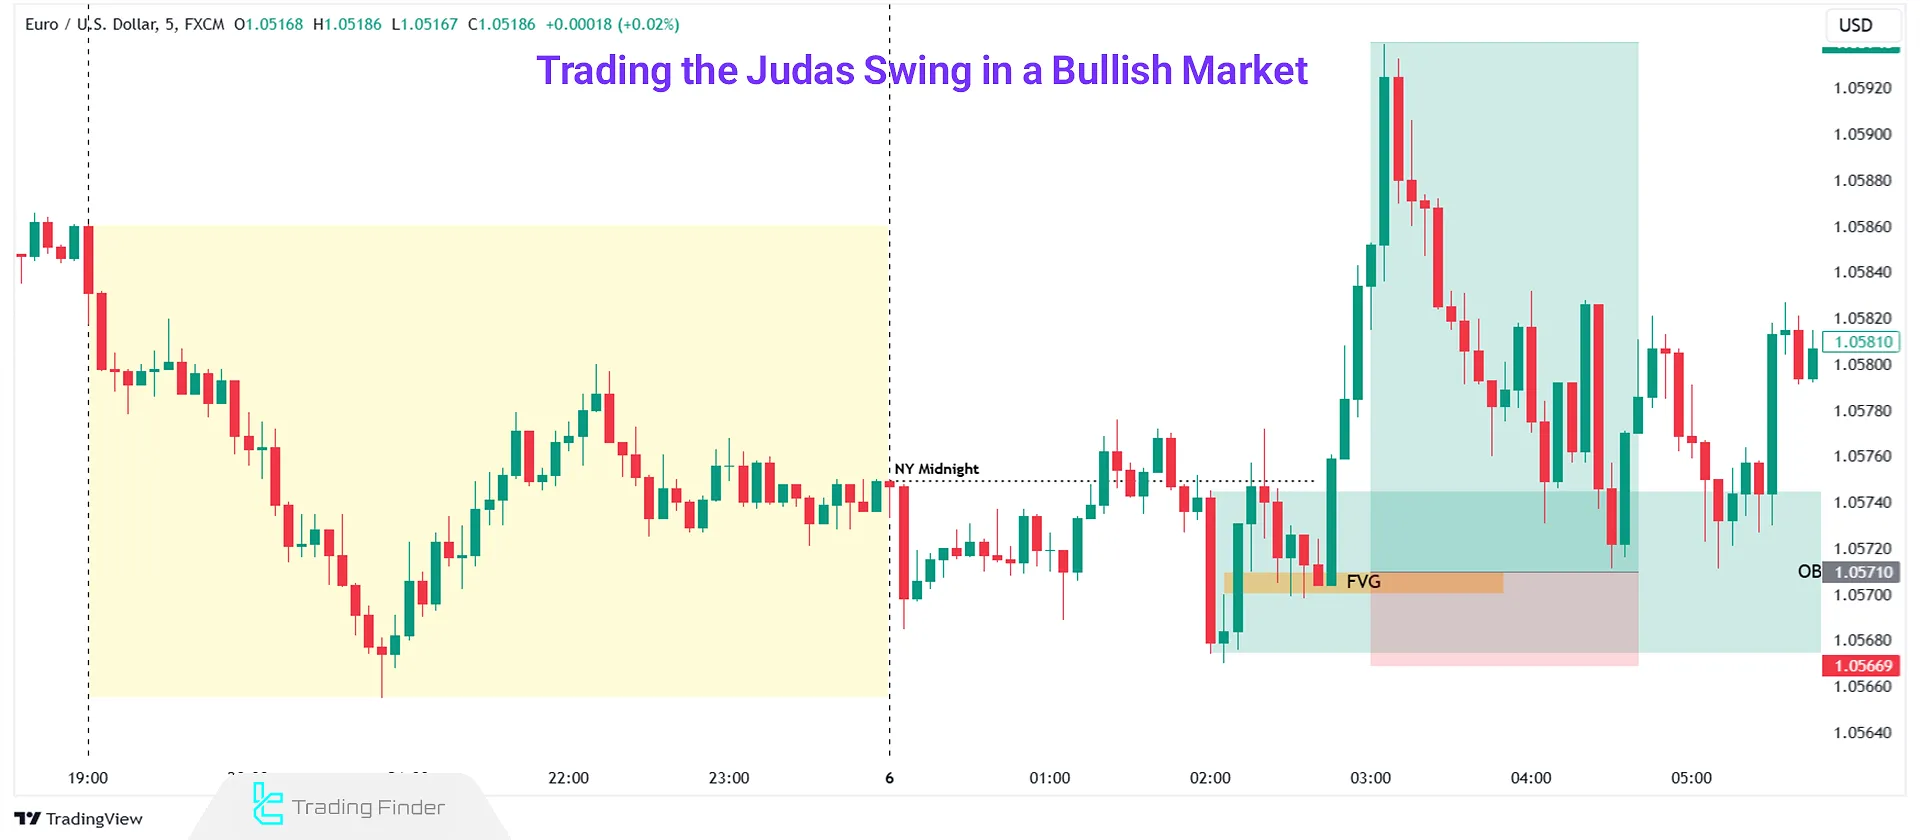
Real Example of Judas Swing in a Bullish Market
In the 5-minute timeframe chart of EUR/USD, a fake move and a break of the New York midnight high has occurred, and after that the price experienced a false drop.
With the bullish market structure shift in lower timeframes and the price returning to the FVG, buy trades can be taken with the target set at the upcoming liquidity.
In the Judas Swing, the stop-loss is placed below the price low that was formed by the false bearish move.
Trading the Judas Swing in a Bearish Market
In a bearish market, to trade with the Judas Swing in the ICT style, the following points must always be examined:
- Identify theNew York Open Price;
- Spot a false upward move above the opening price;
- Detect a market structure shift (MSS) downward after the false upward move.
After collecting liquidity above the opening price and the market structure shift (MSS) to the downside (between 00:00 and 05:00 New York time), find a fair value gap (FVG) or a bearish order block (OB–) on the sell side.
When prices return to the order block or the fair value gap (FVG), you can execute a sell trade with the stop-loss placed a few pips away. For the take-profit, target the sell-side liquidity (SSL).
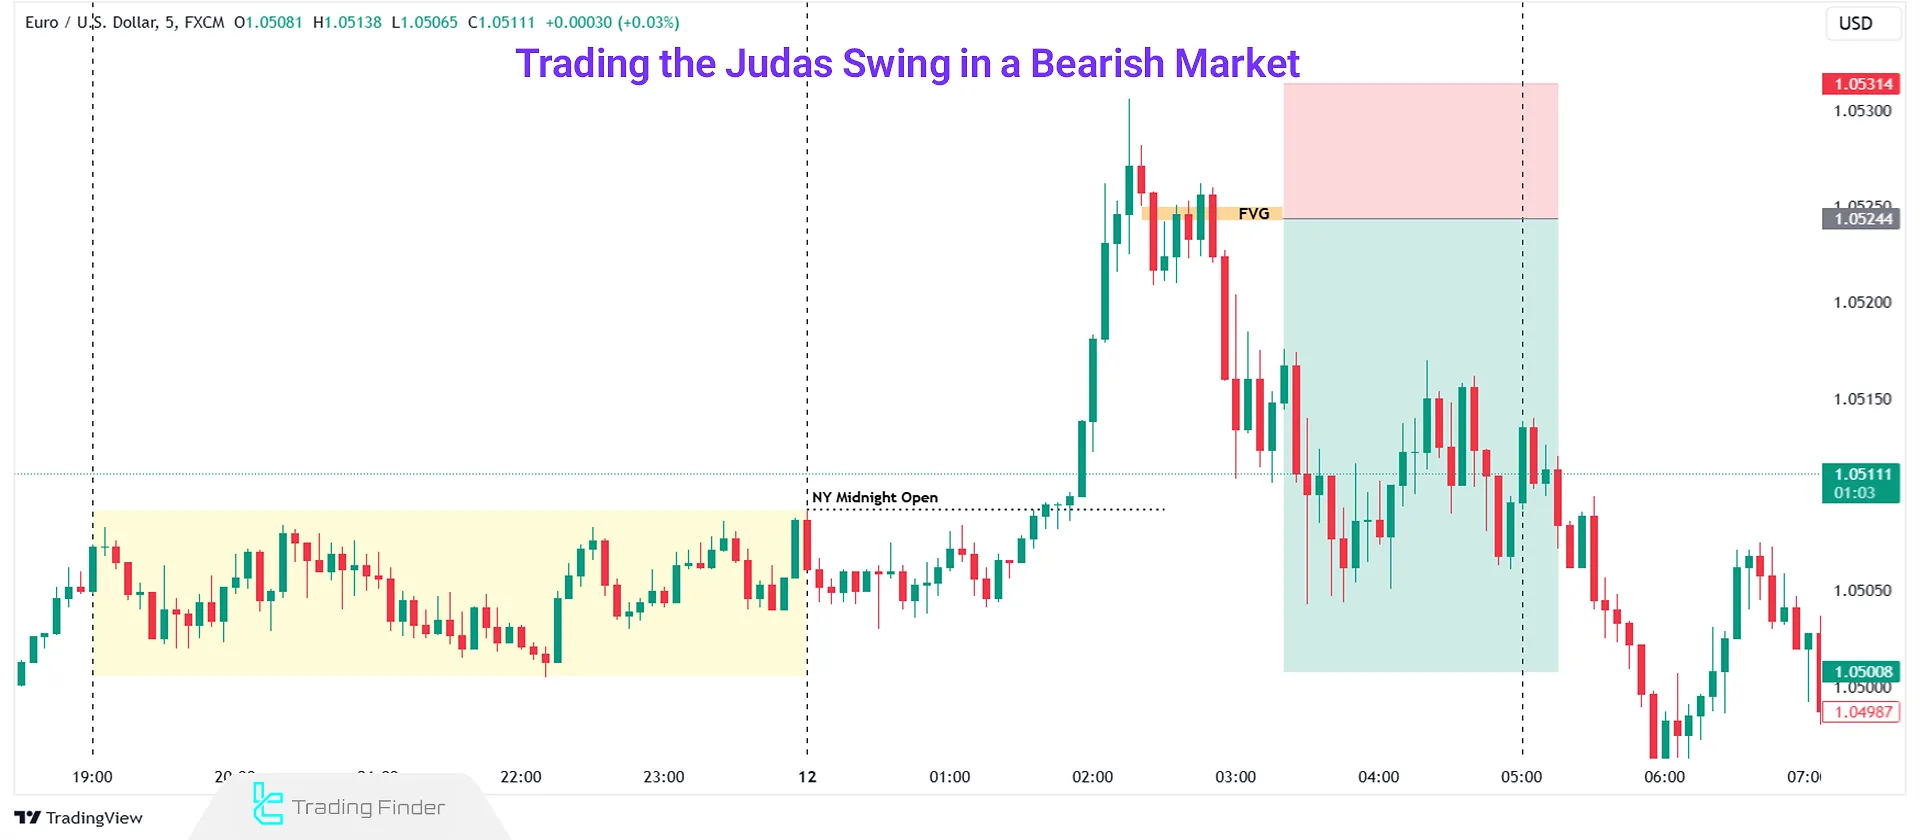
Real Example of Judas Swing in a Bearish Market
In the EUR/USD pair chart, a strong bullish move as a fake New York midnight breakout is observed, and after the structure shift in lower timeframes and the price returning to the FVG, a sell trade can be taken.
The stop-loss of the bearish Judas Swing trade is placed above the high that was formed by the false bullish move, and for the take-profit, the upcoming liquidity levels are considered.
Judas Swing Indicator for MetaTrader
The Judas Swing indicator in the Smart Money environment and the ICT style is known as a specialized tool in MetaTrader.
By focusing on price behavior within the time range of 00:00 to 05:00 New York, it analyzes market structure based on key patterns such as Change of Character (CHoCH), FVG zones, and Order Block.
The core of this tool is based on identifying nighttime deceptive movements and pivot points.
The indicator’s mechanism is set so that it first marks the price return to liquidity zones or FVG gaps with a gray arrow; then, if structural conditions are met, a buy signal appears with a green arrow and a sell signal with a red arrow. This mechanism provides reliable and direct alerts on the chart.
Judas Swing falls under the categories of ICT indicators, Smart Money, scalping, and forecasting, and has the highest efficiency in M1 to M30 timeframes.
This tool is applicable in Forex, cryptocurrency, and forward markets, and displays liquidity-related data with high accuracy.
In bullish scenarios, a deceptive move and liquidity absorption are first recorded; then, with the formation of an FVG zone and the occurrence of bullish CHoCH, the main direction becomes active.
An example of this behavior can be seen in the EUR/USD chart on the one-minute timeframe after the structure break, and the indicator displays the entry signal on the chart.
The same logic applies in bearish trends as well; for example, in the CAD/CHF chart, after liquidity absorption and the price returning to the FVG, a bearish structure break was recorded and a sell signal was generated.
The settings section includes parameters such as background color, determining the New York Start Time and End Time, and a server time adjustment option for backtesting, providing the ability to align the tool with the trader’s analytical method.
Overall, the Judas Swing indicator, by combining liquidity concepts, imbalance zones, and structural breaks, presents an accurate picture of sensitive nighttime fluctuations and strengthens the capacity for analyzing the key directions of the market.
Conclusion
The ICT Judas Swing strategy relies on price manipulations at specific times (between midnight and 05:00 New York time), where smart money uses false moves to trigger traders’ stop-loss orders.
Success requires precision in identifying market structure shifts and validating the Daily Bias. Accurate tools likeFair Value Gaps and Order Blocks help determine optimal entry and exit points.


