


Order Flow (OF) reflects the stream of buy or sell orders from traders, investors, institutions, and other market participants. Ultimately, this flow determines the direction and movement of currency prices in both ICT Style & SMC Strategies.
Order Flow (OF) generally comprises candles that counter the primary market trend.
What is ICT Market Order Flow?
Order Flow (OF) is an institutional concept that reveals the footprints of Smart Money. During price corrections following an uptrend, Smart Money executes its positions.
Since they manage substantial capital, executing all trades at once is impossible. As a result, corrective candles are referred to as Order Flow.
Identifying ICT Order Flow
To identify Order Flow, you must first understand Break of Structure (BOS). Order Flow comprises corrective candles that form before a Break of Structure (BOS) occurs.
When the price breaks the structure, identify pullbacks below the BOS level and mark them as Order Flow. OF is categorized into two types based on market trends:
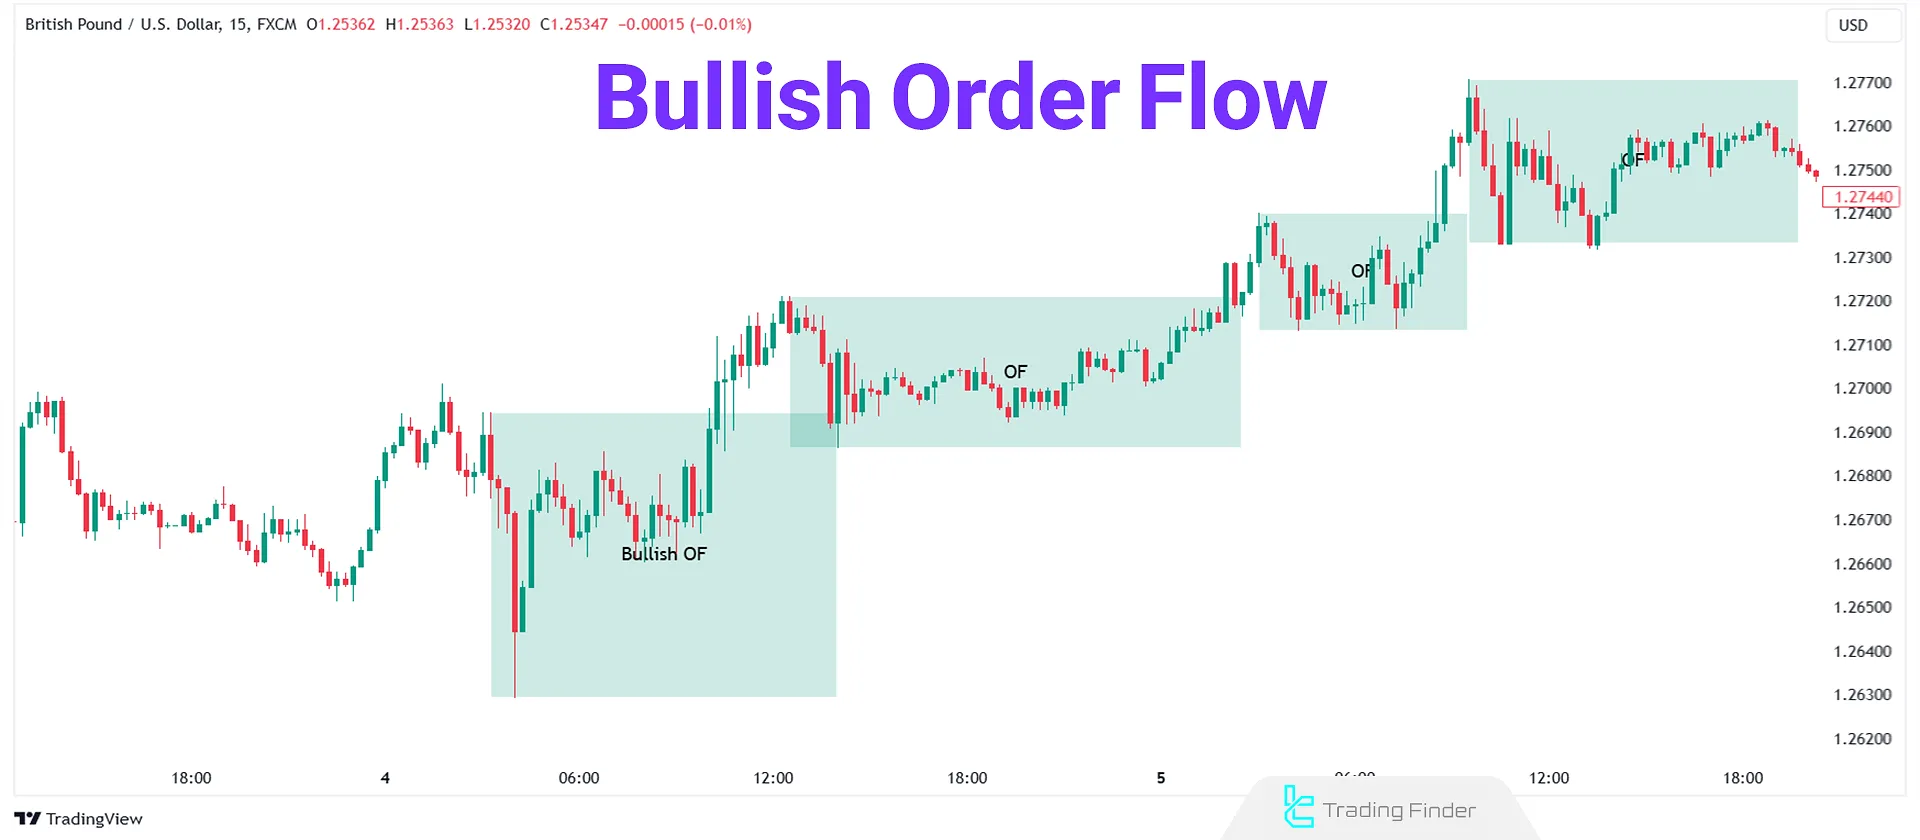
Bullish Order Flow
Bullish Order Flow represents the entry of buy orders and demand pressure from Smart Money. It consists of bearish (pullback) candles that form in an upward movement before a Break of Structure (BOS).
In Bullish Order Flow, bearish candles support the price, encouraging traders to buy from these zones.
Notably, this setup highlights valid demand zones, bullish order blocks, and PD arrays as the key areas where price holds, while supply zones and bearish order blocks are often overlooked by the market, serving as zones to induce liquidity grabs before the trend resumes.
- If there’s only one pullback candle, it can be marked as Order Flow.
- If there are multiple candles, all should be marked as the Order Flow zone.
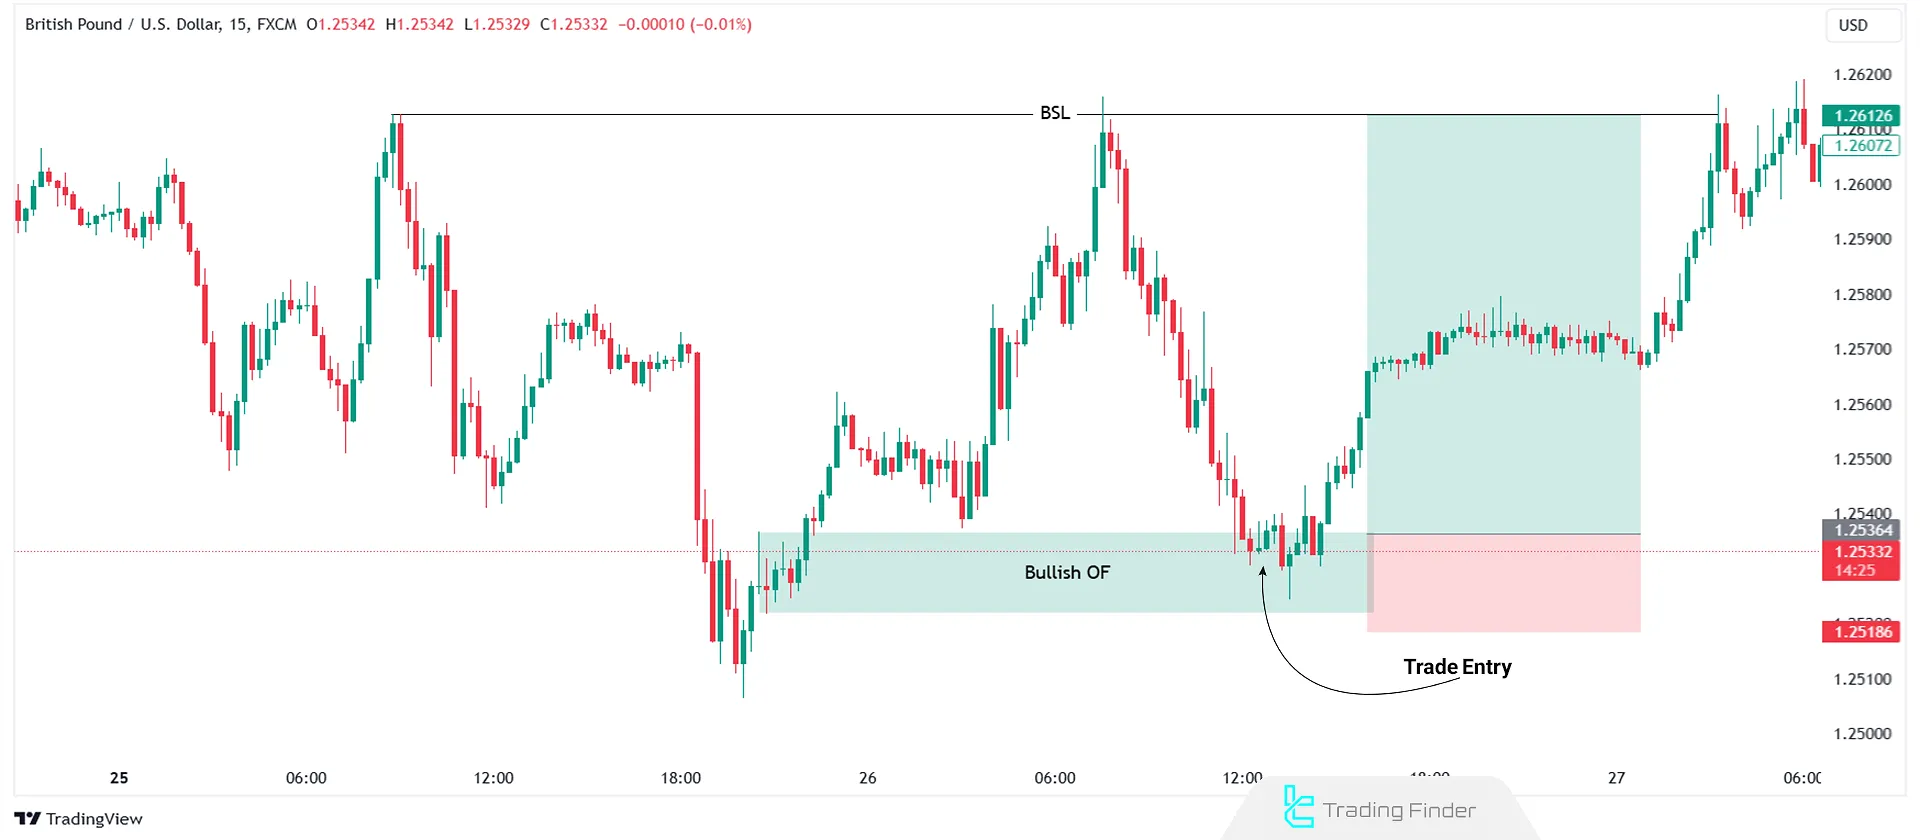
Trading with Bullish Order Flow
To trade using Bullish Order Flow, identify and mark Order Flow zones below the BOS level.
Multiple Bullish Order Flow zones may exist, so wait for price corrections to test these zones.
These zones often align with demand zones, bullish order blocks, or PD arrays, which act as strong buy areas, while supply zones or bearish order blocks and PD arrays above are typically bypassed as liquidity traps.
The steps for trading Bullish Order Flow are:
- Testing the Order Flow Zone: As the price approaches the Bullish Order Flow zone, look for bullish evidence, such as Market Structure Shift (ICT MSS) on lower timeframes.
- Evaluating Evidence: If the first Bullish Order Flow zone doesn’t provide the necessary evidence, wait for the price to test the second Order Flow zone.
- Entering the Trade: Execute a buy trade once sufficient bullish evidence is observed. The Stop Loss (SL) should be placed below the Order Flow zone or according to your risk management strategy.
- Setting Take Profit (TP): Set the Take Profit (TP) at targets like the previous price high or the following liquidity draw points.
The example below illustrates this process:
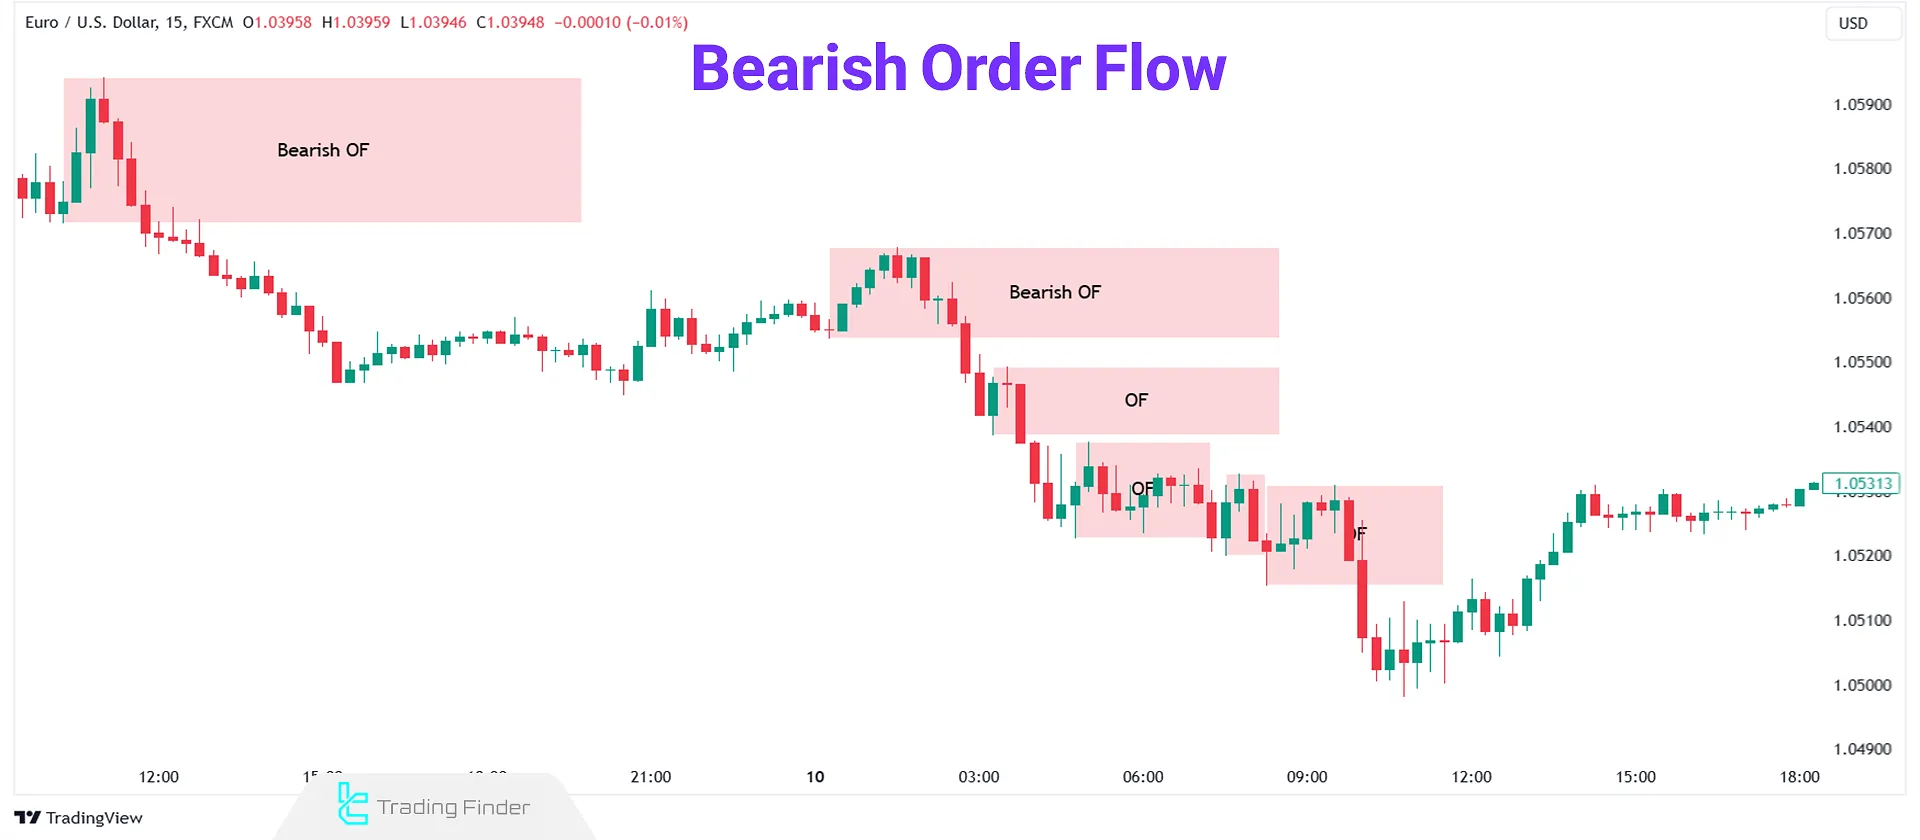
Bearish Order Flow
Bearish Order Flow represents the entry of sell orders and supply pressure from Smart Money. Bearish Order Flow (OF) consists of bullish (pullback) candles that form in a downward movement before a Break of Structure (BOS).
These bullish candles act as resistance to the price, prompting traders to sell from these zones.
In this context, supply zones, bearish order blocks, and PD arrays emerge as critical resistance levels where price reacts, while demand zones and bullish order blocks are frequently ignored, functioning as liquidity inducement zones to fuel the downtrend.
- If there’s only one pullback candle, it can be marked as Order Flow.
- If there are multiple candles, all should be marked as the Order Flow zone.
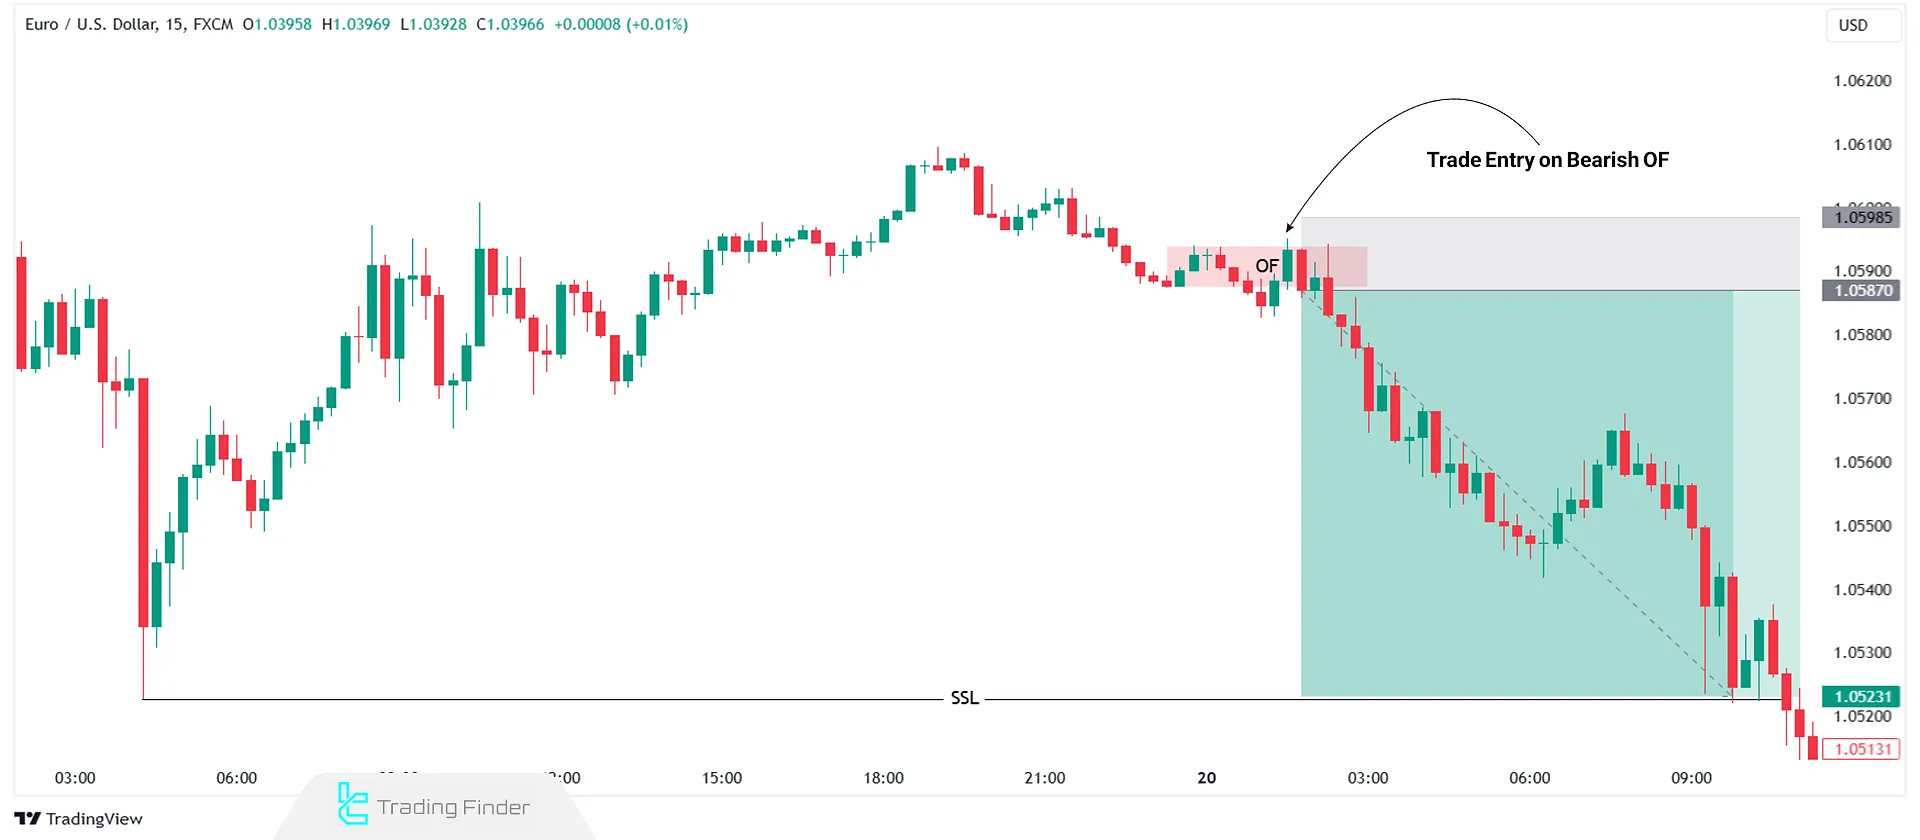
Trading with Bearish Order Flow
To trade using Bearish Order Flow, identify and mark Order Flow zones above the BOS level. Multiple Bearish Order Flow zones may exist, so wait for price corrections to test these zones.
These zones typically correspond to supply zones, bearish order blocks, or PD arrays, serving as prime sell areas, while demand zones or bullish order blocks below are often skipped as liquidity traps. Steps for trading Bearish Order Flow:
- Testing the Order Flow Zone: As the price approaches the Bearish Order Flow zone, look for bearish evidence, such as Market Structure Shift (ICT MSS) on lower timeframes.
- Evaluating Evidence: If the first Bearish Order Flow zone doesn’t provide the necessary evidence, wait for the price to test the second Order Flow zone.
- Entering the Trade: Execute a sell trade once sufficient bearish evidence is observed. The Stop Loss (SL) should be placed above the Order Flow zone or according to your risk management strategy.
- Setting Take Profit (TP): Set the Take Profit (TP) at targets like the previous price low or the following liquidity draw points.
The example below illustrates this process:
Conclusion
ICT Market Order Flow is a tool for decoding the precise entry and exit points of Smart Money, enabling traders to align with institutional positioning within the market structure.
By leveraging this concept, traders can not only determine the correct direction of the market structure but also pinpoint which support and resistance zones or supply and demand zones are likely to hold.


