


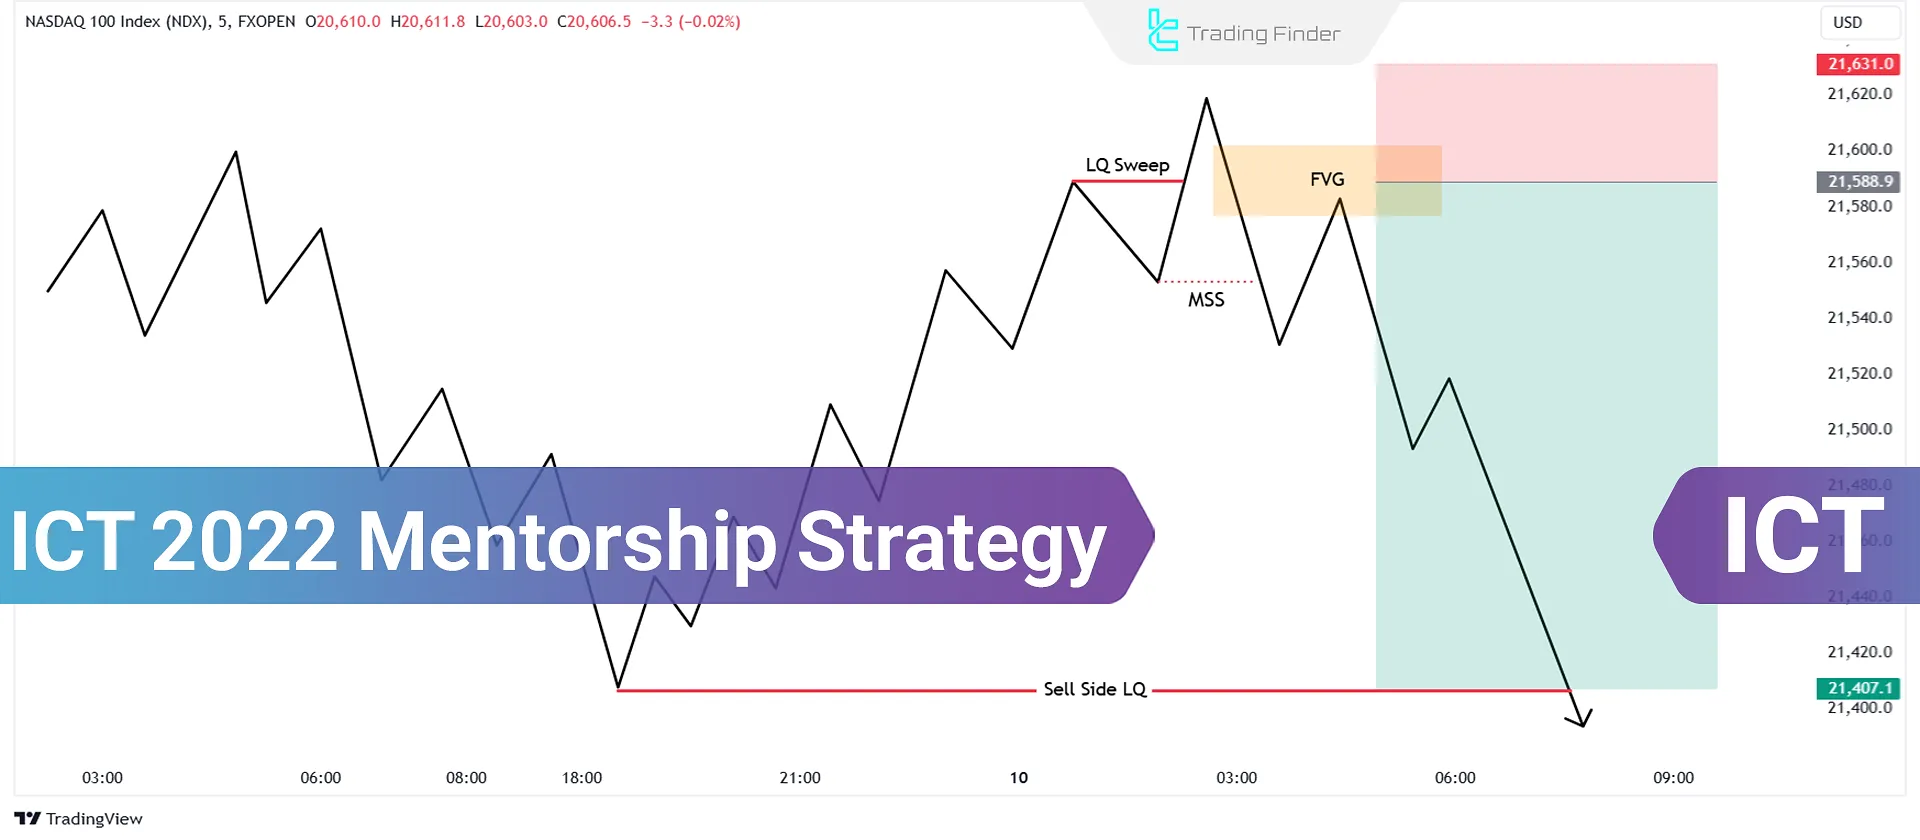
The ICT 2022 Mentorship trading strategy is uniquely designed based on the combination of market liquidity and precise timing. Utilizing advanced tools such as the Fair Value Gap (FVG), Order Blocks, and Breaker Blocks, it enables traders to identify entry and exit points with high accuracy.
The perfect alignment of price movement with the London and New York trading sessions is a hallmark of the ICT 2022 Mentorship strategy.
This model focuses on identifying liquidity in key market highs and lows, emphasizing Daily Bias recognition and analyzing market behavior across multiple timeframes.
It provides a cohesive framework for achieving a minimum risk-to-reward ratio of 1:3.
By focusing on liquidity sweeps and market structure shifts, the ICT 2022 trading strategy offers a clear pathway for day traders and has become one of the most popular trading methods among financial market participants.
What is the ICT 2022 Mentorship Trading Strategy?
The ICT 2022 Mentorship trading model is an algorithm-based strategy that leverages principles of price imbalance and market liquidity.
The key element of this strategy is synchronizing price movements with specific time intervals, such as the opening of the London and New York sessions.
To implement the ICT 2022 Mentorship trading Setup, a trader must first identify the daily bias, meaning the prevailing daily trend (bullish or bearish).
Next, they must mark key liquidity points such as daily highs and lows or those from prior sessions.
Michael Huddleston’s strategy, utilizing tools likeFair Value Gaps (FVG), Order Blocks, and Displacement Moves, allows traders to execute precise trades.
Entry confirmations typically occur with market structure shifts (MSS) and price retracements to premium or discount zones.
How Does the ICT 2022 Trading Model Work?
The first step for successfully executing the ICT Mentorship 2022 strategy is the correct identification of the daily bias. This helps you align your trades with the predominant market trend.
After determining the bias, you must wait for the London session to open at 03:00 AM (New York time).
In the article london and new york session trading guide on tradingstrategyguides.com, the market’s directional behavior during the London session is discussed in greater detail, and those interested can refer to this article for a deeper understanding of the topic.
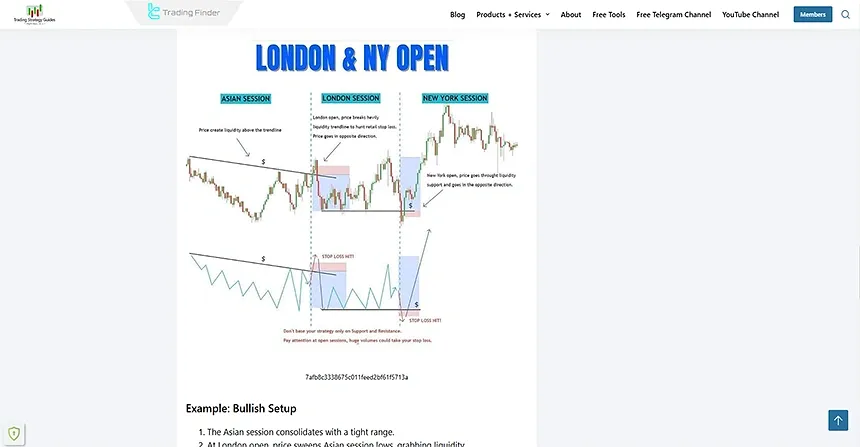
London Session Trading Strategy (Step-by-Step Process)
In the London session, liquidity volume increases significantly at the same time as European banks begin operating, and this sudden momentum creates the conditions for generating orderly and predictable algorithmic movements.
The trading structure of this session is based on liquidity hunts, price structure shifts, and the market’s return to key PD Arrays. By following the steps below, it becomes possible to execute low-risk and targeted trades:
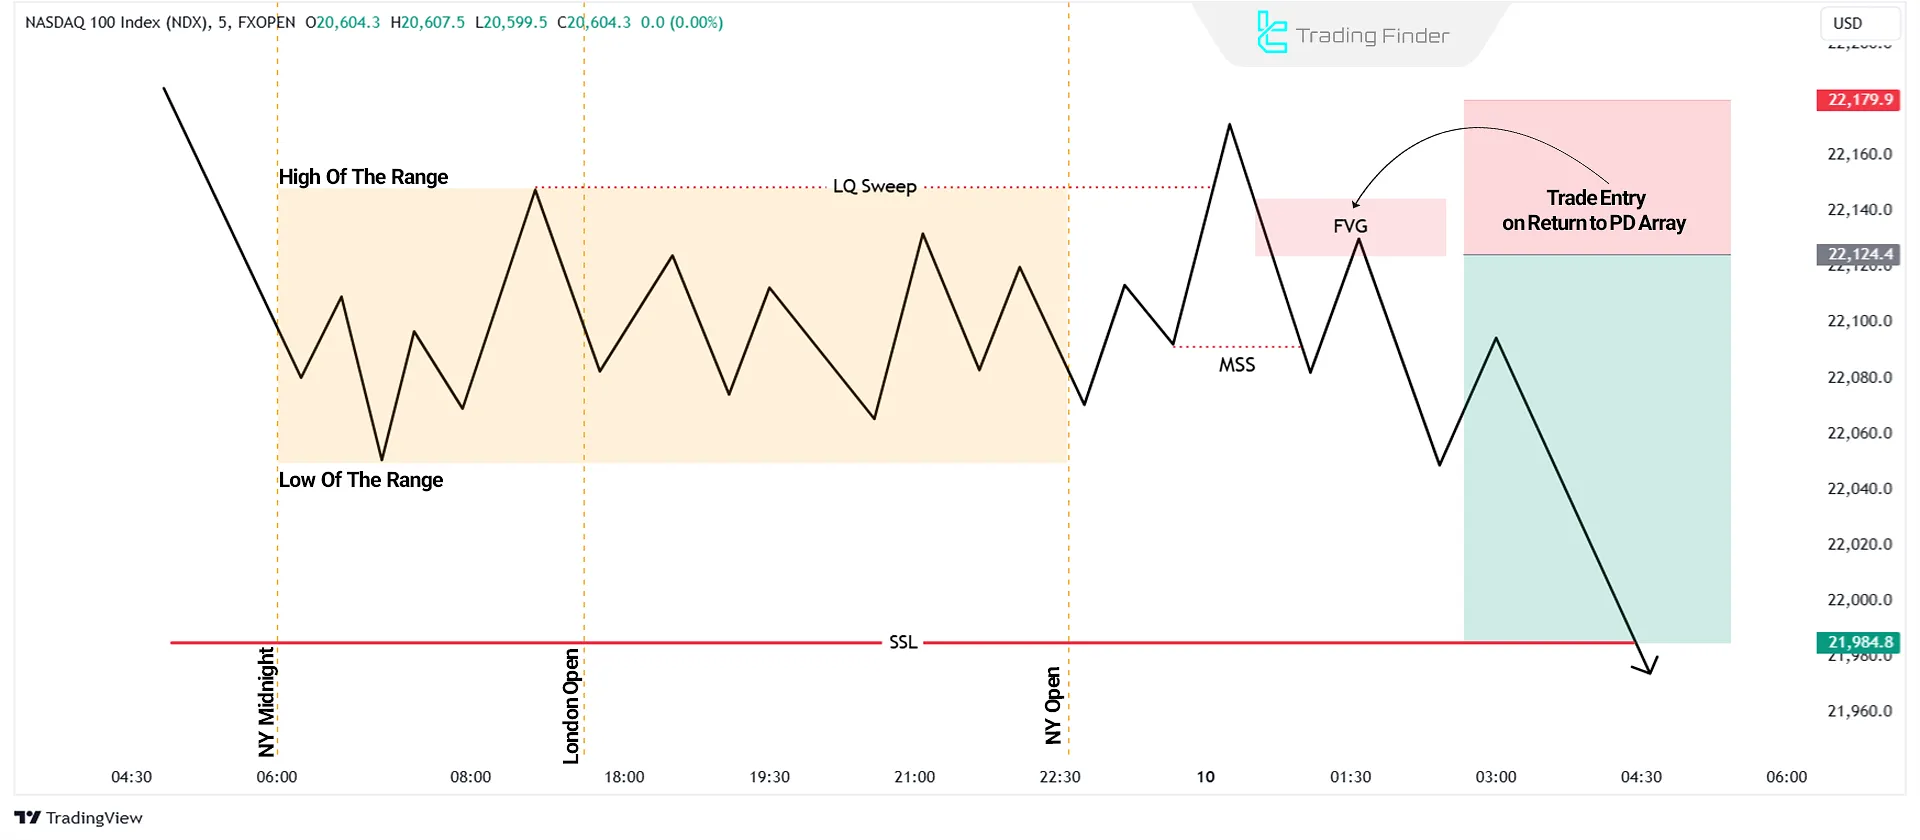
- Identify the Highs and Lows of the Price Range: Before the London session opens at 03:00 AM (New York time), mark the highs and lows of the price range from the midnight New York session opening (12:00 AM) to the London session opening;
- Wait for Price Movement: Once the London session begins, wait for the price to move to one of these levels (high or low) and sweep liquidity. This movement is called a Liquidity Sweep;
- Observe Market Structure Shifts (MSS): After the liquidity is swept, switch to lower timeframes (5, 3, or even 1 minute) and look for a market structure shift. This shift should align with the daily bias of the ICT strategy;
- Identify Key Areas (PD Array): Use tools to identify key areas like Fair Value Gaps (FVG), Order Blocks, or Breaker Blocks within premium or discount zones;
- Wait for Price to Retrace to the PD Array Area: Be patient until the price retraces to one of the identified areas;
- Execute the Trade: place the stop loss above the London session high for a sell trade and aim for the range low as the take profit; For a buy trade, set the stop loss below the London session low and target the range high for the take profit;
- Monitor the Trade: Manage the trade after entering, ensuring a minimum risk-to-reward (R:R) ratio of 1:3 is maintained.
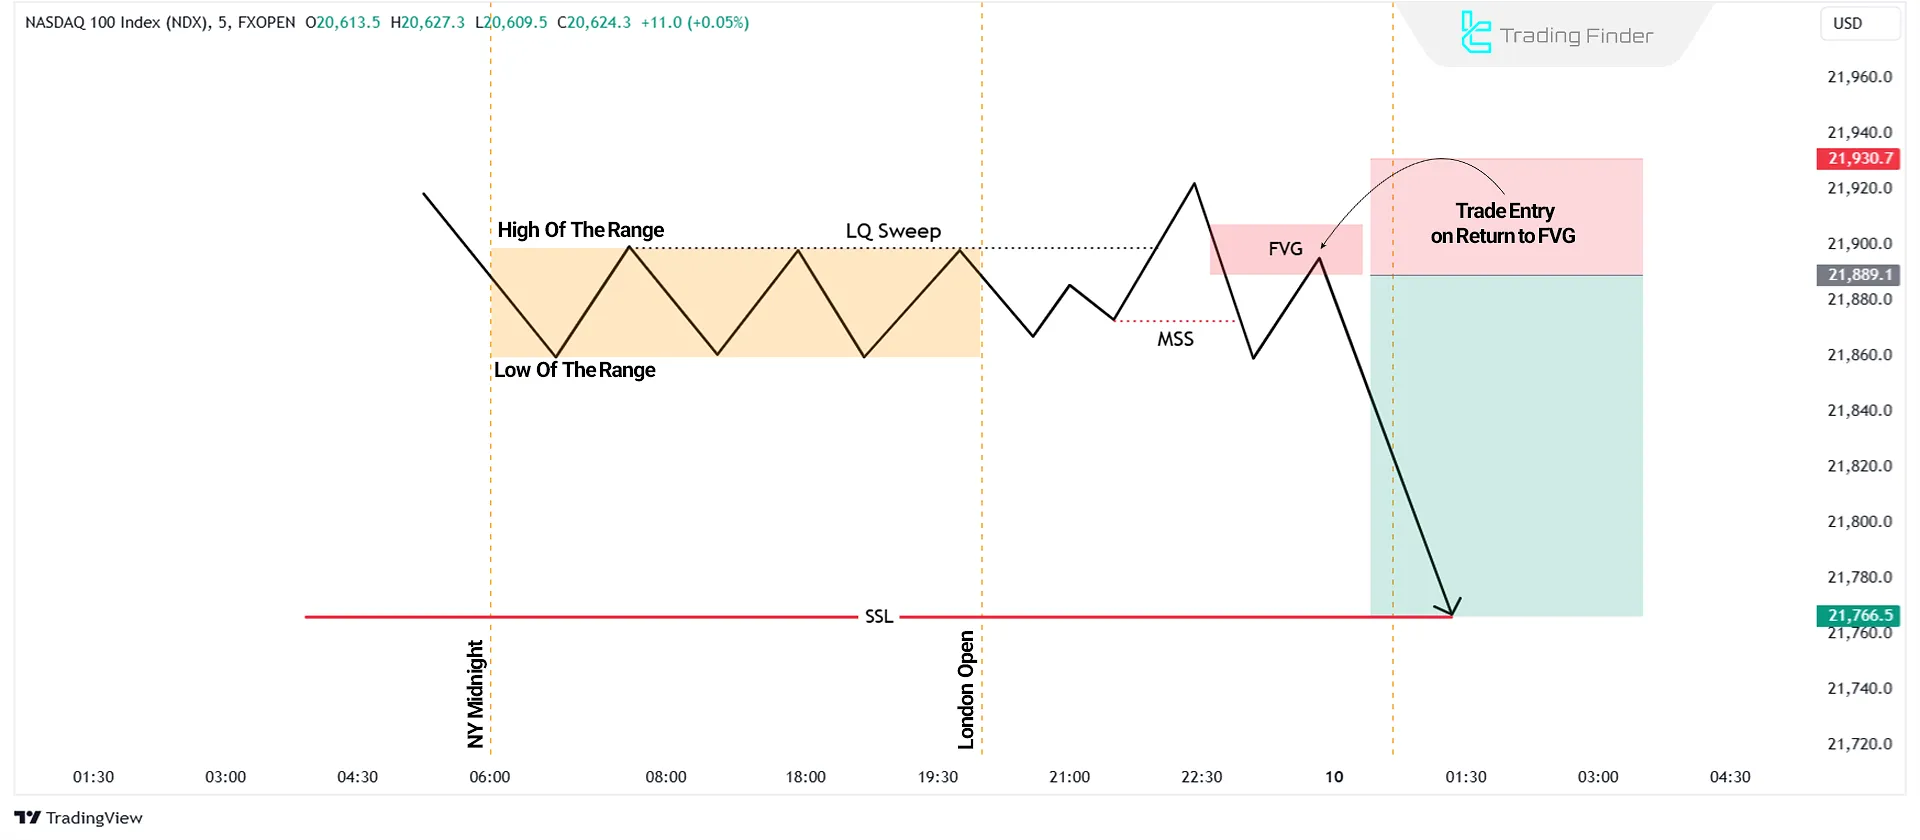
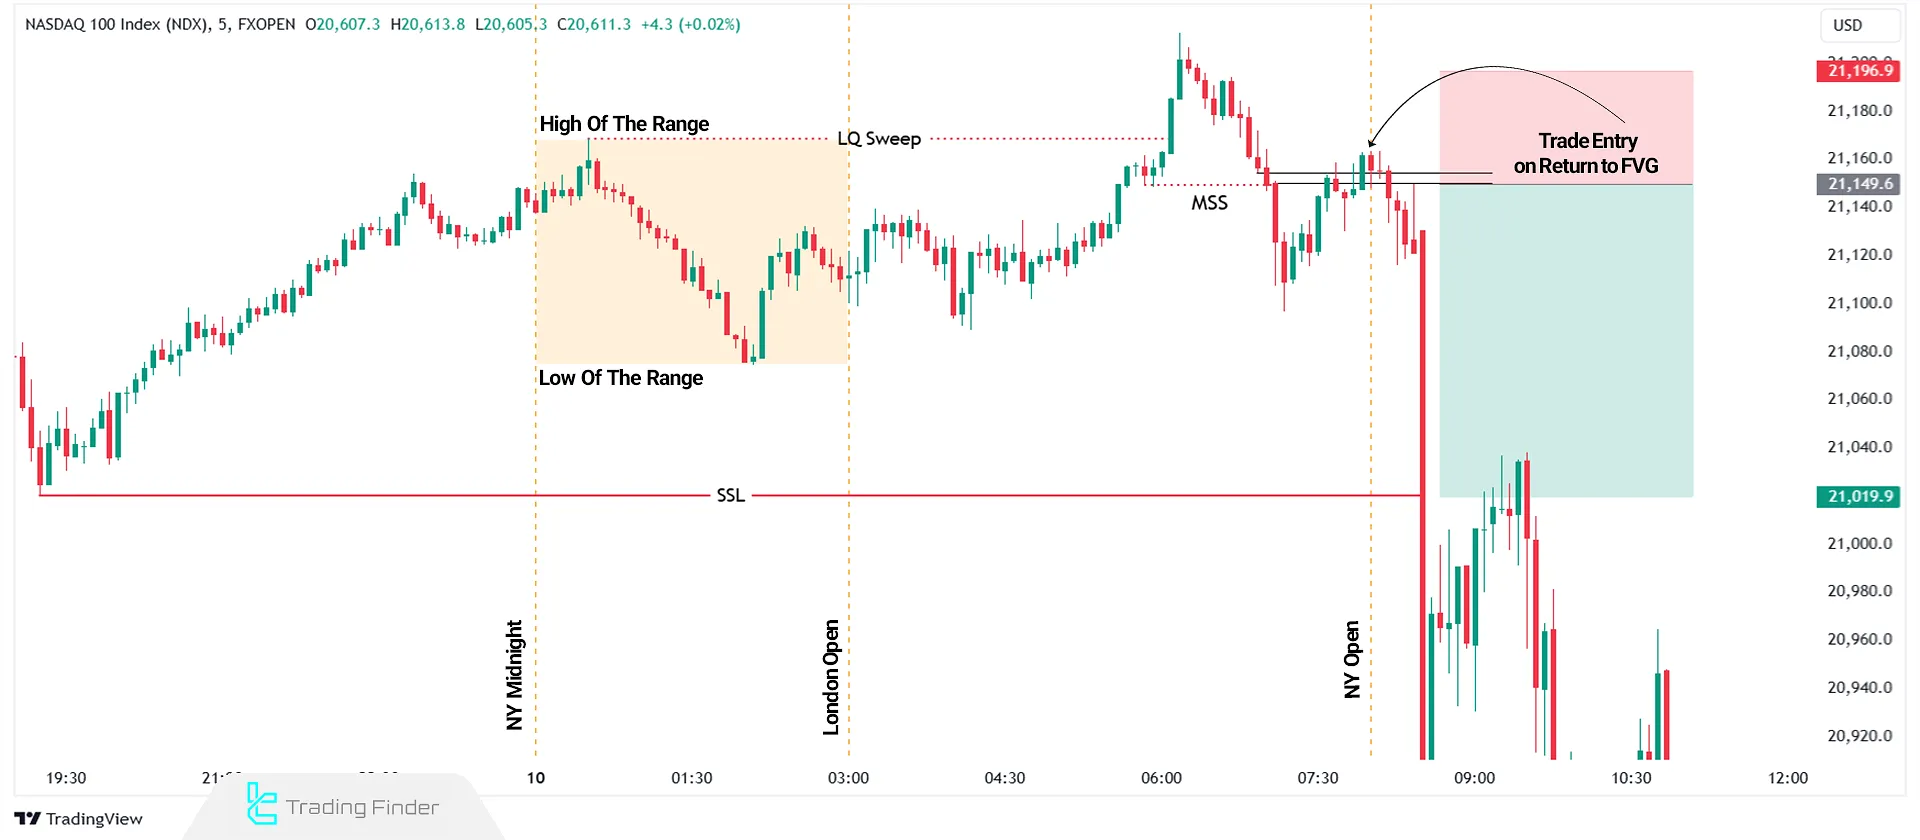
In the next chart of the 5-minute Nasdaq Index, the highs and lows of the price range before the London session opening are marked.
- During the London session, the price breaks above the range high, sweeping liquidity, and then starts a downtrend (market structure shift - MSS);
- As the New York session opens, the price retraces to the London range and encounters a Fair Value Gap (FVG).
At this stage:
- A sell trade is executed with a stop loss above the London high and take profit at the range low;
- The price sweeps the range low, and the trade successfully concludes.
The London session often exhibits high volatility and provides numerous profit-making opportunities. This is due to the simultaneous overlap with the London Kill Zone Open.
New York Session Trading Strategy
The New York session begins at 08:00 AM (New York Time). Two primary scenarios occur during this session:
- Liquidity is swept during the London session;
- The London session remains in a narrow range.
Each of these scenarios is detailed below for trading with the ICT 2022 Mentorship model during the New York session.
Liquidity Sweep in the London Session
At the start of the New York session, the market shows a direct reaction to the liquidity flow of the London session, especially when London has swept an important high or low beforehand.
In such conditions, New York first creates a corrective retracement and then follows the predominant direction set by London.
- When liquidity is swept in the London session, the New York session may initially experience a retracement before continuing the London session's trend;
- Draw a Fibonacci retracement from the London session low to the high before the New York retracement;
- Wait for the price to touch the Optimal Trade Entry (OTE) levels;
- Execute the trade only after confirming a market structure shift (MSS) in lower timeframes (e.g., 1 minute).
Remaining of the London Session in a Limited Range
Follow these steps to optimize trading opportunities when the London session is confined within a narrow range without significant movement:
- Identify the Highs and Lows of the Range: Mark the highs and lows of the price range from the London session opening at 12:00 AM to the New York session opening at 08:00 AM. This range represents the price movement during the London session where liquidity may remain unswept;
- Wait for the New York Session to Open: After the New York session begins, price typically sweeps liquidity on one side of the range (either the high or low);
- Identify the Liquidity Sweep: Monitor price movements to identify the liquidity sweep of the range high or low. This movement usually triggers a market structure shift;
- Observe Market Structure Shifts (MSS): After the liquidity sweep, switch to lower timeframes (e.g., 5, 3, or 1 minutes) and look for a market structure shift that aligns with the daily ICT bias;
- Identify Key Areas (PD Array): Use tools to determine key areas like Fair Value Gaps (FVG), Order Blocks, or Breaker Blocks. These areas are usually visible in lower timeframes and within discount or premium zones;
- Wait for Price Retracement: Be patient until the price retraces to the key areas identified in the previous step. This retracement often follows a market structure shift;
- Execute the Trade: For a buy trade, set the stop loss below the Order Block low and take profit at the range high; For a sell trade, place the stop loss above the Order Block high and target the range low for the take profit;
- Trade Management: Manage the trade to ensure a minimum risk-to-reward (R:R) ratio of 1:3 is maintained.
Example of ICT 2022 Mentorship Strategy in the New York Session
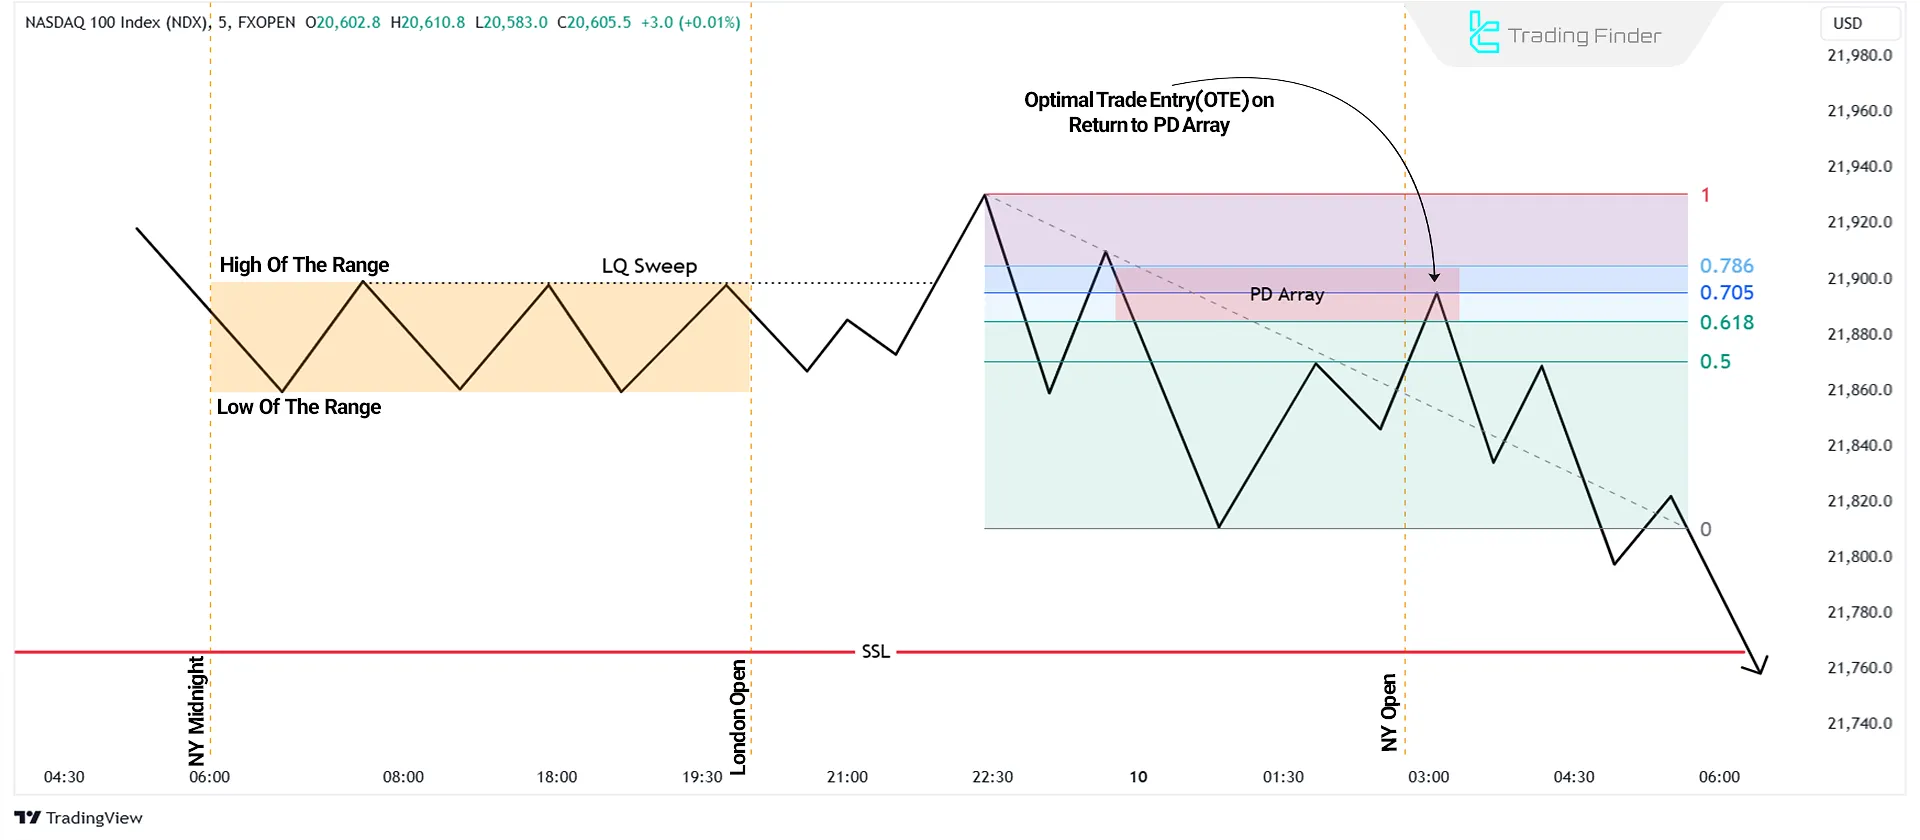
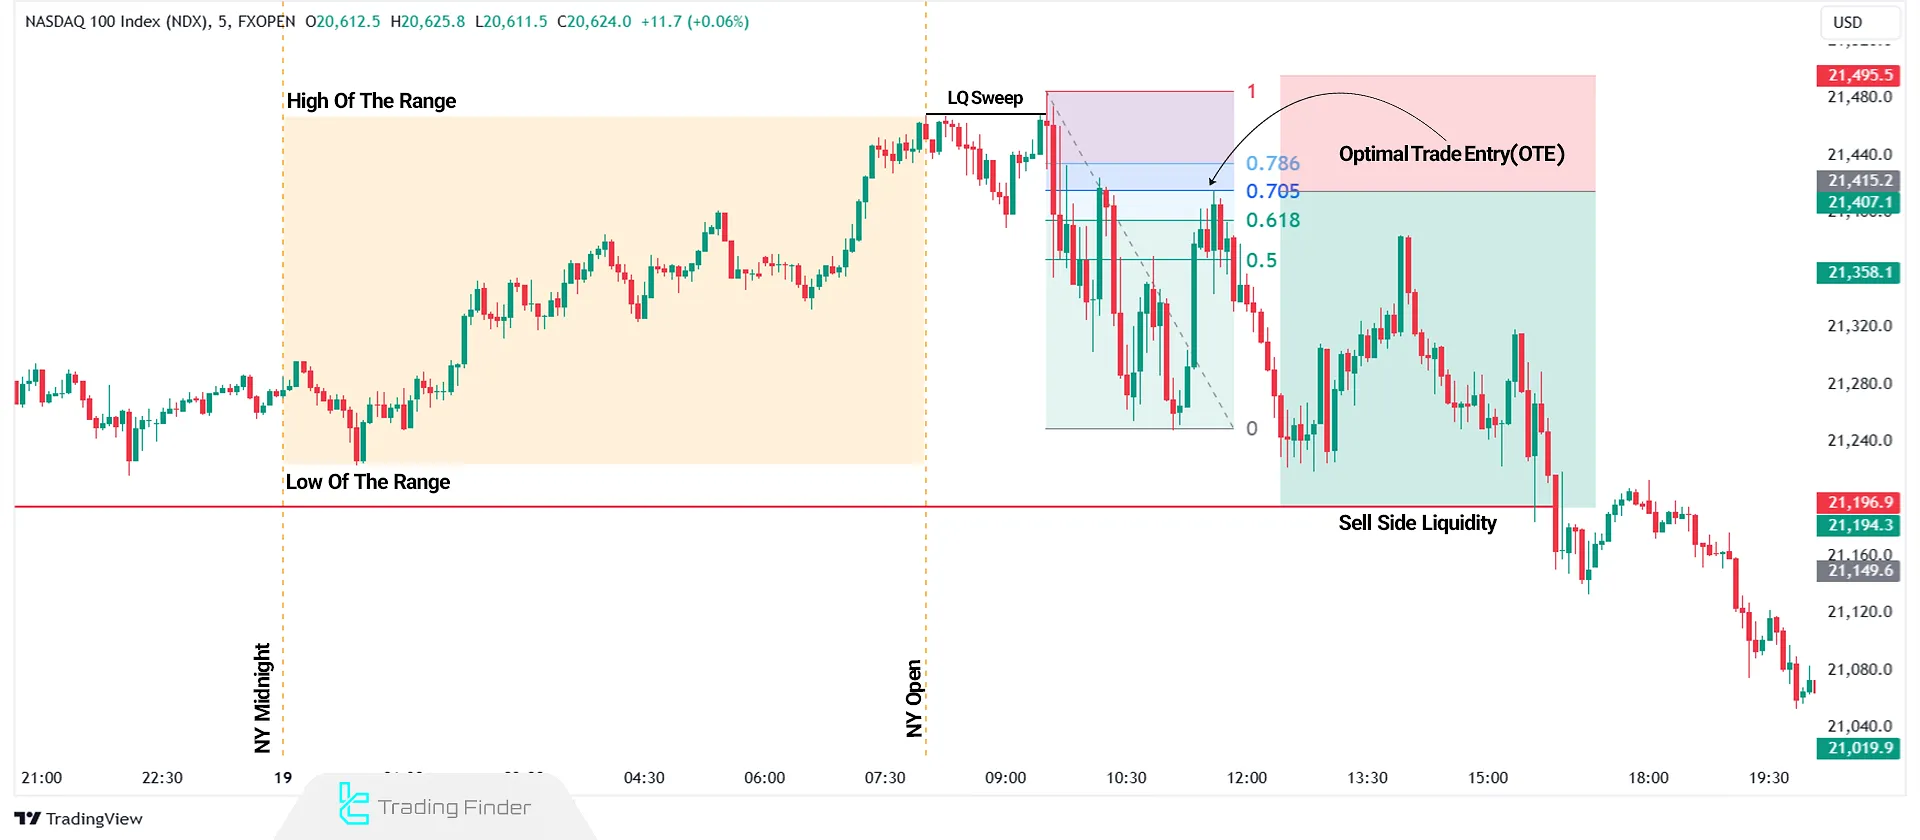
In the next 5-minute Nasdaq chart, the highs and lows of the price range before the New York session opening are marked.
- During the London session, no significant price movement or liquidity sweep occurs;
- After the New York session opens, the price first sweeps the range high;
- The price then retraces and experiences a market structure shift;
- Price returns to the optimal Fibonacci level (70.5%). At this point, a sell trade is executed; the stop-loss is placed a few pips above the most recent high, and the take-profit is set at the range low;
- The price successfully reaches the range low, completing the trade with a risk-to-reward ratio of 1:3.
Key Time Zones for the ICT 2022 Mentorship Trading Model
The table below shows the critical trading ICT kill zones for the ICT 2022 Mentorship setup in two time zones:
Time Zone | GMT | EST |
Midnight New York Open | 04:00 AM | 12:00 AM (Midnight) |
London Session Open | 07:00 AM | 03:00 AM |
New York Session Open | 12:00 PM | 08:00 AM |
New York Lunch Time | 04:00 PM - 06:00 PM | 12:00 PM - 02:00 PM |
London Session Close | 04:00 PM | 12:00 PM |
During the lunch hours of the New York session (12:00 PM to 02:00 PM EST), price typically moves within a defined range or retraces to a previous range. This behavior is due to decreased trading activity during lunch.
Traders can use the free TradingFinder session and kill zone indicators on MetaTrader and TradingView to manage the timing of their trades.
Key Timeframes in the ICT 2022 Mentorship Trading Strategy
Each timeframe in the ICT Mentorship 2022 trading setup, based on the ICT trading methods 2022, has a specific importance and application. In the table below, we explain the use of each timeframe:
Timeframe | Application |
Daily | Determining the ICT daily bias |
1H | Having an overall view in the higher timeframe |
15M | Identifying liquidity and price imbalance |
5, 3, and 1 minutes | Final confirmation and trade execution |
Killzones Toolkit Indicator for MetaTrader
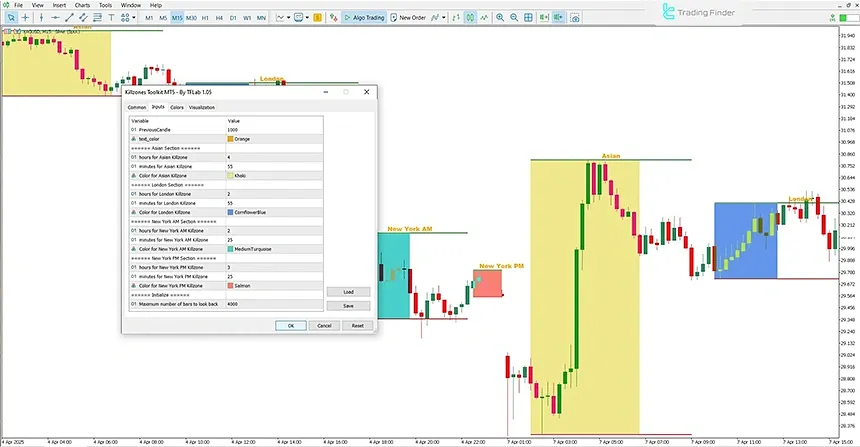
The Killzones Toolkit indicator, or the Kill Zone toolbox, is one of the advanced tools on the MetaTrader platform, designed to identify and display key market time ranges, suitable for ICT traders and other trading styles.
This indicator distinguishes the main trading sessions such as Tokyo, London, and New York, and displays the high-volatility areas known as Killzones on the chart as graphical colored boxes.
- Download Killzones Toolkit Indicator for MetaTrader 5
- Download Killzones Toolkit Indicator for MetaTrader 4
These zones usually occur during the hours when the highest liquidity and price volatility form in the market, making them especially important for scalpers, fast scalpers, and those interested in short-term trading.
The Kill Zone toolbox indicator falls under the category of liquidity, reversal, and breakout indicators in MetaTrader and is compatible with a wide range of timeframes from M1 to H4.
This tool can be used to analyze price behavior in the forex market, cryptocurrencies, stocks, forwards, and even corporate equities.
One of the standout advantages of this indicator is its ability to analyze price reactions during session overlaps for the ICT Mentorship strategy; the period when market liquidity is at its highest and major price movements often occur.
For example, on a 5-minute chart of a currency pair, the green box representing the New York AM session clearly acted as a strong support, and with the price reacting off the low of this zone, an upward trend formed.
In contrast, on the chart of another currency pair, the blue London kill zone acted as resistance and triggered the start of a downward price movement.
In the Inputs section, parameters such as the hour, minute, and color of each session can be modified. Additionally, options such as Previous Candle for setting the number of past candles and Text Color for adjusting the text color are provided.
Overall, the Killzones Toolkit for MetaTrader is a professional tool for accurately analyzing liquidity flow and daily volatility for ICT strategy traders and other trading styles.
Combining it with technical and fundamental analysis significantly increases the accuracy of trading decisions.
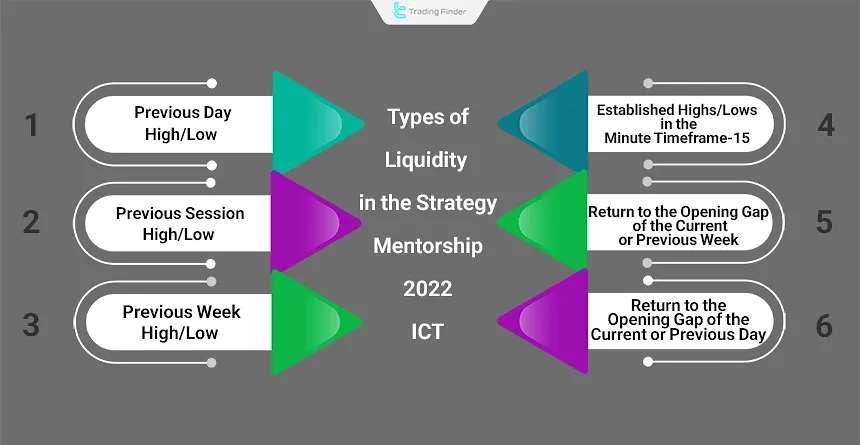
Types of Liquidity in the ICT Mentorship Strategy
- Previous Day High/Low (PDH/PDL): Refers to the highs and lows of the prior trading day;
- Previous Session High/Low: Refers to the highs and lows of the most recent session;
- Previous Week High/Low: Refers to the highs and lows of the last trading week;
- Consolidated Highs/Lows in the 15-Minute Timeframe: Represents liquidity accumulation visible in this timeframe;
- Return to the Gap of the Current or Previous Week’s Open (NWOG): Price returning to a weekly gap;
- Return to the Gap of the Current or Previous Day’s Open (NDOG): Price returning to a daily gap.
Optimal Trading Times for the ICT 2022 Mentorship Model
The opening of the New York session offers the best opportunities for trading using Michael’s ICT Mentorship trading model. This timeframe aligns with the New York AM Session Kill Zone and overlaps with the London session, leading to significant volatility.
Additionally, many major economic news releases occur during the New York session, making this timeframe one of the most ideal periods for trading.
For deeper mastery and better familiarity with the ICT 2022 Mentorship strategy, those interested can refer to the educational video on the inner circle trader YouTube channel.
Best Currency Pairs for the ICT 2022 Mentorship Model
In the ICT 2022 Mentorship strategy, three main areas indices, dollar-based currency pairs, and precious metals form a coherent foundation for implementing ICT models.
The combination of these markets, with their heavy liquidity, structured volatility, and predictable behavior during specific time phases, provides the conditions necessary for executing precise and targeted setups and creates the requirements for advancing a consistent and professional approach.
- Indices: E-mini S&P 500 and NASDAQ100 (NQ-Futures)
- Dollar-Based Currency Pairs: GBP/USD and EUR/USD
- Precious Metals: Gold (XAU/USD)
Conclusion
The ICT 2022 Mentorship trading strategy emphasizes key elements such as session timing, liquidity identification, and market structure shifts (MSS) to help traders analyze market movements with greater precision.
By focusing on critical points like Fair Value Gaps (FVG) and Order Blocks, the model facilitates high risk-to-reward ratio entries into trades.
The comprehensive flexibility of the ICT 2022 Mentorship trading model across different timeframes from daily charts to lower timeframes such as 1 minute makes it suitable for various trading styles (day trading, scalping, and swing trading).


