


In the concepts of Open High Low Close (OHLC) and Open Low High Close (OLHC), each candlestick represents a price trend in lower timeframes.
Combining elements such as Open, High, Low, and Close prices, these concepts help identify analytical patterns and trend reversals.
What Do OHLC Levels Represent?
In ICT trading methodology, the Open High Low Close (OHLC) analyzes price movements within a specific timeframe.
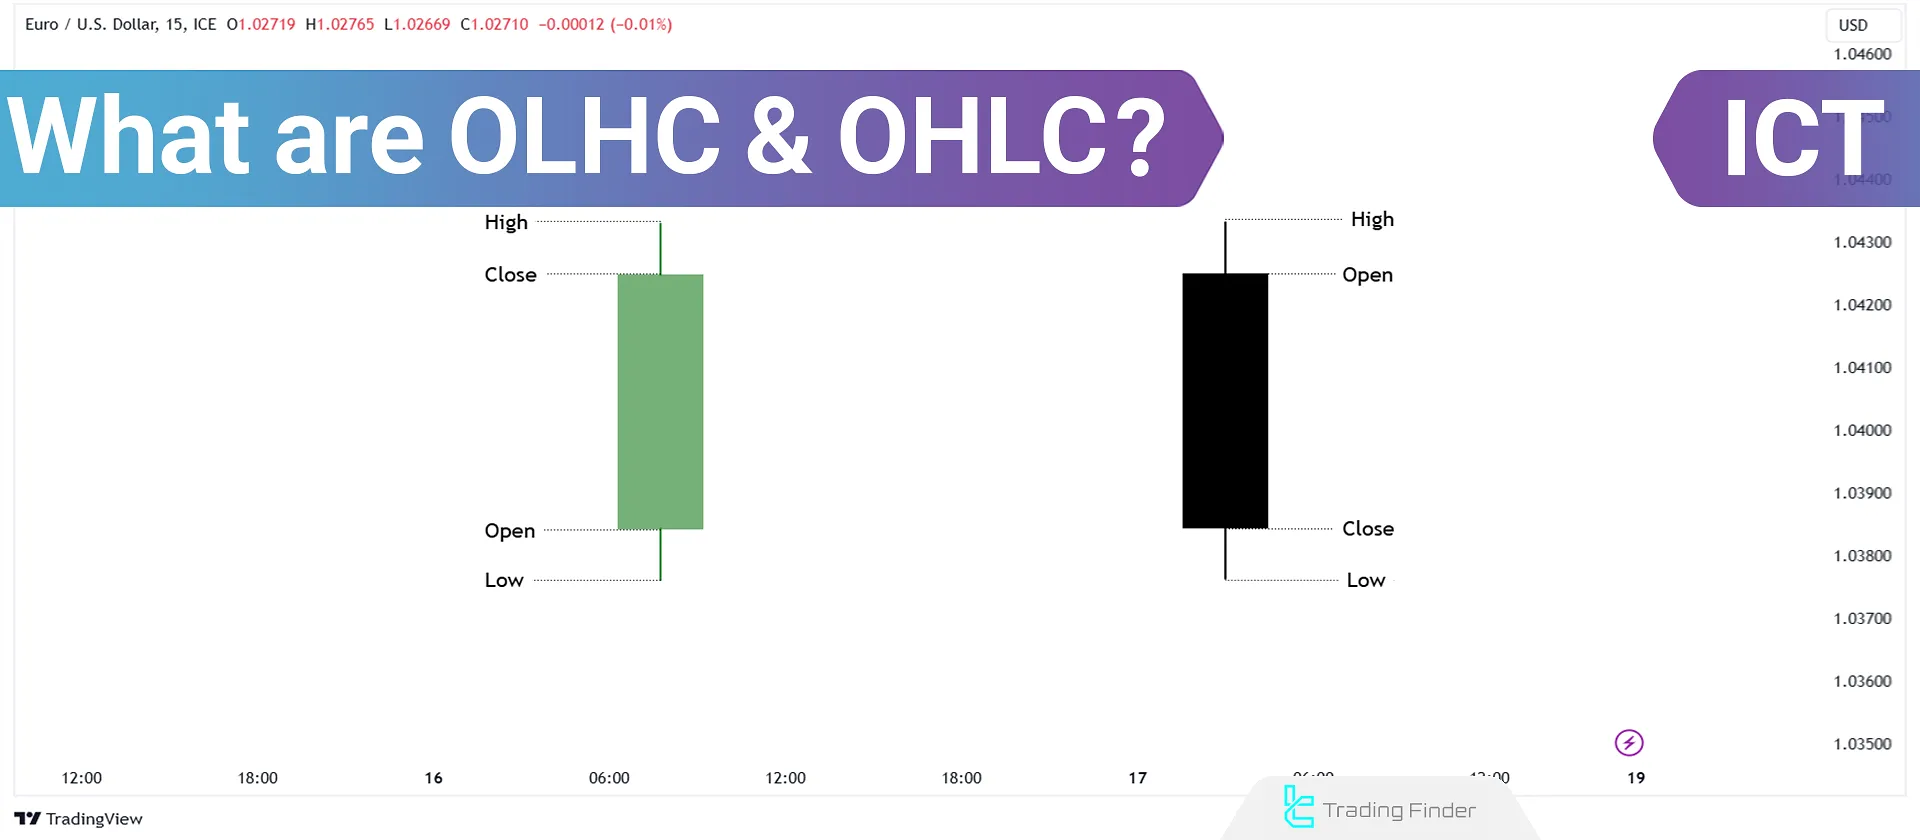
Each candlestick in a chart consists of four key components:
- Open Price: Price at which the candlestick begins.
- High Price: Highest price reached within that timeframe.
- Low Price: Lowest price reached within that timeframe.
- Close Price: Price at which the candlestick ends.
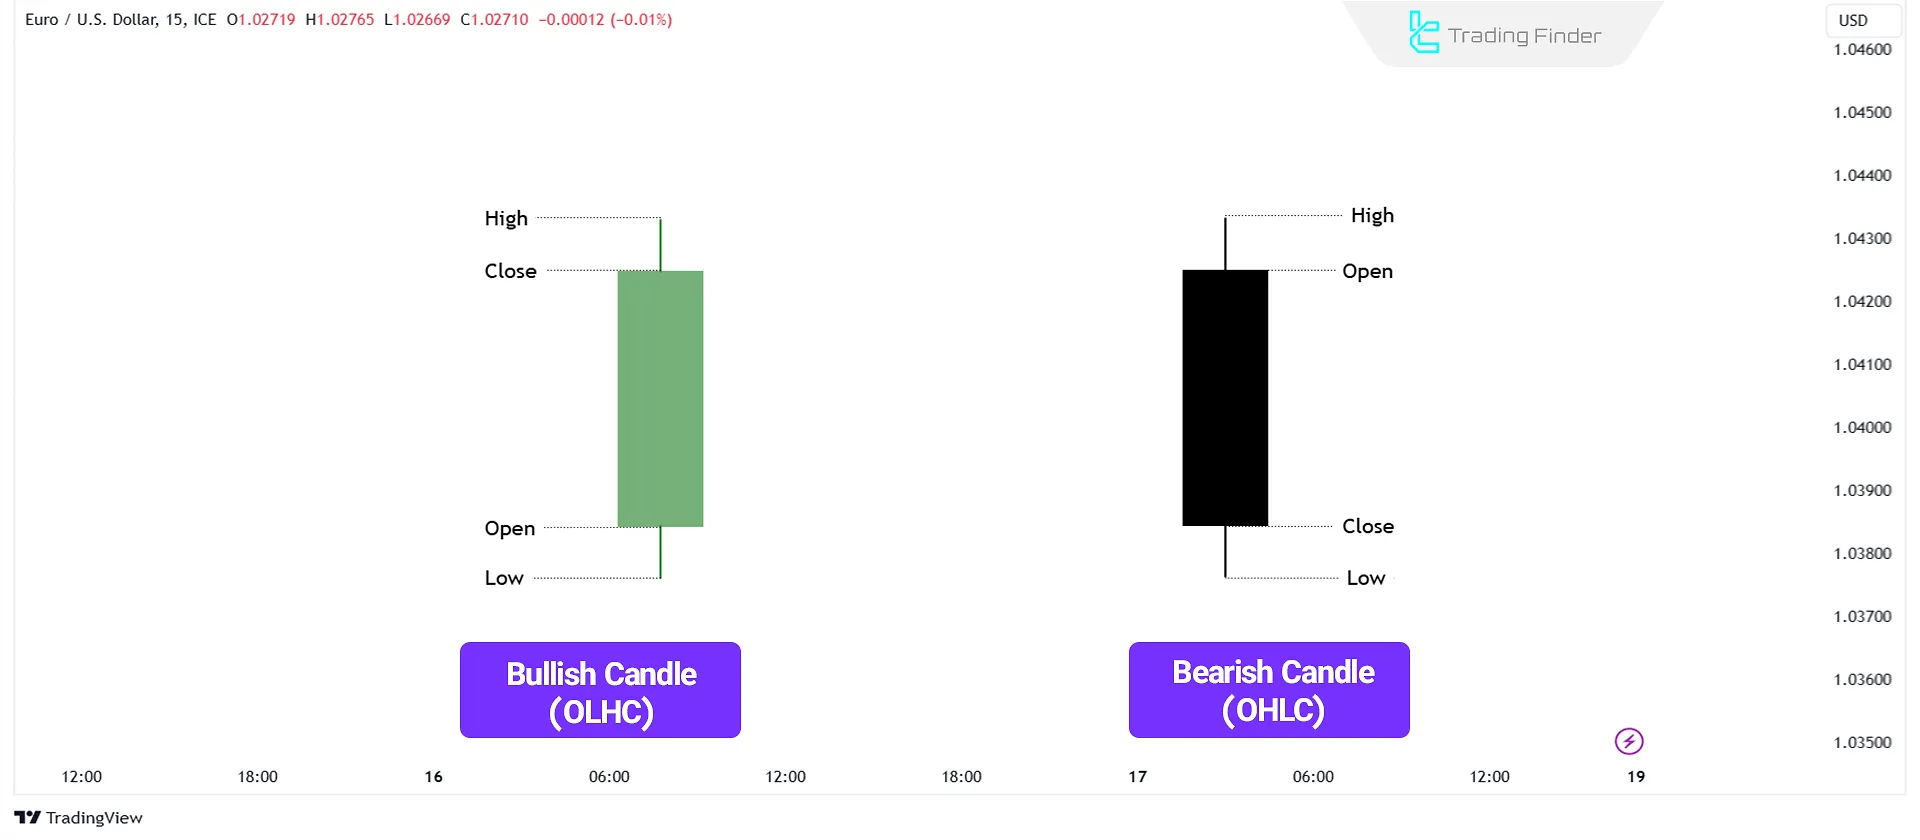
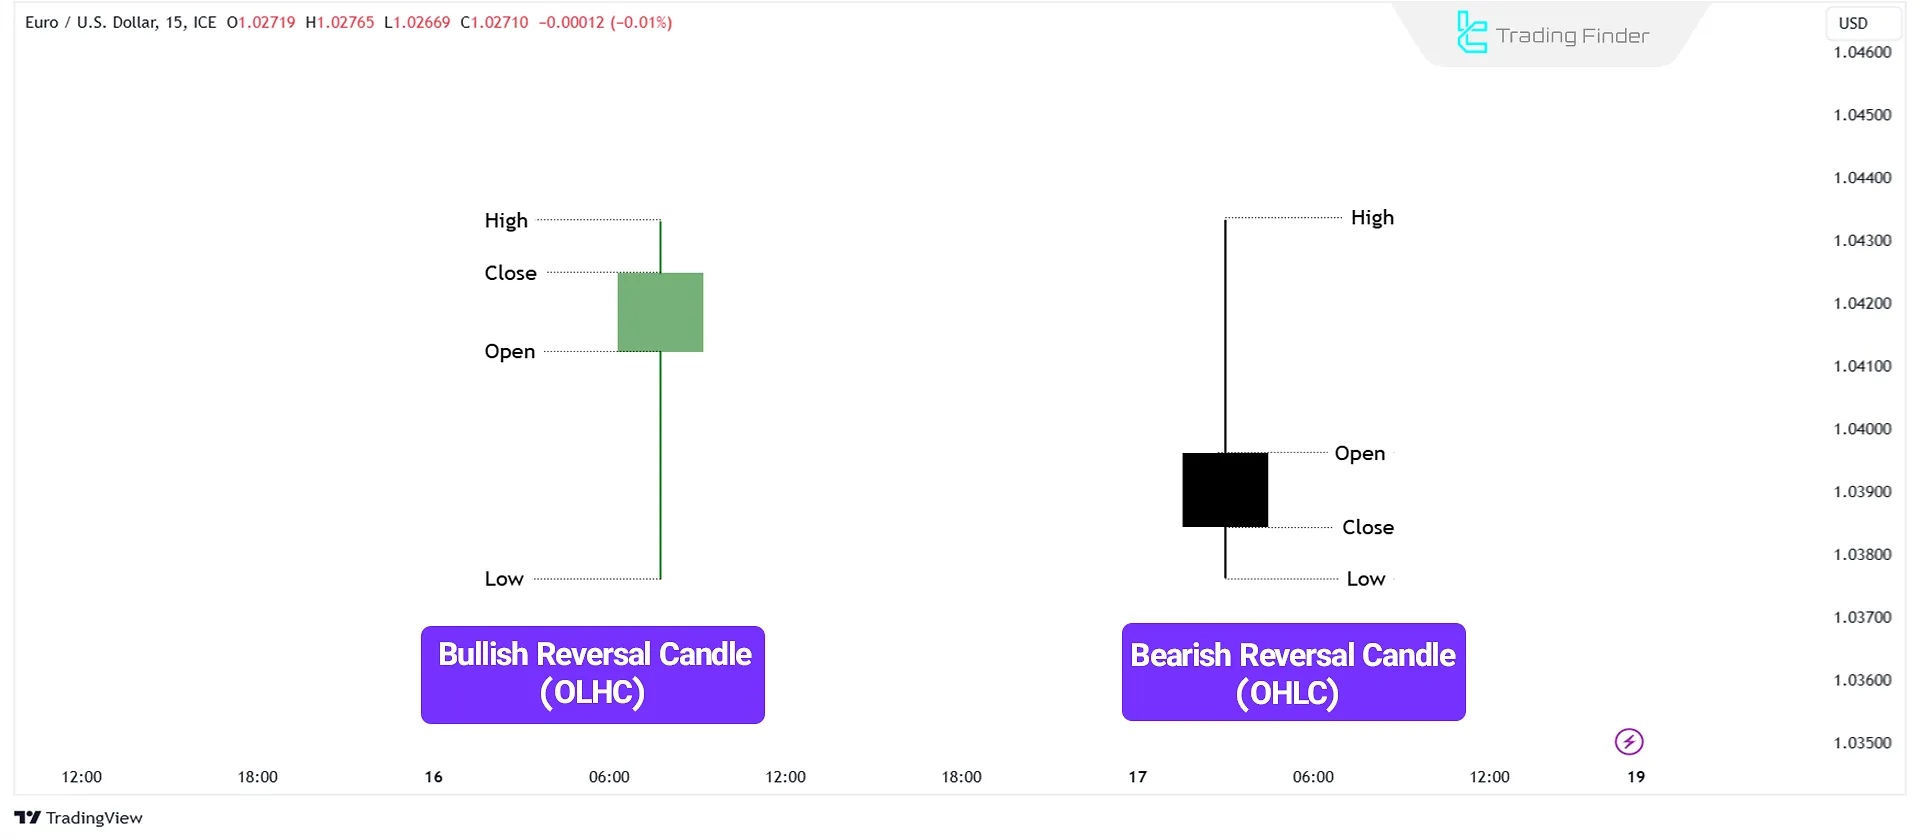
Bullish (OLHC) and Bearish (OHLC) Candlesticks
Candlesticks on charts of various markets, such as the forex market, are classified into two categories Bullish (OHLC) and Bearish (OLHC) based on the relationship between their opening and closing prices.
- A bullish candlestick forms when the closing price is higher than the opening price, indicating buyer dominance.
- A bearish candlestick forms when the closing price is lower than the opening price, signaling selling pressure.
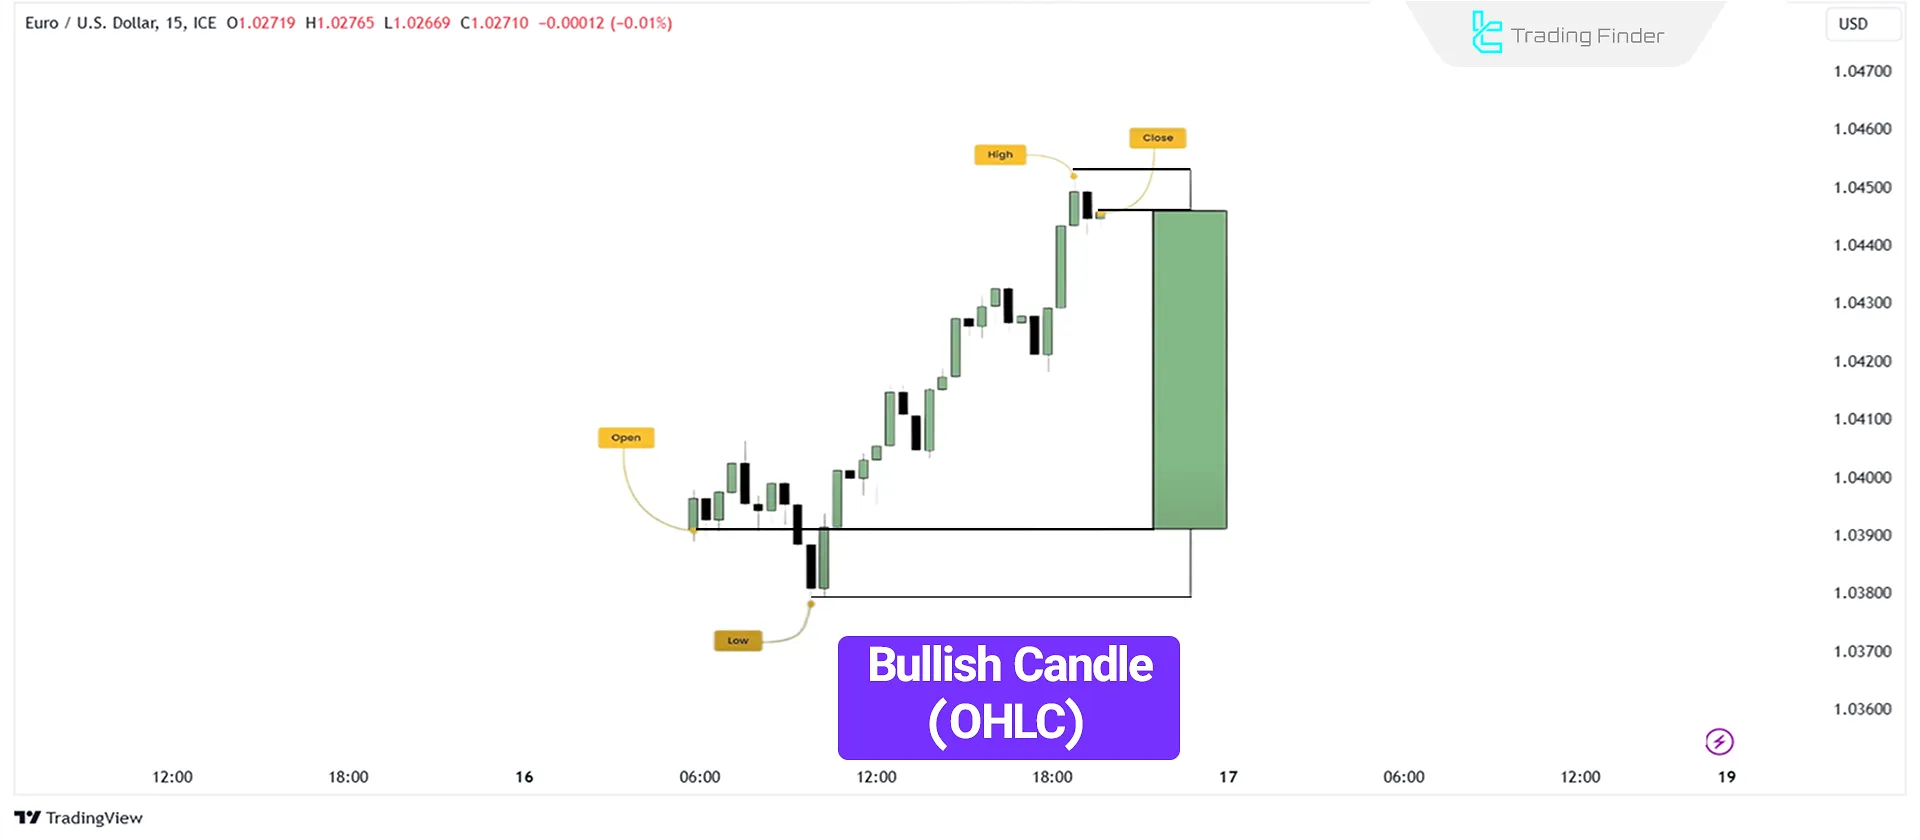
In technical analysis, as mentioned earlier, each candlestick represents a price trend on a lower time frame.
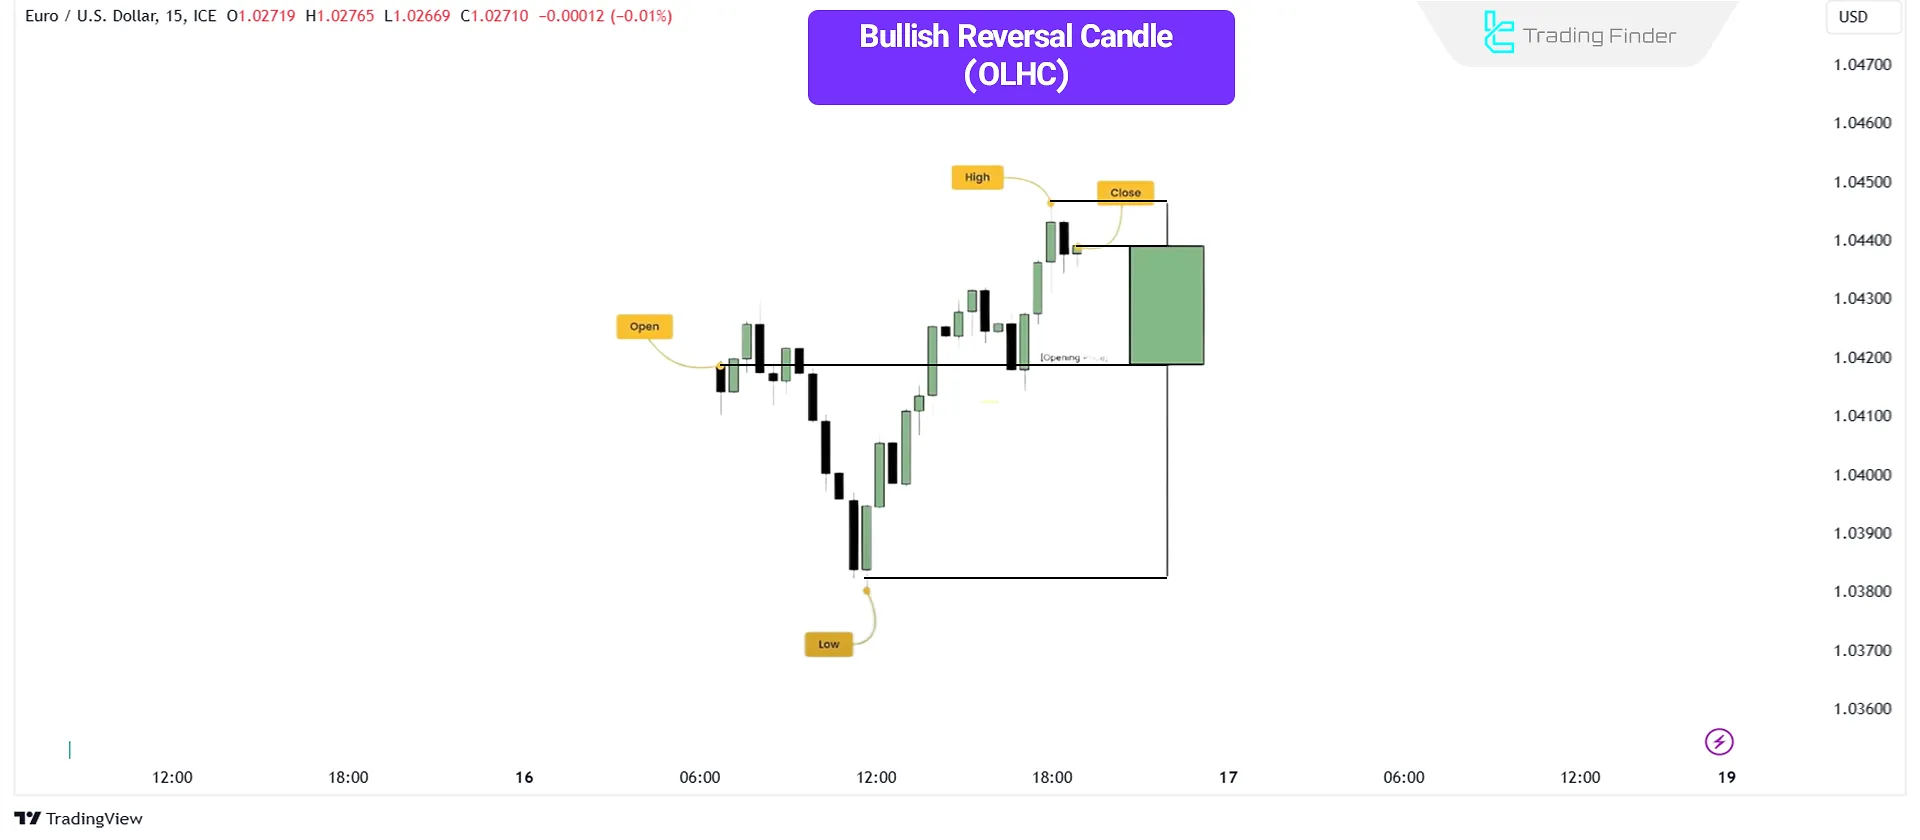
Bullish Candlestick (OLHC)
The price initially moves slightly downward, forming a Swing Low (the candlestick's Low).
Then, the price rises, creating the High, before closing with a slight downward movement.
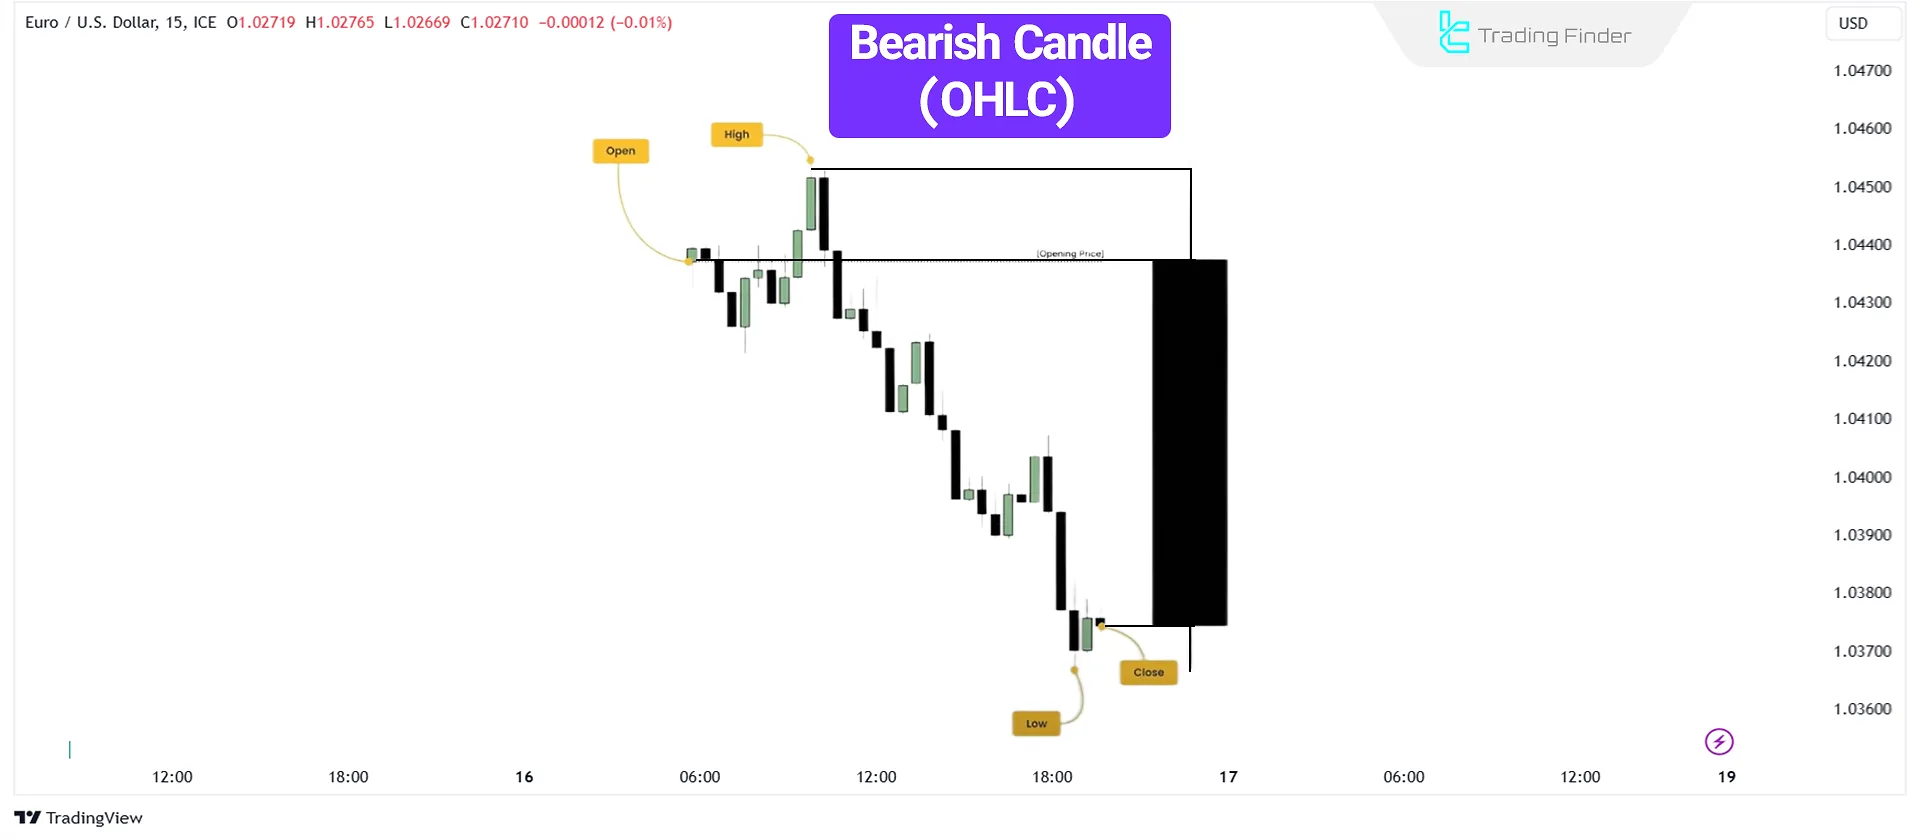
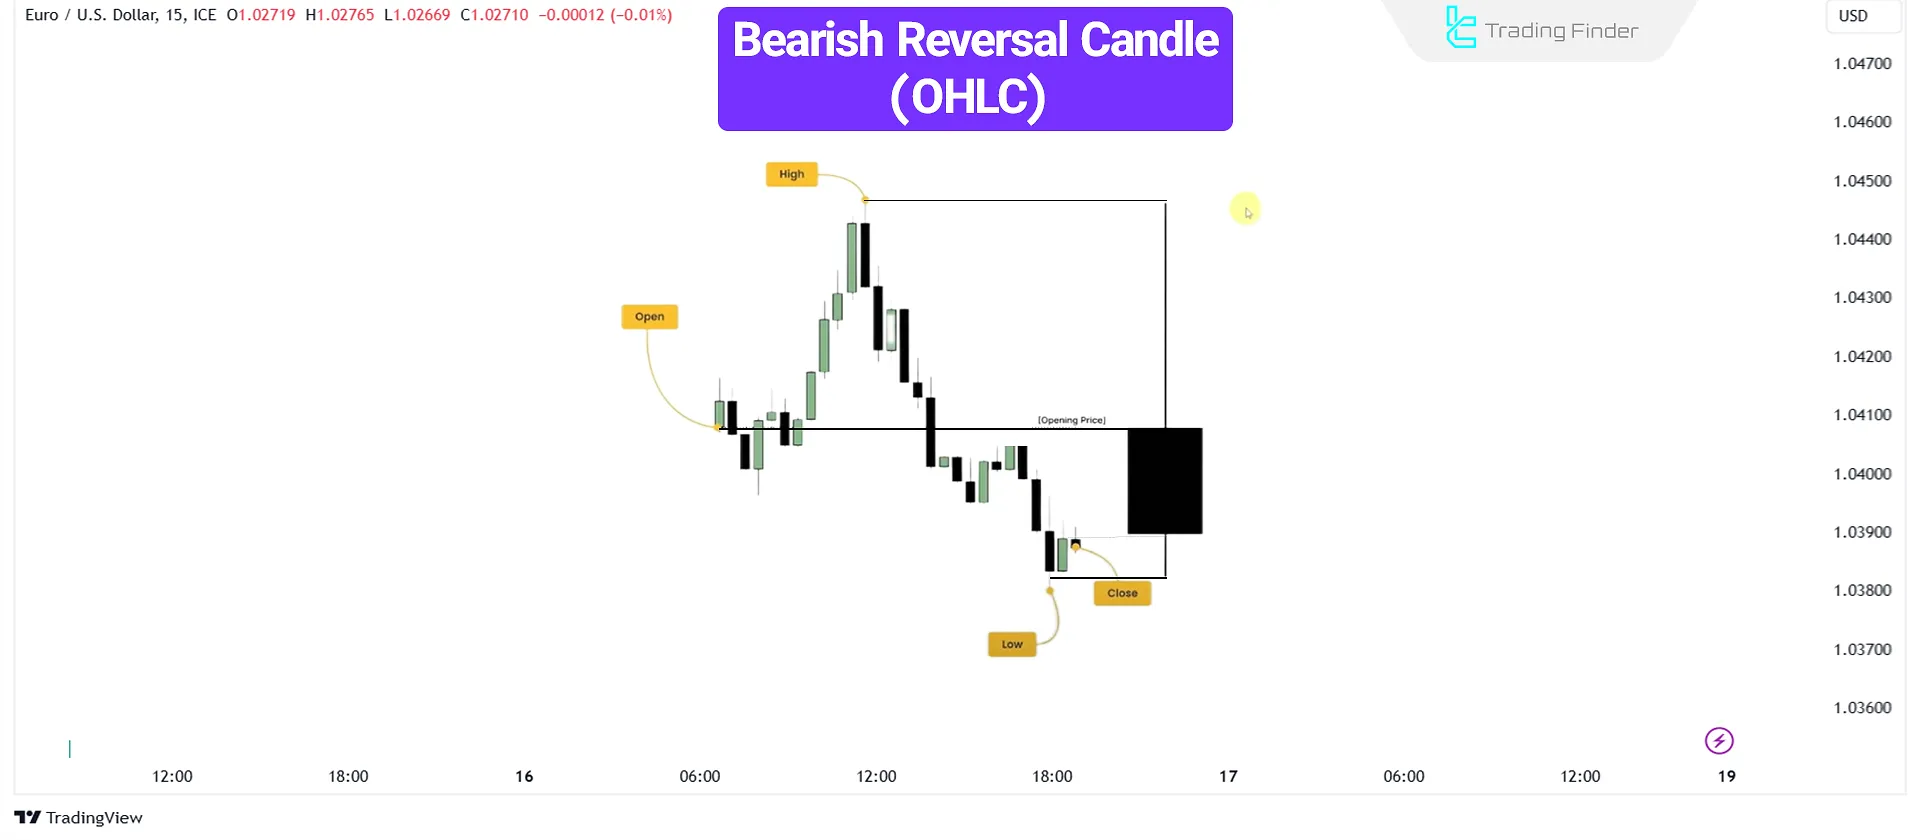
Bearish Candlestick (OHLC)
Price initially moves slightly upward, forming a Swing High (the candlestick's High). Then, it declines, creating the Low, before closing with a slight upward movement.
Types of ICT Candlesticks
There are three main types of candlesticks, each reflecting a specific price movement:
- Directional Candlesticks
- Reversal Candlesticks
- Indecision Candlesticks
Directional Candlesticks
Directional candlesticks (Directional Candle) indicate a strong price movement in one direction.
A bullish directional candlestick forms a low before moving upward and closing at a higher price. Its shadow is smaller than its body, reflecting intense buying pressure.
A bearish directional candlestick forms a high before declining and closing at a lower price. Like the bullish version, its shadow is smaller than its body, indicating intense selling pressure.
Reversal Candlesticks
Reversal candlesticks (Reversal Candle) signal a potential change in price direction.
A bullish reversal candlestick initially moves downward, then reverses and closes at a higher price, indicating buying pressure after a bearish movement.
A bearish reversal candlestick initially moves upward, then reverses and closes at a lower price, signaling selling pressure after a bullish movement.
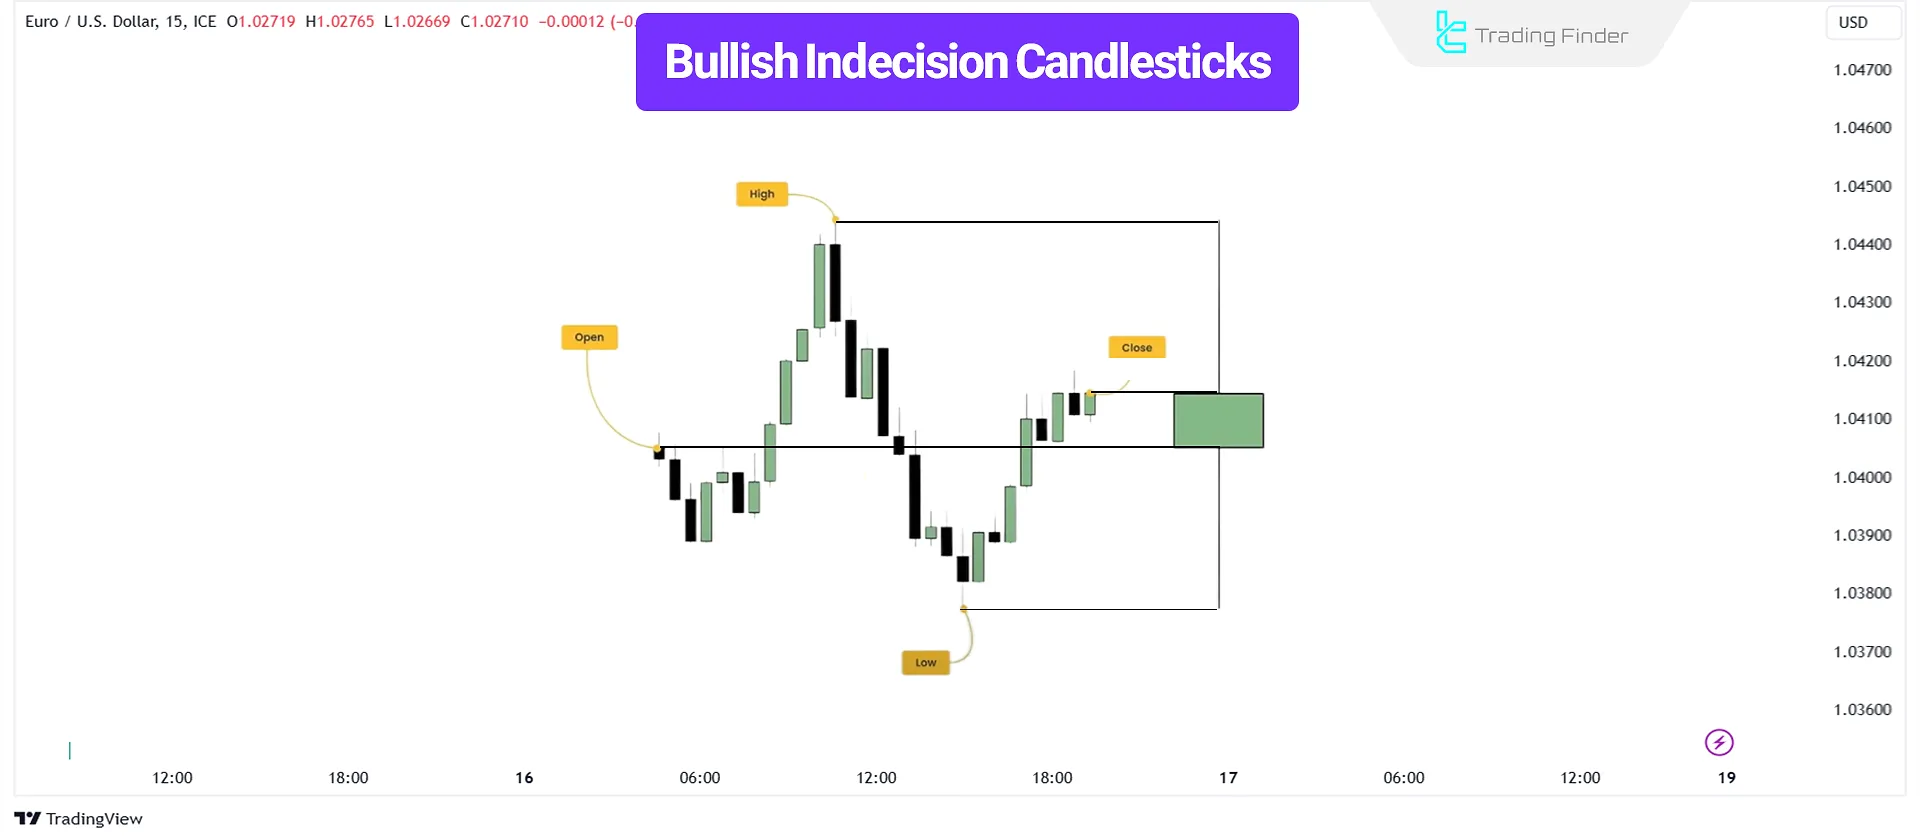
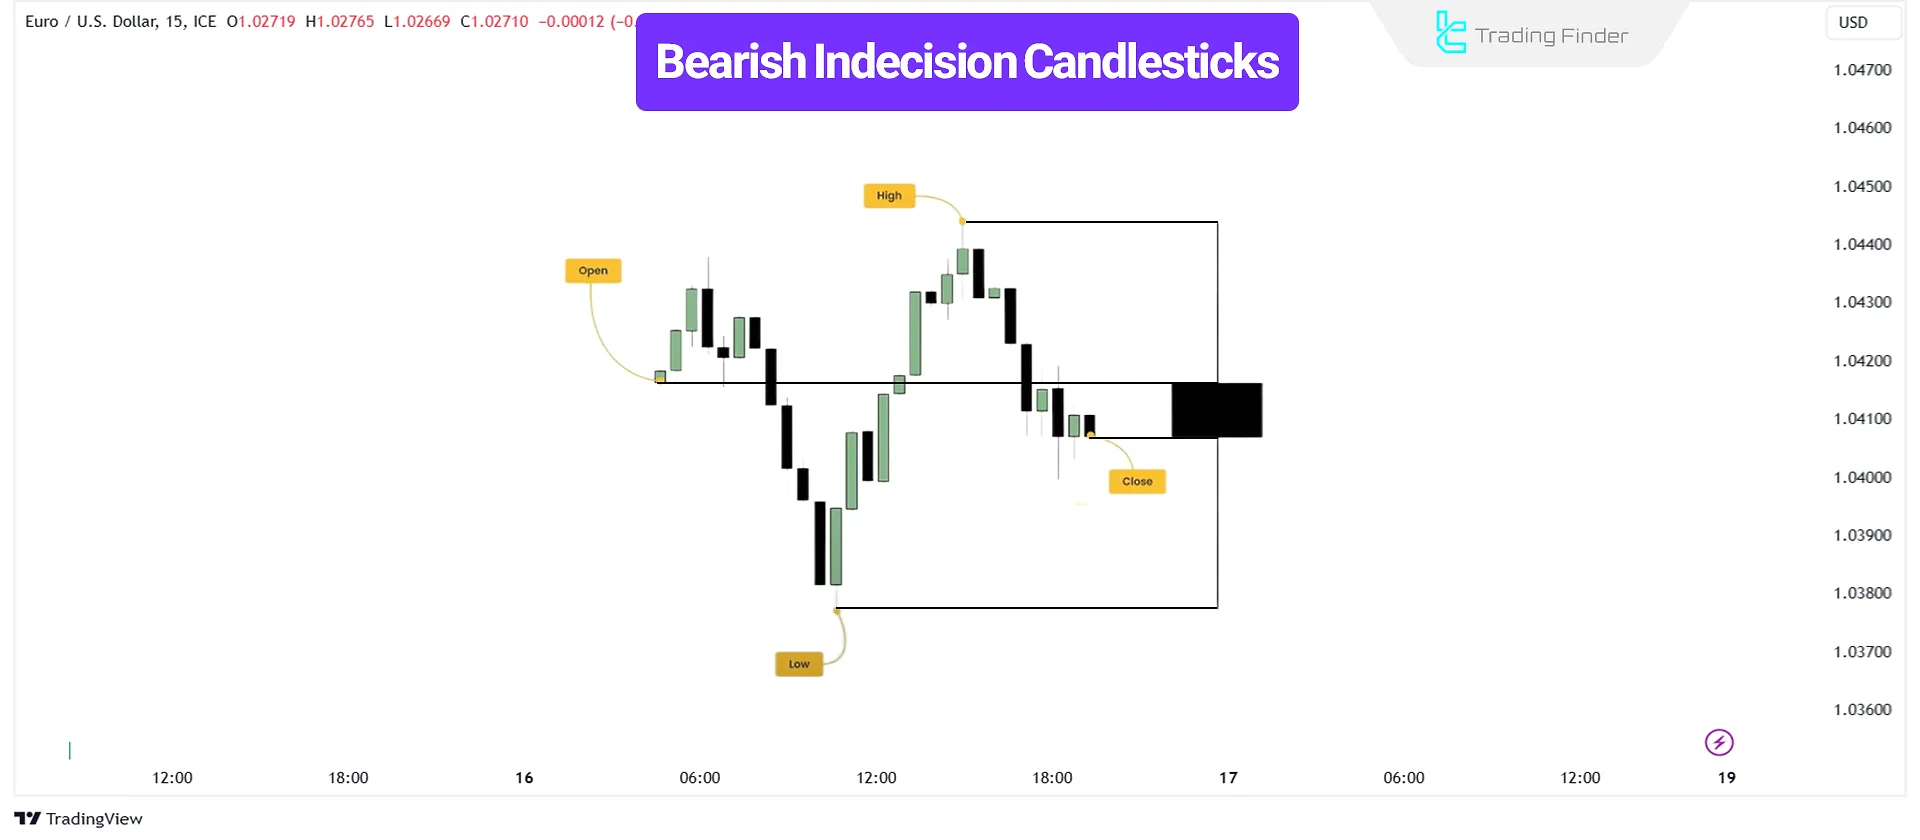
Indecision Candlesticks
Indecision candlesticks (Indecision Candles) reflect market uncertainty, often appearing during consolidation phases.
These candlesticks typically have small bodies and long wicks on both sides, indicating an equal balance between buyers and sellers.
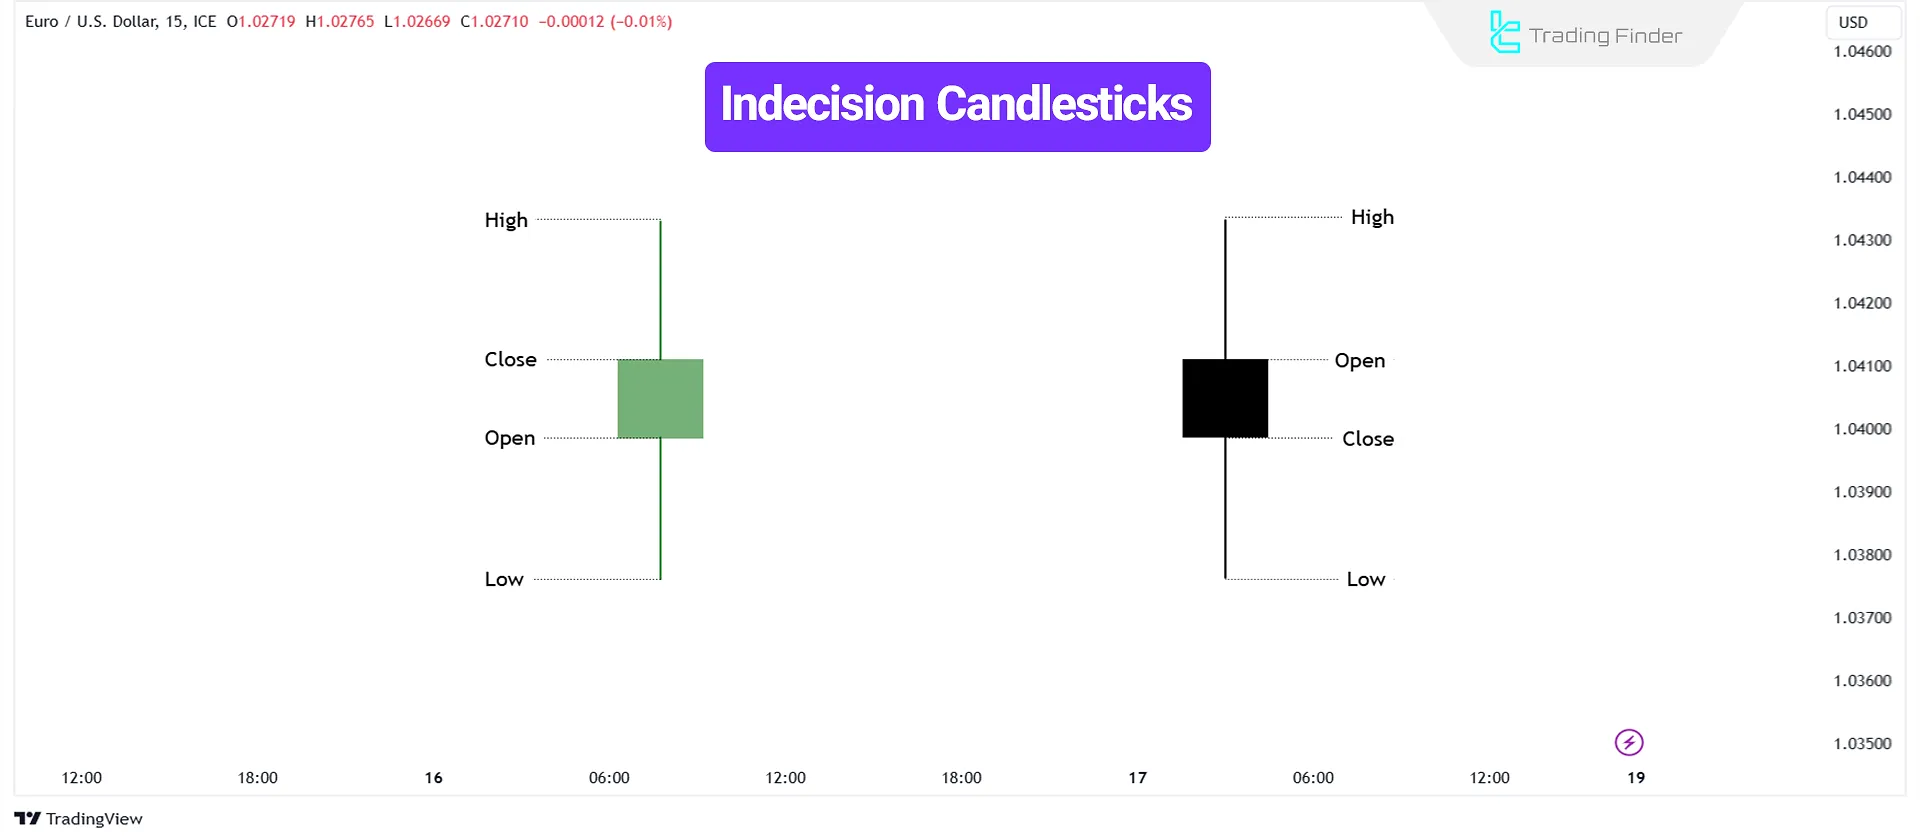
A bullish indecision candlestick moves both upward and downward before closing near or slightly above the opening price.
Although it suggests market hesitation, it sometimes reflects buyer intent for an upward move.
A bearish, indecisive candlestick moves upward and downward before closing near or slightly below the opening price.
While this signals market indecision, it may also indicate seller dominance for a potential decline.
Practical Use in Trading
- Directional Candlesticks help identify strong trends. Multiple consecutive directional candles indicate trend continuation, providing a potential entry signal.
- Reversal Candlesticks appear after strong trends and can predict possible reversals, signaling a shift in market sentiment.
- Indecision Candlesticks represent consolidation periods or uncertainty in market direction.
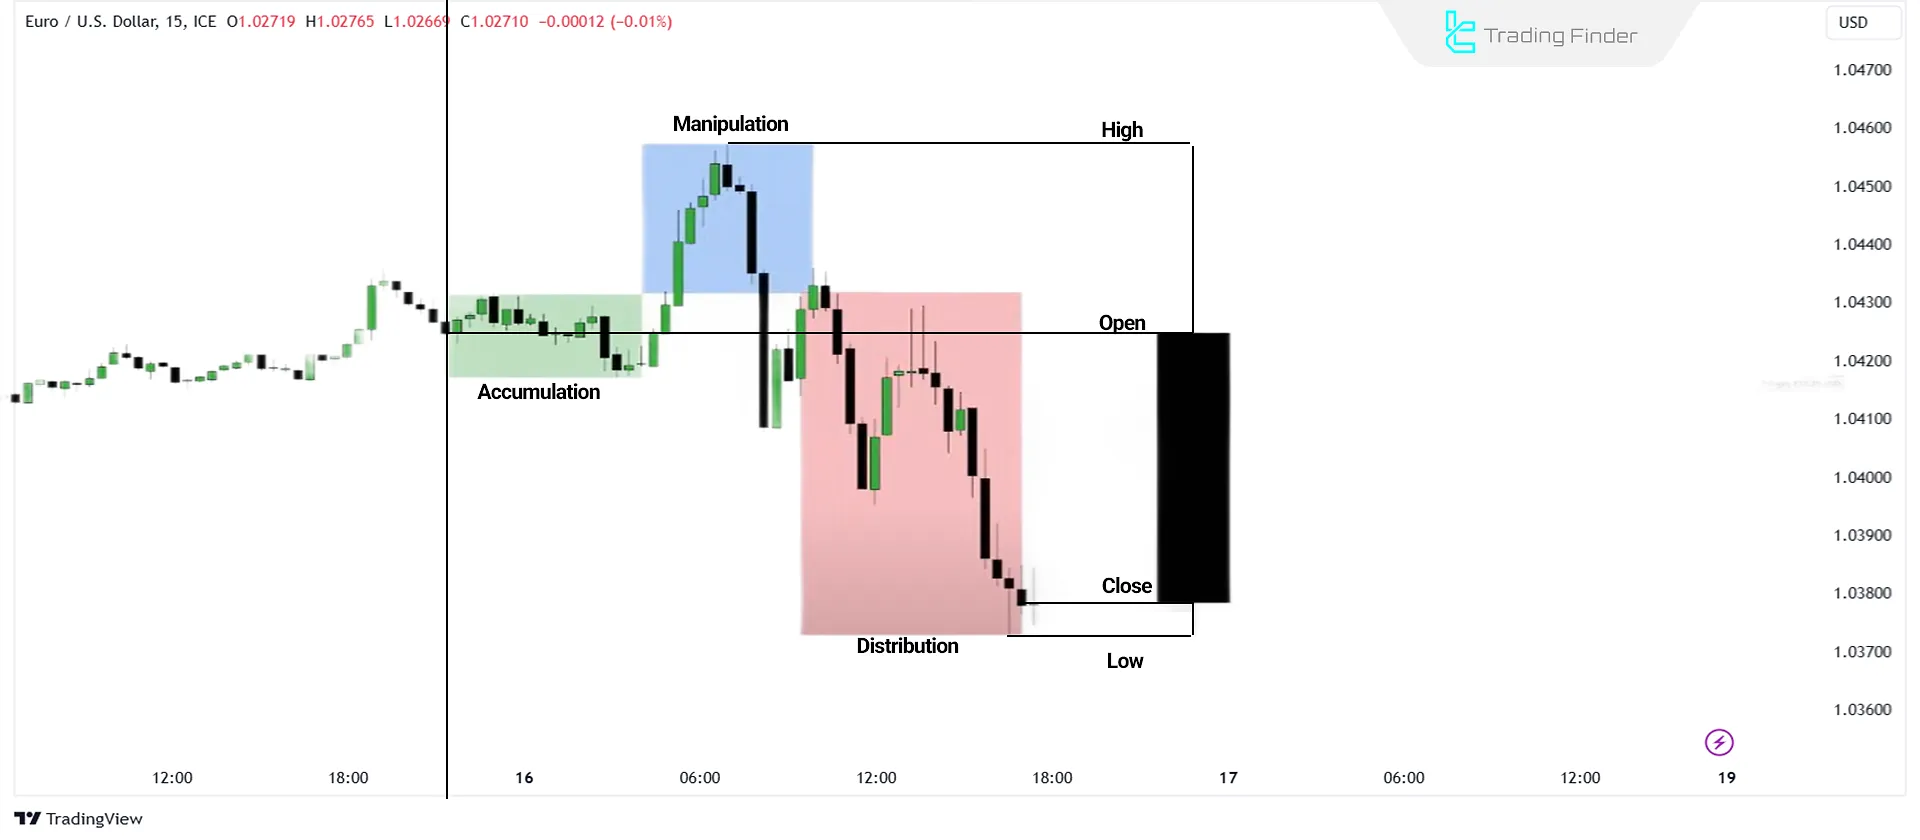
Analyzing AMD (Accumulation, Manipulation, and Distribution) in Candlestick Patterns
Another perspective on these patterns is through the Accumulation, Manipulation, and Distribution in Power of Three - PO3 model.
Initially, the price may consolidate near the opening price, representing accumulation. When the price moves beyond this level, it indicates manipulation.
After this manipulation phase, the price typically experiences a sell-off, forming a low before closing.
Conclusion
The OHLC and OLHC concepts of ICT methodology are fundamental tools for analyzing price movements and identifying trading patterns.
Each candlestick represents price behavior within lower timeframes, revealing trend shifts and market maker activity.
Directional candlesticks define strong market trends, reversal candlesticks signal potential trend changes, and indecision candlesticks indicate price consolidation periods.


