


Order Block in the ICT style is recognized as one of the key decision-making zones for Smart Money trading and represents an area where a significant volume of order blocks has been accumulated before the start of a powerful move.
This zone is the last point at which large players place substantial orders before the continuation or reversal of the trend, and for this reason, it leaves a clear footprint on the chart.
When price moves away from this area and creates an explosive or impulsive move, the supporting strength of smart money at that level becomes apparent.
Upon the price returning again, this zone provides ICT-style traders with a low-risk opportunity in the direction of the main move and offers a more precise entry point within the market structure.
What is an ICT Order Block?
An ICT Order Block represents a price chart area with significant buying or selling pressure, leading to a sudden strong upward or downward movement in the market.
Retail traders consider these strong movements as the footprint of smart money; therefore, they wait for the price to return to these order blocks so they can buy and sell alongside large institutions such as banks and achieve profits.
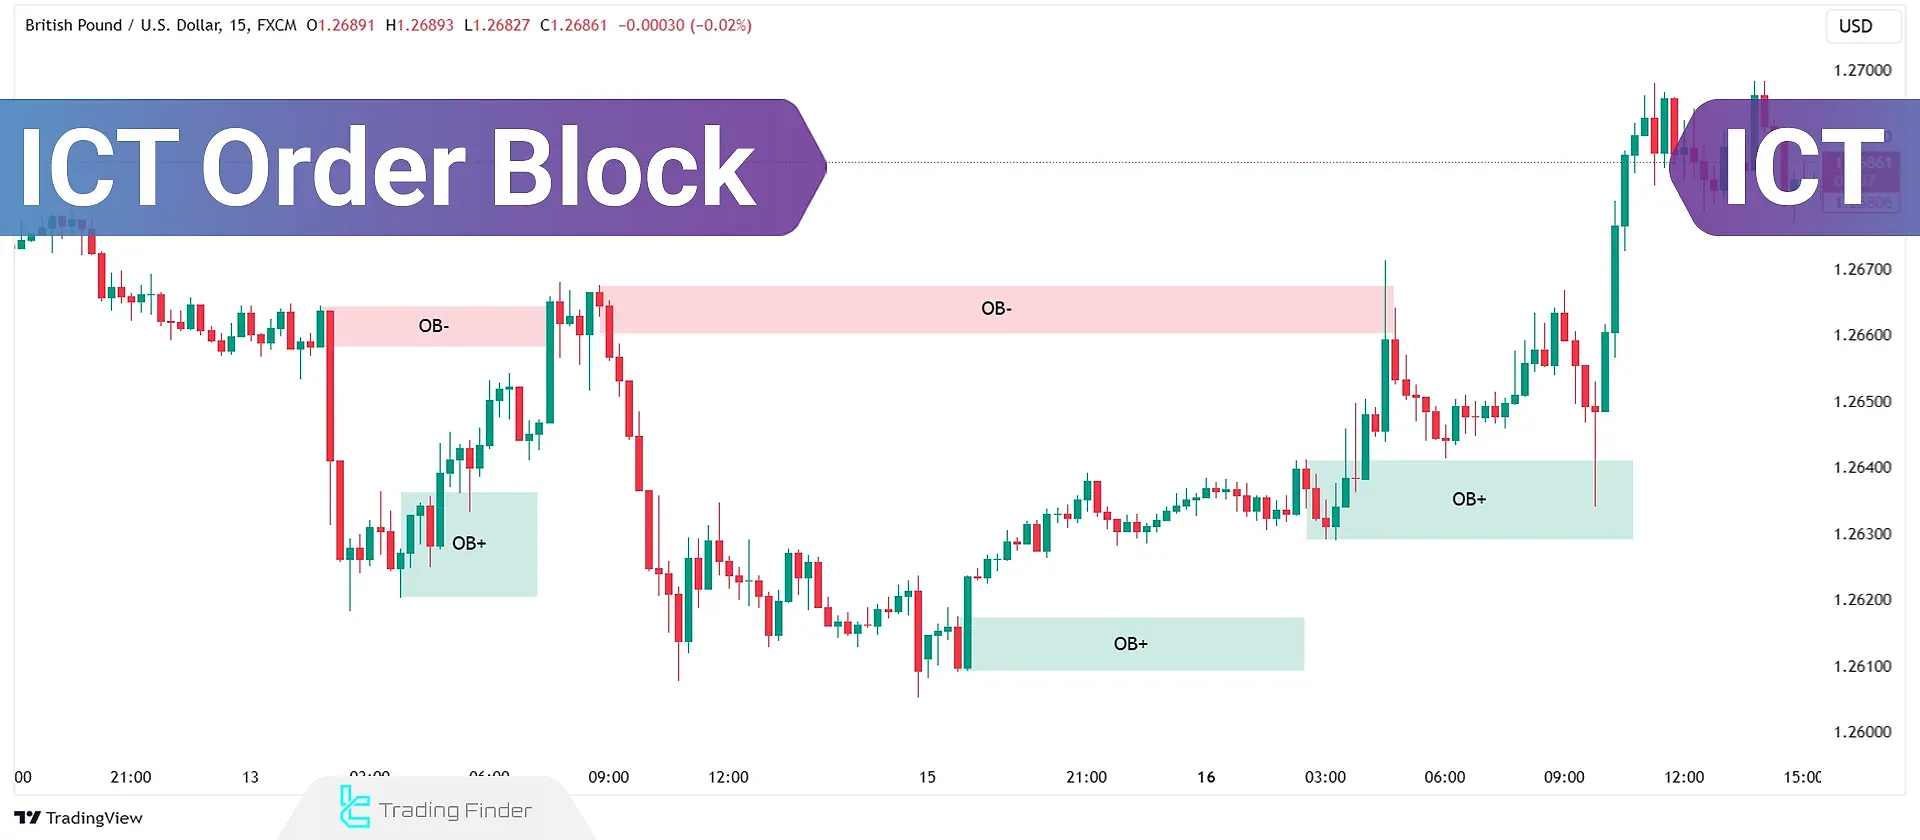
In fact, the Order Block Candle is the very candle in which smart money places its orders before the start of the main move. The characteristics of an order block include the following:
- The last counter-trend candle before the explosive move;
- Having high volume or an extended body;
- The wicks act as areas of liquidity accumulation;
- After it, a strong engulfing candle confirms the direction of the trend.
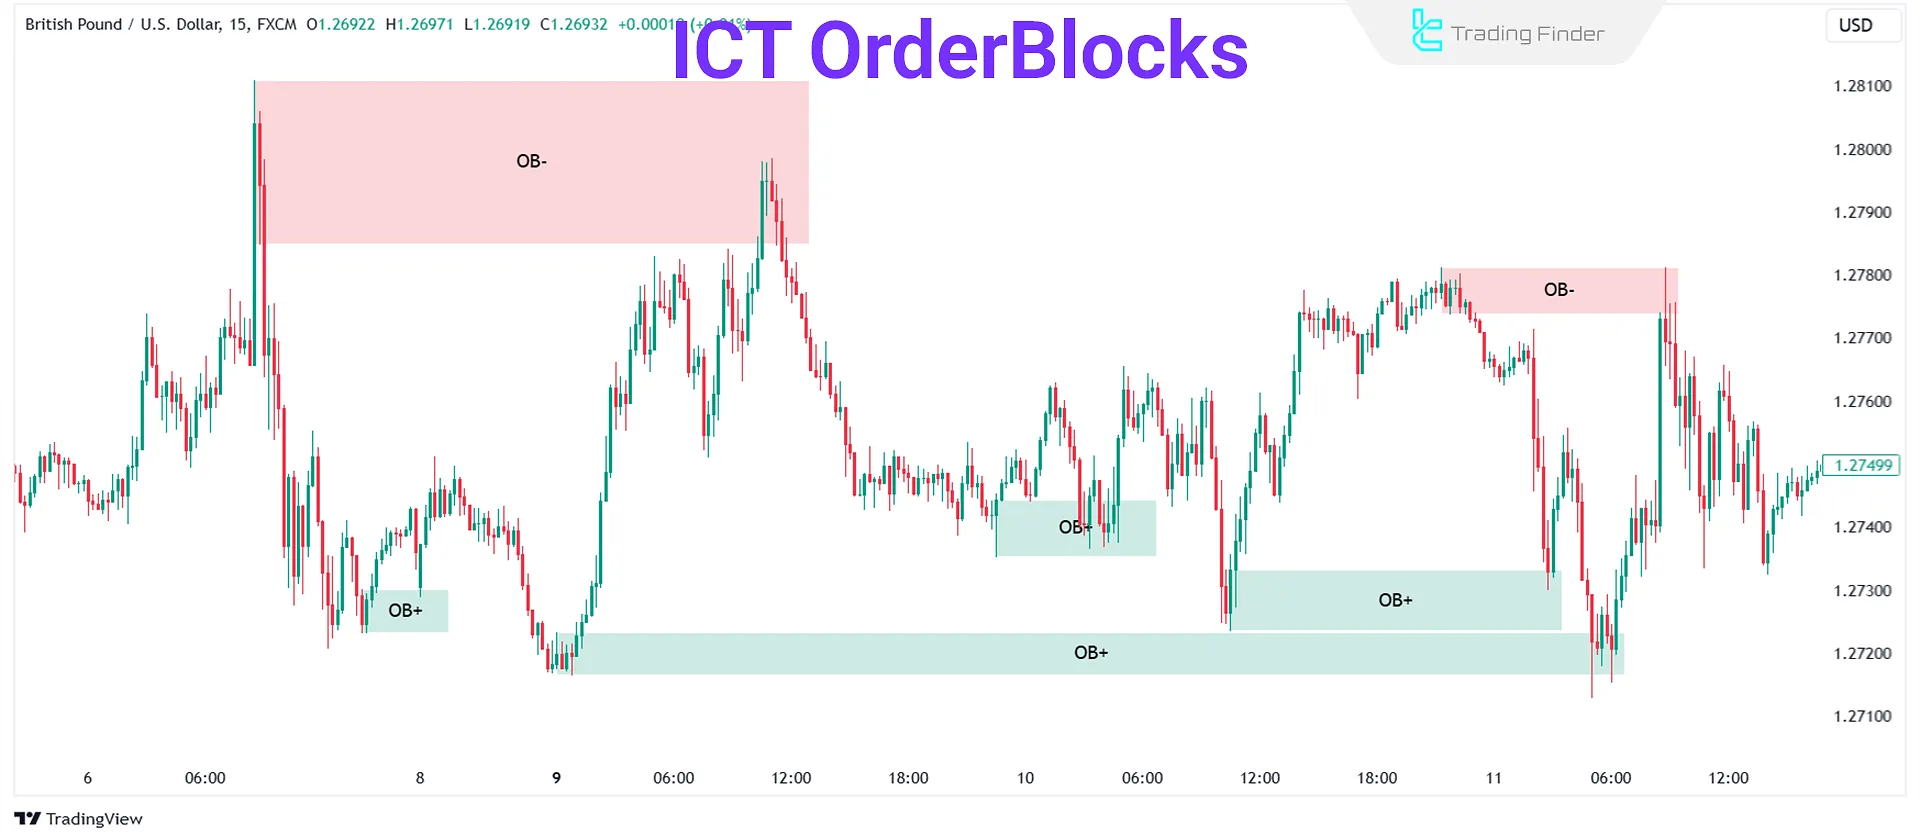
You can see examples of order blocks in the image below:
Why does an Order Block Form?
An order block is formed when institutional players execute large orders into the market in several stages in order to prevent sharp price spikes.
This gradual entry causes the price, after each short move, to return again to the initial zone so that the next part of the order can be executed.
The repetition of this behavior creates a stable zone on the chart; a zone that is recognized as an order block and displays the footprint of smart money.
This level usually forms a powerful supply or demand zone and acts as a reaction point for large players within market structure and liquidity flow.
Criteria for Selecting a Valid Order Block
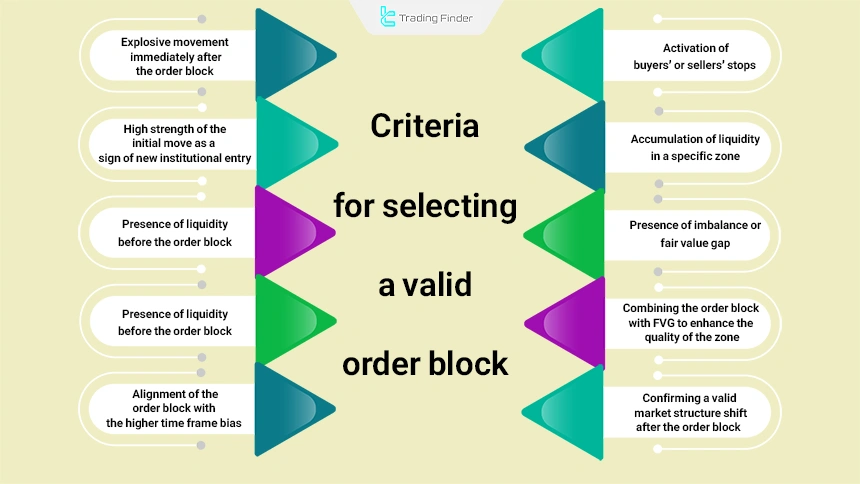
The best order blocks are considered valid only when they activate several key criteria within the price structure. To identify powerful order block zones, paying attention to the following elements is essential. Criteria for selecting a valid order block:
- An explosive move immediately after the order block;
- High strength of the initial move as a sign of new institutional entry;
- The presence of liquidity before the order block;
- Touching one of the previous high or low levels;
- Activation of buyers’ or sellers’ stop-losses;
- Accumulation of liquidity in a specific zone;
- The presence of imbalance or Fair Value Gap (Imbalance/FVG);
- Combining the order block with FVG to increase zone quality;
- Recording a valid market structure shift in the form of MSS or CHoCH after the order block;
- Alignment of the order block with the higher time frame bias (HTF Bias).
The combination of these components creates a zone in which institutional flow leaves a clear footprint and guides the market structure toward a targeted move.
Also, by carefully examining these factors, valid order blocks can be distinguished from invalid order blocks.
Difference Between Order Block and Supply and Demand Zone
Although some traders consider order blocks to be similar to supply and demand zones, from the perspective of market structure and order flow logic, there are significant differences between the two:
Criterion | Supply & demand zones (S&D) | Order block (OB) |
Nature of formation | The result of the collective behavior of traders | The execution area of institutional and bank orders |
Position in market structure | A general area of price imbalance | A point of direct smart money intervention |
Strength and validity | Medium accuracy and stability | High validity and reactivity |
Psychological impact | High dependence on collective emotions | Organized institutional decision-making |
Candlestick structure | No specific mandatory pattern | Last counter-direction candle + engulfing or BOS |
Trend change signal | A general signal of movement initiation | A precise sign of market structure shift |
Level of identification accuracy | Wide and low-precision zone | Concentrated and structured zone |
What is the Difference Between an Order Block and a Breaker Block?
Although both the order block and the breaker block are ICT concepts, they have different functions and structures. Their key differences include the following:
Feature | Order block (OB) | Breaker block (Breaker) |
Nature | Initial smart money entry zone | Zone of OB invalidation and flow shift |
Structure | The last candle against the trend direction | An order block that has lost its validity |
Trading logic | Structural pullback zone | Reversal zone after a level break |
Role in liquidity flow | Accumulation of institutional orders before the move | Reorganization of orders and change in liquidity direction |
Signal strength | Potential reversal zone | High-probability reversal zone |
Difference Between Order Block and Mitigation Block
One of the concepts used alongside the smart money order block is the “mitigation block” These concepts are very close to each other, but they have different applications.
Mitigation blocks are order blocks that have already been activated; the price has reacted to them once, or parts of the orders are still remaining within them.
The main differences between a mitigation block and an order block structure include the following:
Feature | Order block (Order Block) | Mitigation block (Mitigation Block) |
Type of orders | Newly entered smart money orders | Remaining and unfilled orders |
Entry location | The first pullback to the main zone | The second pullback or the order completion zone |
Strength of the move | Powerful move with strong momentum flow | Medium to strong move with a focus on liquidity mitigation |
Types of Order Blocks
In the directional structure of financial markets, especially within ICT-based price action analysis and the liquidity flow approach, price movement is categorized into two primary directions, and each direction creates its own specific logic within order flow.
Within this same framework, the order block appears as a high-volume institutional zone and reveals the behavior of financial institutions before the start or continuation of a trend, which includes two main types:
- Bullish movement
- Bearish movement
Since the order block is the zone in which institutional flow distributes its positions before the formation of a powerful wave, its structure aligns with the market direction and forms the following classification.
- Bullish order block (OB+)
- Bearish order block (OB-)
The educational video from the TTrades channel on YouTube provides supplementary explanations for identifying different types of order blocks and how to trade with this structure, and its content deepens the understanding of ICT and smart money concepts.
Bullish Order Block
ICT Bullish Order Block represents an area on the price chart with significant buying pressure, causing a sudden and intense upward movement in the market.
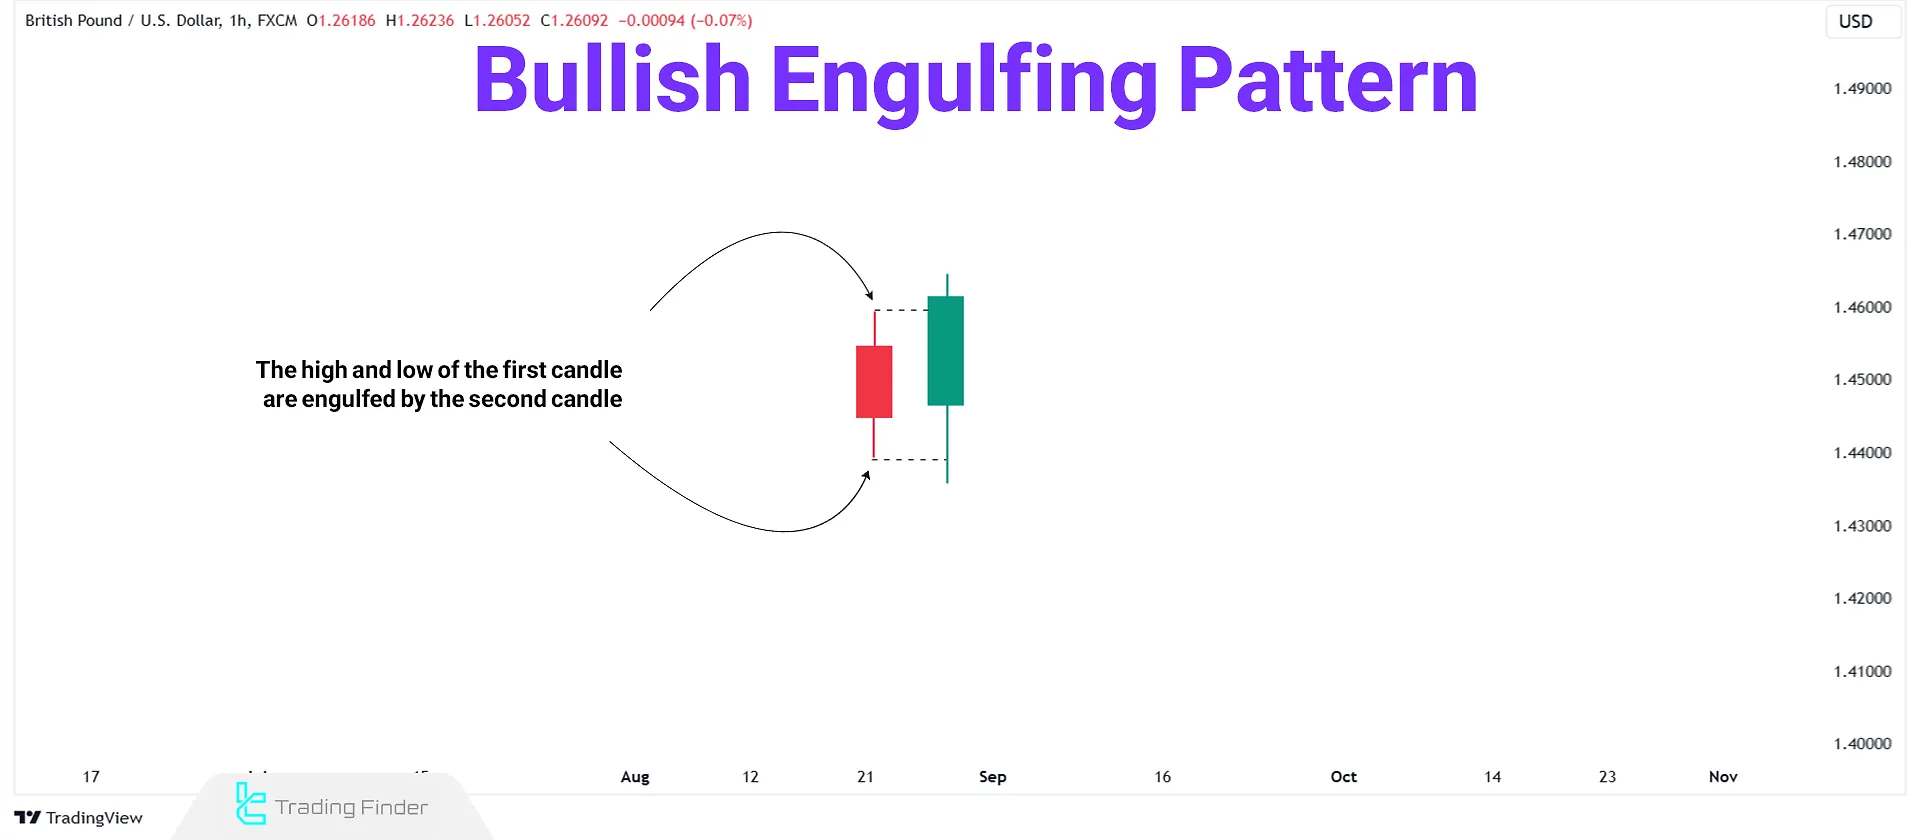
The bullish order block candle is the last bearish candle before a strong bullish move. This type of order block usually consists of two candles, where the first candle is bearish and is followed by a strong bullish engulfing candle.
How to Identify a Bullish Order Block?
To identify a valid bullish order block, check for the following:
- The second (bullish) candle must remove the liquidity below the previous bearish candle;
- The second (bullish) candle must close above the high of the previous bearish candle;
- Presence of an imbalance in lower timeframes within the order block area;
- Market Structure Shift (MSS) in lower timeframes.
Example of a Bullish Order Block on the Chart
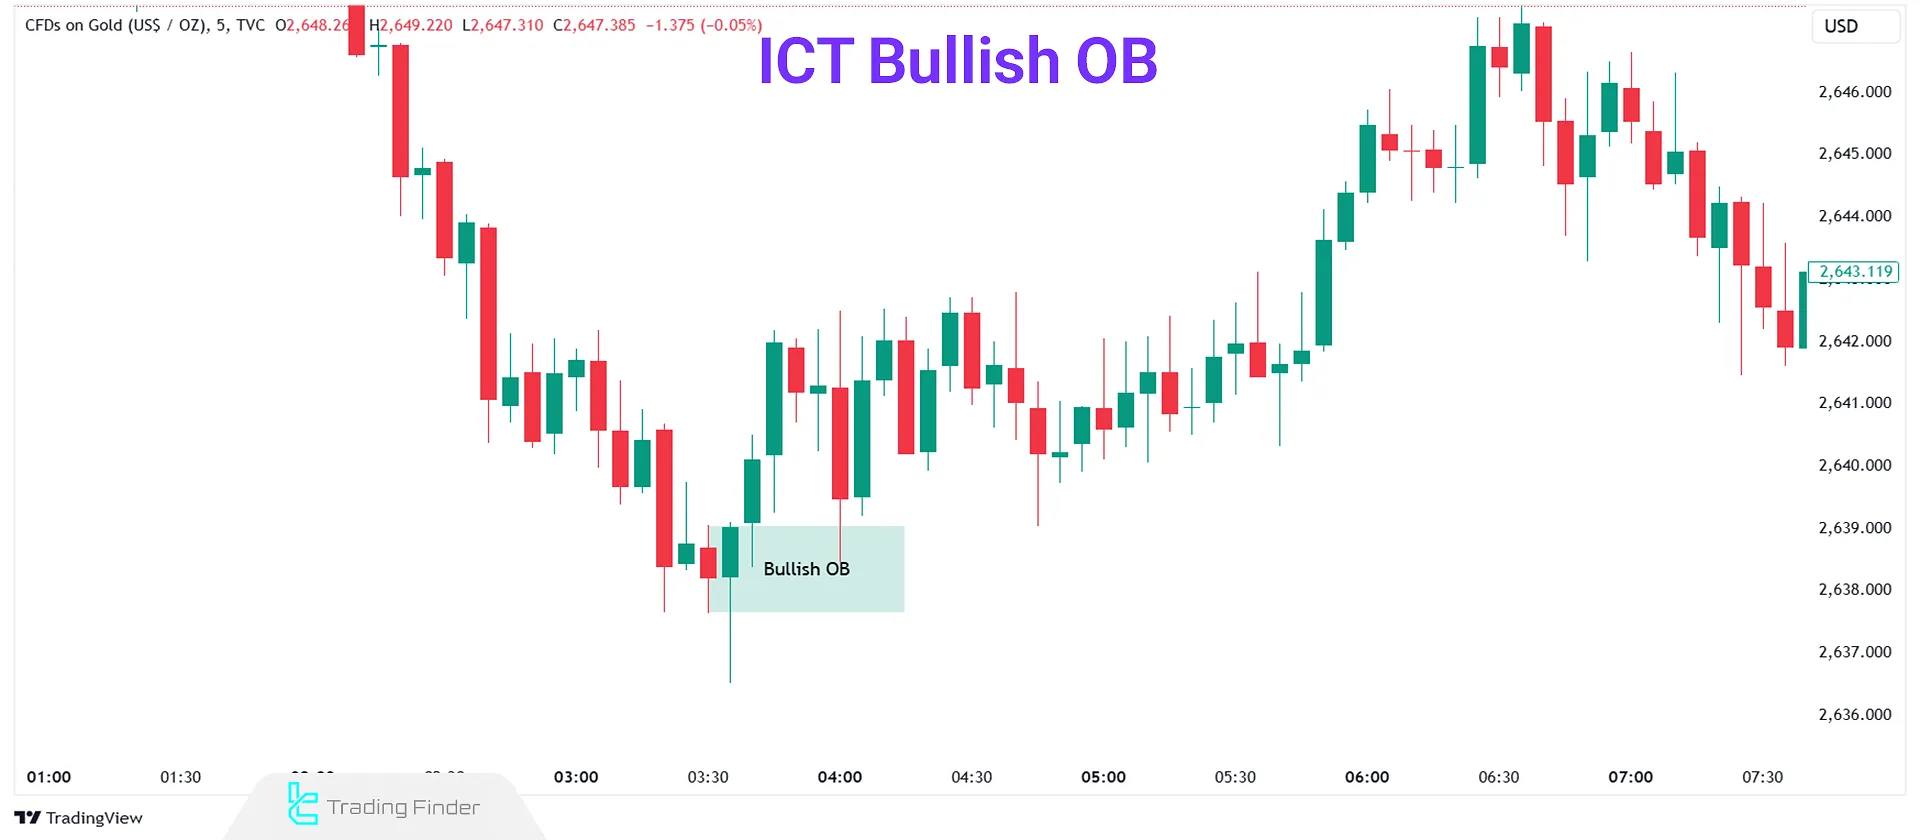
On the gold price chart (XAU/USD) in the image below, the second candle fully engulfs the previous candle, and then a strong upward move begins.
The order block zone is defined exactly from the highest to the lowest point of the engulfed candle, and you can see that after the price returns to this area, it reacts to it and continues its bullish movement.
Bearish Order Block
ICT Bearish Order Block represents an area on the price chart with significant selling pressure, causing a sudden and intense downward movement in the market.
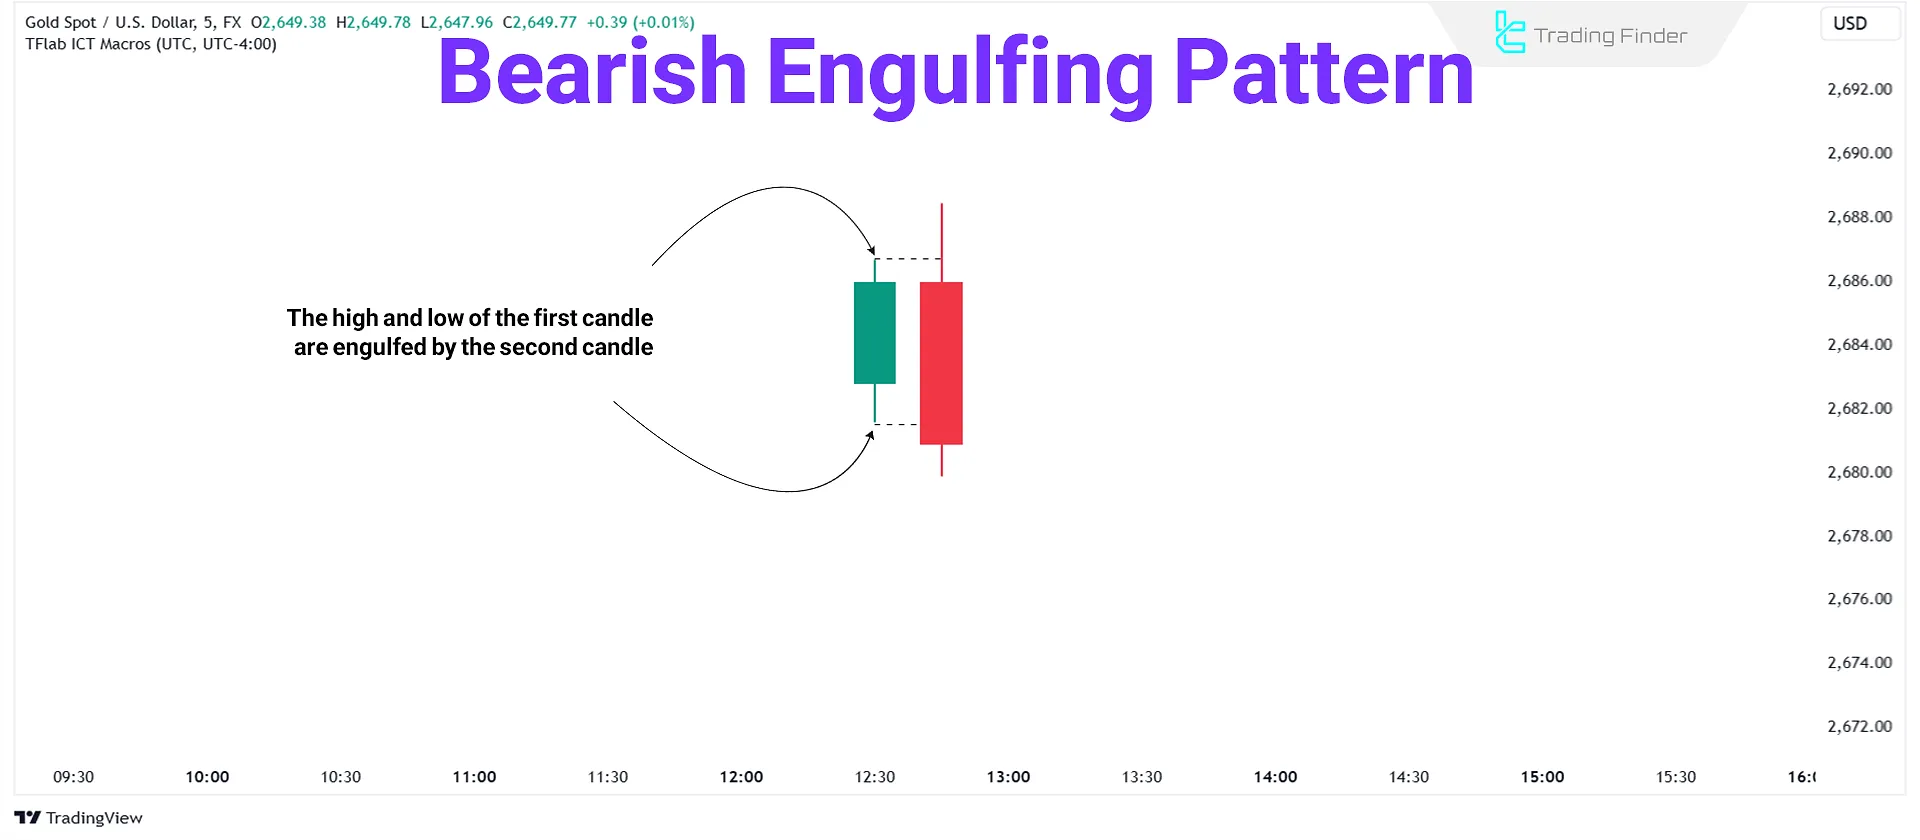
A bearish order block is typically a bullish candle followed by a strong bearish engulfing candle.
How to Identify a Bearish Order Block?
To increase the profitability of trading with order blocks, it is necessary to be able to identify them correctly. To identify a valid bearish order block candle, the following points must be carefully examined:
- The second (bearish) candle must take out the liquidity above the previous bullish candle;
- The second bearish candle must close below the low of the previous bullish candle;
- Presence of an imbalance in lower timeframes within the order block area;
- Market Structure Shift (MSS) in lower timeframes.
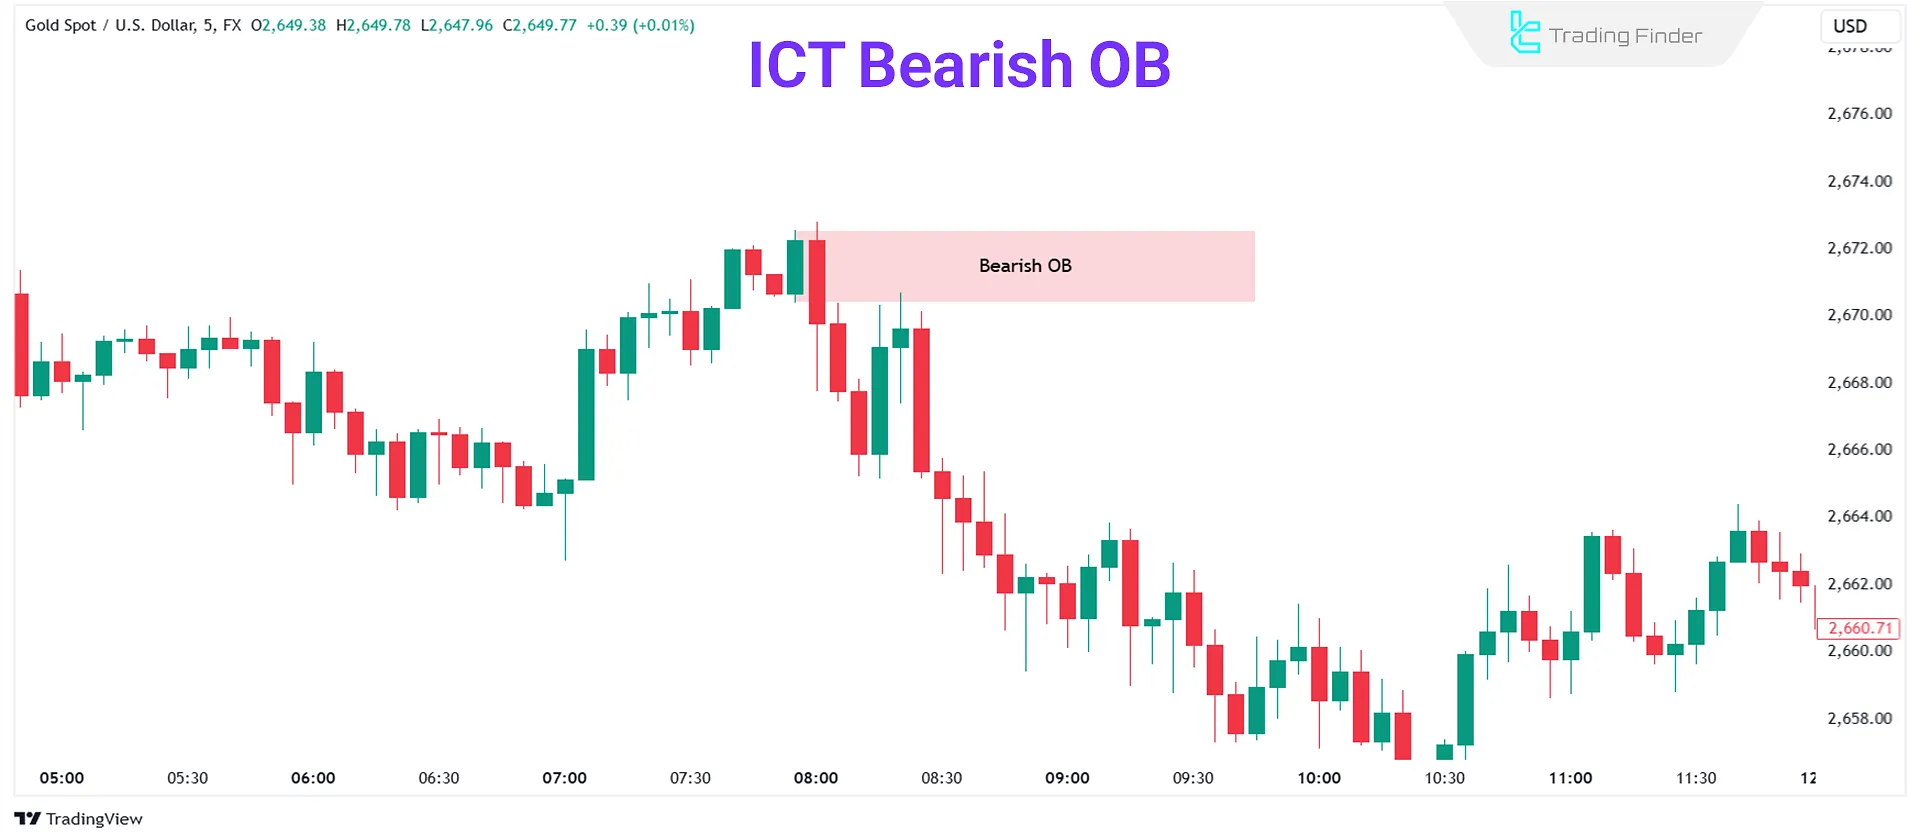
Example of a Bearish Order Block on the Chart
It can be said that in the order block pattern, the second candle must completely engulf the first candle [from body to body and from wick to wick]. You can see an example of a bearish order block in the image below:
Continuation And Reversal Order Blocks
After identifying the general types of order blocks, a fundamental classification based on the nature of price reaction and the structural behavior of the market is introduced. Within this framework, order blocks are divided into two main groups:
- Continuation OB
- Reversal OB
Both models hold a specific position within the liquidity cycle and smart money order flow, and distinguishing between them plays a key role in analyzing institution-driven order placement trends.
Continuation Order Block
This type of order block is formed within the context of a strong and directional trend and represents an area where institutions, after a short pause or minor correction, re-enter the market with completion or reload orders in order to maintain the dominant trend.
The key characteristics of a continuation order block include the following:
- Formation mainly on lower time frames or LTF: Institutional reloading on lower time frames to keep price aligned with the main direction without sharp volatility;
- Function similar to a reload zone: Price returns to a zone where the required liquidity for trend continuation has been accumulated;
- Post–order block movement: The occurrence of a fast and relatively short impulsive move that strengthens the trend structure;
- No major structure break: Trend continuation without the formation of a significant CHoCH or MSS.
The trading application of the trend-driving order block is such that in strong bullish trends, every small correction that leads to the formation of a short-term bullish OB can be considered a valid zone for trend continuation.
This type of OB provides trend-following traders with optimal low-risk entry points.
In the article on order block training for ICT-style traders on the xs.com website, various types of order blocks on real price charts are examined, and its content provides access to deeper analysis of smart money structure and the behavior of trading zones.
Reversal Order Block
A reversal order block is formed when, after a prolonged trend, the market structure shows signs of weakness, liquidity depletion, or order saturation, and smart money activates new order blocks in a key zone in order to reverse the direction of the move.
This structure is often the point at which the equilibrium of order flow is disrupted and a new dominant force replaces the power of the previous trend. Key characteristics of a reversal order block:
- Structure break after touching the zone: The return of price to the order block in ICT must lead to a significant BOS or CHoCH, which is the primary confirmation of the start of a trend reversal;
- Creation of prerequisite liquidity before zone activation: Price usually collects the required liquidity before the reversal by forming a fake high or low;
- Formation on the higher time frame or HTF: Unlike continuation order blocks, which are mainly formed on lower time frames, the reversal type usually originates from higher-level structures;
- Absorption of large orders and change in order flow: This zone is usually the entry point of a significant volume of counter-trend orders, which reduces momentum and prepares the ground for a sustainable change in direction;
- Powerful and directional exit move: After the activation of the reversal order block, a breakaway candle confirms the new move.
Role of Time Frames in Selecting a Valid Order Block
The order block (OB ICT) behaves differently across various time frames, and each time scale offers a specific level of precision, validity, and functionality.
Type of order block | Range time | Main characteristics | Application and level of validity |
Short-term | 1m – 5m – 15m | High frequency, high analytical error, suitable precision for fine entries | Suitable for scalping and rapid entries, valid only in the direction of the higher time frame trend |
Mid-term | 1H – 4H | Balance between quantity and precision, higher success rate, proper analytical stability | Ideal zones for swing trading, the best context for market structure analysis |
Long-term | Daily – Weekly | Highest strength and validity, formation of major zones and heavy moves, orderly price reaction | Suitable for large targets and macro trends, reflecting the impact of liquidity flow and large institutions |
This time-based classification provides a more precise understanding of how liquidity flow behaves and how large institutions influence supply and demand zones, and in most cases, it makes the identification of order blocks easier for traders.
How to Trade a Bullish ICT Order Block?
To trade based on a Bullish ICT Order Block, follow these steps:
- Identify the Market Order Flow: Determine the prevailing trend in the market;
- Validate in an Uptrend: Bullish order blocks are more reliable in uptrends; In downtrends, they might offer only a short-term reversal.;
- Identify a Valid Bullish ICT Order Block: Look for key areas with strong bullish setups;
- Wait for Price Return to Order Block: Once identified, wait for the price to revisit the bullish order block;
- Entry at 50% Retracement: When the price approaches the bullish order block, initiate a buy trade around the block's 50% retracement level;
- Confirm with Lower Timeframes: For further confirmation of the trading direction with an order block, one can look for signals such as a market structure shift on lower time frames such as 15 minutes or 5 minutes.
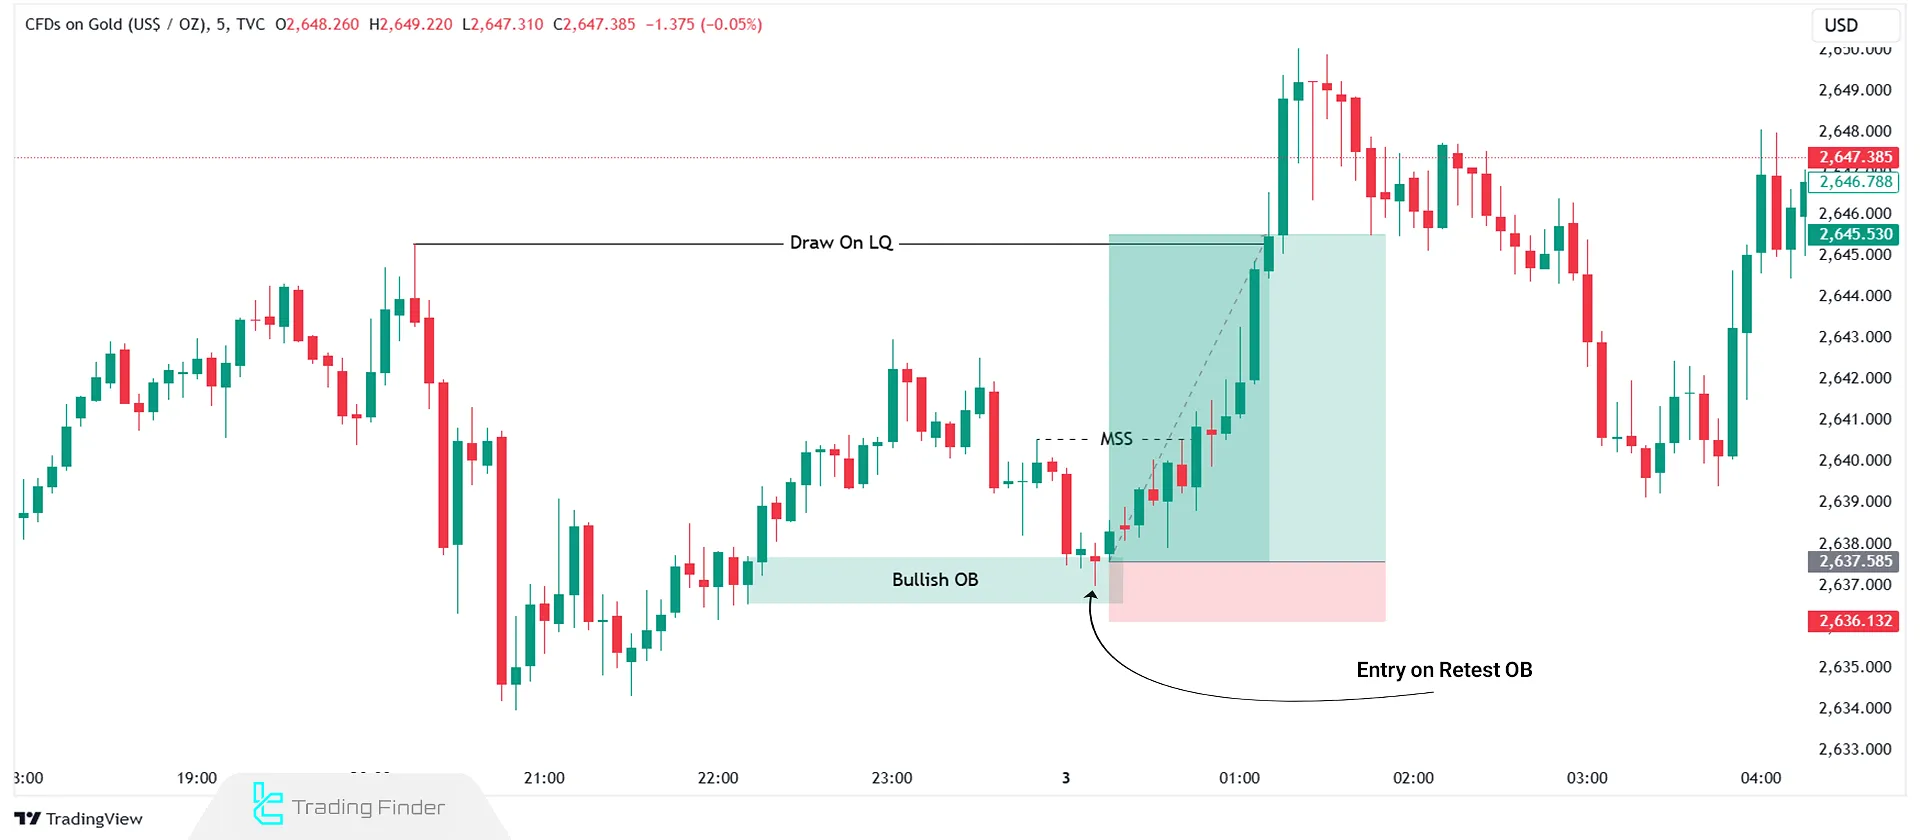
In the above image, the gold market shows a shift in structure towards a bullish trend. After forming a bullish order block, the price returns to it, and a buy trade is executed upon confirmation in lower timeframes.
How to Trade a Bearish ICT Order Block?
To use an order block in trading and initiate a trade based on a bearish order block (ICT Bearish OB), follow the steps below:
- Identify the Market Order Flow: Determine the prevailing trend in the market;
- Validate in a Downtrend: Bearish order blocks are more reliable in downtrends; In uptrends, they might offer only a short-term reversal;
- Identify a Valid Bearish ICT Order Block: Look for key areas with strong bearish setups;
- Wait for Price Return to Order Block: Once identified, wait for the price to revisit the bearish order block;
- Entry at 50% Retracement: When the price approaches the bearish order block, initiate a sell trade around the block's 50% retracement level;
- Confirm with Lower Timeframes: Use lower timeframes (e.g., 15 or 5 minutes) for confirmation, such as market structure shifts.
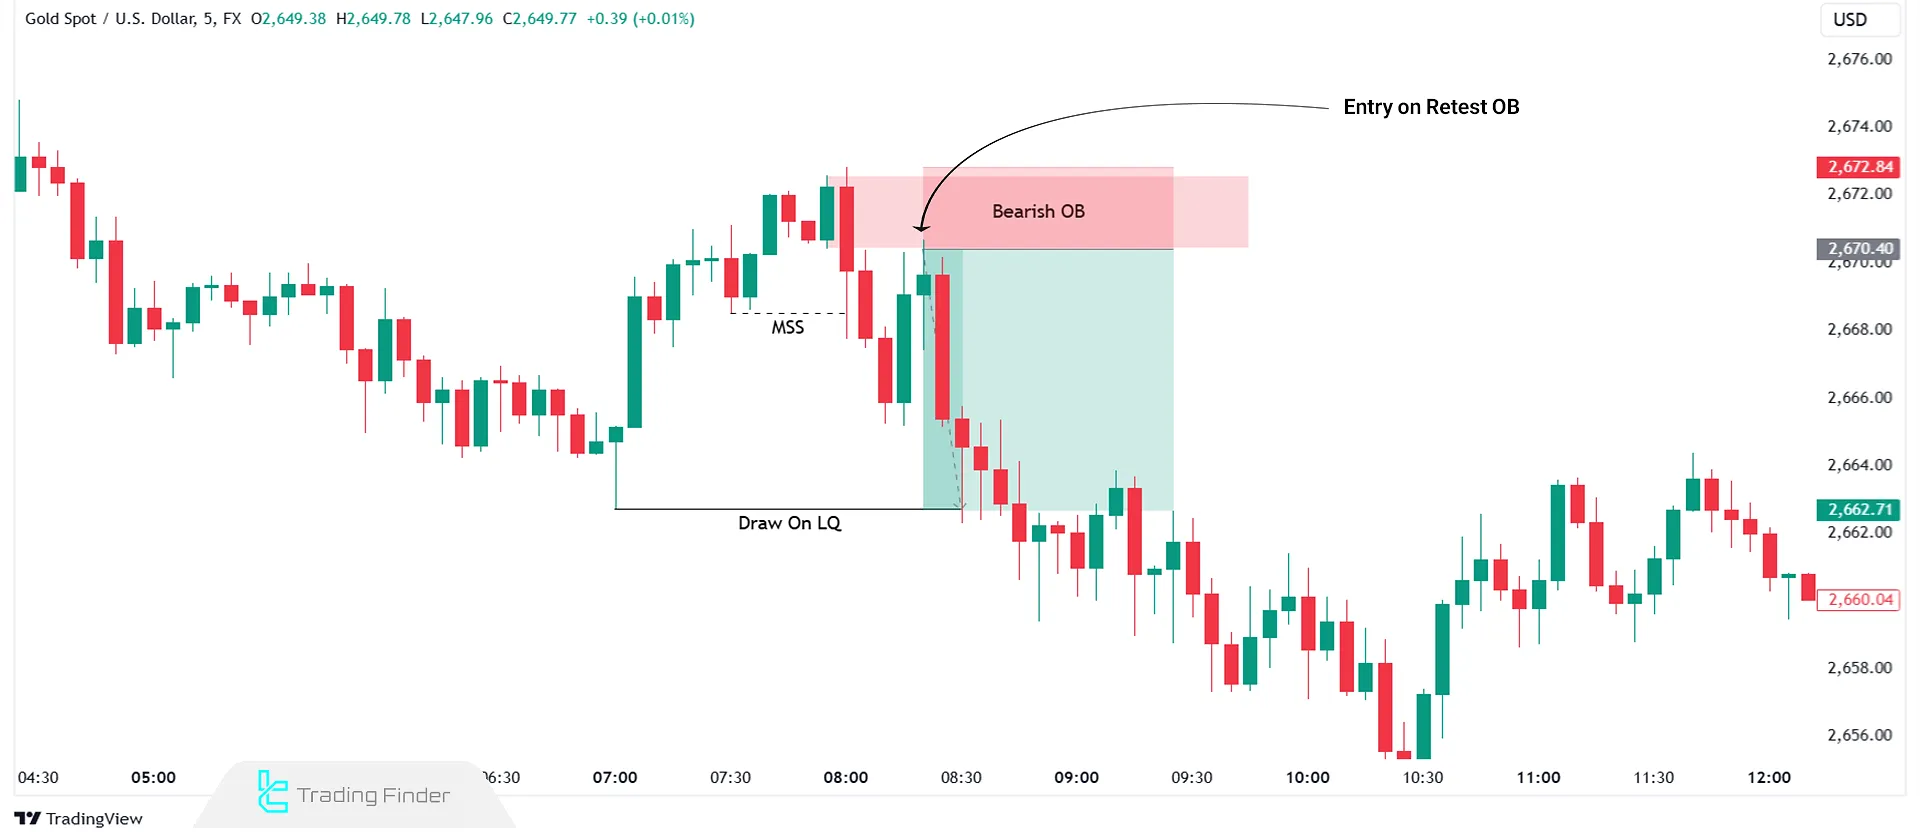
In the above image, the gold market shows a shift in structure towards a bearish trend. After forming a bearish order block, the price returns to it, and a sell trade is executed upon confirmation in lower timeframes.
Stop Loss and Take Profit for Order Block Trades
When executing a trade based on a bullish or bearish order block, consider placing your stop loss a few pips below or above the order block.
To determine the take profit, you can look for the next major liquidity draw; never risk more than one percent of your capital on a single trade.
Risk Management in Trading with Order Blocks
Risk management in trading with order blocks must be fully structured and precise. This framework controls risk and makes order block–based entries more effective. The best practices include the following:
- Stop loss (SL): The stop loss is not placed inside the order block and is set slightly below the low of a bullish order block or slightly above the high of a bearish order block;
- Take profit (TP): First at the previous swing high/low, second at the Imbalance/FVG fill, and third at major liquidity like equal highs or lows;
- Risk-to-reward ratio: A 1:3 ratio is used for conservative entries and a 1:5 ratio or higher is applied for precise entries in sensitive areas such as the 50% level of the order block;
- ATR-based stop loss: In highly volatile markets, the stop loss can be placed 0.5 to 1 ATR units below or above the order block in order to eliminate price noise.
Common Mistakes Traders Make When Using Order Blocks
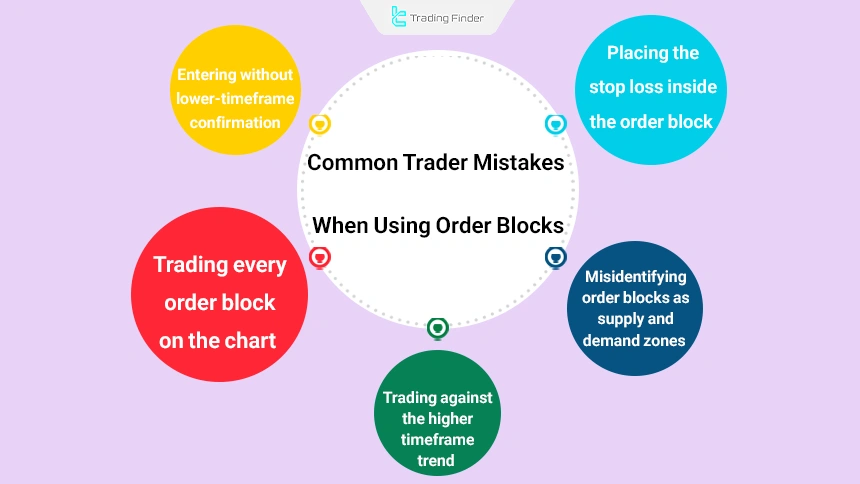
ICT-style traders make mistakes when working with order blocks that lead to heavy losses and create significant psychological pressure on their trading journey. Below are some examples of these common mistakes:
- Trading every order block on the chart
- Entering without lower time frame confirmation
- Placing the stop loss inside the order block
- Trading against the higher time frame trend
- Misidentifying order blocks with supply and demand zones
Download Order Block Indicator for ICT and Smart Money
The order block indicator is one of the specialized tools for traders who operate based on the ICT approach and the Smart Money model on the MetaTrader platform.
By precisely scanning the market structure, this indicator identifies zones that are usually the placement area of heavy orders by banks, institutions, and major players.
These areas are recognized as order blocks and are often the starting point of strong price movements on the chart.
- Adding the major levels order block indicator on TradingView
- Downloading the ICT & SMC order block indicator for MT5
- Downloading the ICT & SMC order block indicator for MT4
Within the structure of this tool, bullish blocks are plotted in green and bearish blocks are displayed in brown.
When the price enters these zones, we usually observe significant reactions; reactions that can clarify the probable market path for traders and enable precise planning for entry or exit points.
In one practical example on a 30-minute chart of a currency pair, the Order Block indicator marks a zone as a bullish order block.
As price enters this level, the accumulated liquidity flow creates a powerful bullish move; behavior that indicates the presence of effective orders in that area for traders.
Another example relates to the 5-minute chart of another currency pair, where a bearish block appears in brown. The price’s contact with the order block zone triggers a sharp and rapid drop, indicating the presence of large sell orders at that level.
Such analyses make early identification of potential reversal zones or possible breakouts achievable.
The best order block indicator is applicable across different trading styles, from day trading to scalping, and has demonstrated its effectiveness in the forex market, commodities, indices, and other assets traded on MetaTrader.
In the settings section, features such as Candles To Check (defining the number of candles to be analyzed) and Theme (selecting light or dark mode) are available, allowing traders to customize the indicator according to their own style.
Overall, the order block indicator, as both a leading and a reversal tool, identifies key zones where the probability of a price reaction is very high; an ideal tool for traders who seek smart, liquidity-based decision-making.
Conclusion
Order blocks can also be found within trends after a pullback, and these order blocks confirm the strength of the trend.
For example, in a bearish trend after a bullish pullback, a bearish order block (OB-) may form, which confirms the strength of the downtrend, and a new sell order can be added to profit from the bearish trend.
Accordingly, in a bullish trend after a bearish pullback, a bullish order block (OB+) may form, which confirms the strength of the uptrend; in such conditions, a new buy order can be added to follow the bullish trend.


