


The ICT PD Array inSmart Moneyor "Premium and Discount Zones" is a structured approach used to identify optimal entry points in trading.
PD arrays allow traders to align their trades with market structure and liquidity flow. These zones also represent the balance between supply and demand, helping identify the probable direction of price movement.

What Are Premium and Discount Zones?
Cheap or discounted prices belong to the lower half of the range and are used to look for buying opportunities (Long) and to identify sellers’ target zones (Take Profit).
In contrast, expensive or premium prices, which lie in the upper half of the range, are used to look for selling opportunities (Short) and to identify buyers’ target zones (Take Profit).
Additionally, for learning PD Array, you can also refer to the YouTube channel TTtades:
Advantages and Disadvantages of Premium and Discount Zones (PD Array)
The advantages and disadvantages of PD Array in financial market analysis directly affect the accuracy of identifying supply and demand zones, the quality of trade entries and exits, and liquidity management.
Advantages and disadvantages of premium and discount zones:
Advantages | Disadvantages |
Helps identify supply and demand zones | Possibility of false signals in ranging markets |
Increases accuracy in identifying bullish and bearish structures | Highly sensitive to fundamental news and sharp volatility |
Improves timing for trade entries and exits | Requires combination with complementary tools such as price action or indicators |
Enables liquidity analysis and identification of stop-hunts | High complexity for beginner traders |
Applicable in both short-term and long-term strategies | Possibility of fake breakouts within support and resistance zones |
Benefits of Using the PD Array
Using the PD Array enhances market analysis and improves decision-making.
Key benefits include:
- Identifying Buy and Sell Areas: Splitting the market into premium and discount zones; it highlights optimal buying and selling prices
- Better Trade Timing: This strategy enhances trade timing by emphasizing purchases in discount zones during uptrends and sales in premium zones during downtrends
- Increased Precision: Combines ICT tools for improved accuracy in identifying entry and exit points
- High-Probability Trades: Enables traders to enter high-probability trades while avoiding high-risk positions
Types of PD Array in ICT
ICT PD Array comprises essential tools to identify optimal entry and exit points. These tools provide traders with a deeper understanding of price movements.
PD Array Tools
- ICT Fair Value Gap (FVG) Identifies gaps in price balance
- ICT Inversion Fair Value Gap Highlights order blocks
- ICT Order Block Focuses on breakout blocks
- ICT Breaker Block Highlights recovery zones
- ICT Mitigation Block Marks reversed fair value gaps
- ICT Unicorn Model Unique analytical patterns
- ICT NWOG (New Weekly Opening Gap)
- ICT NDOG (New Daily Opening Gap)
How to Identify PD Array Zones?
To identify Premium and Discount zones, use the Fibonacci tool with the following settings:
- 1 (Start)
- 0.5 (Equilibrium)
- 0 (End)
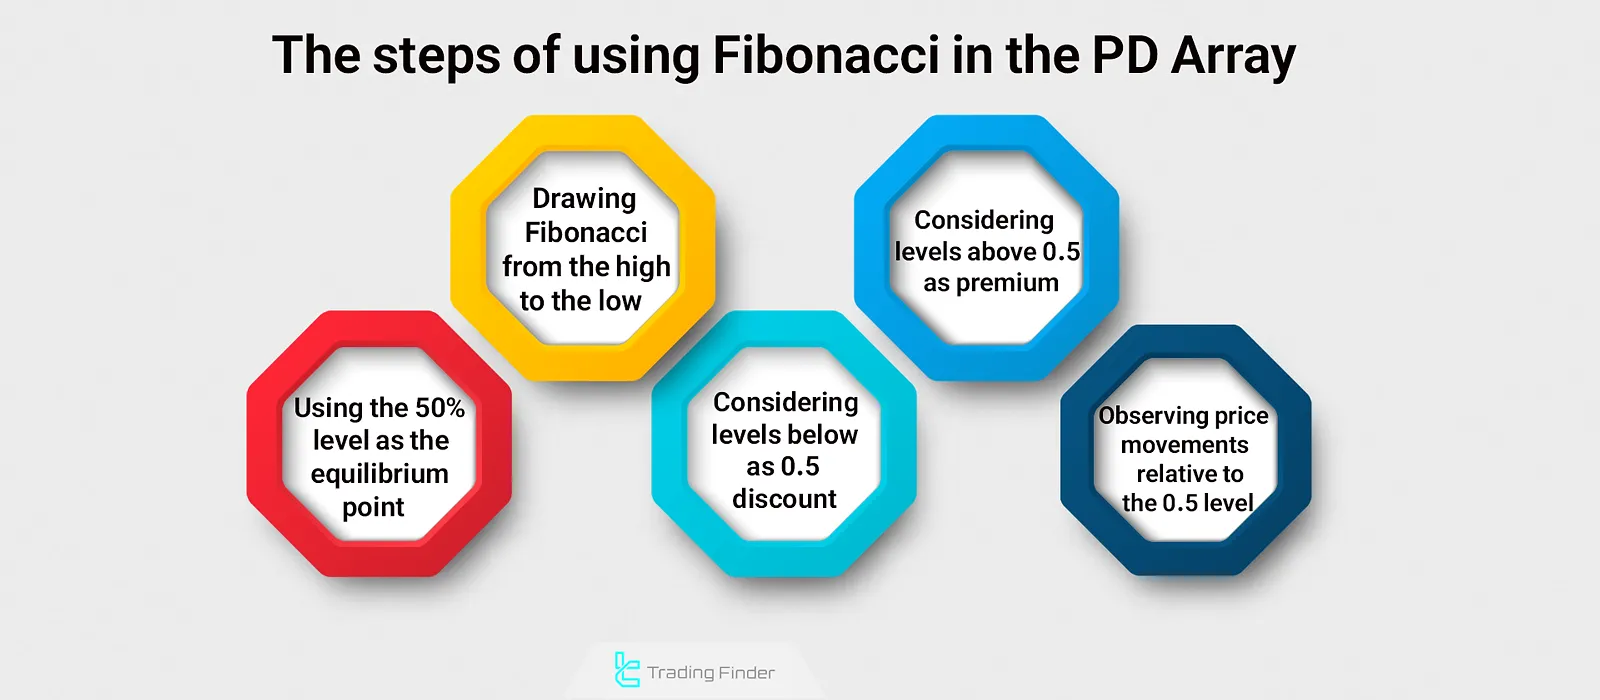
Tutorial on Setting Up Fibonacci and Identifying Premium and Discount Zones, Provided by Flux Charts. Steps for Using Fibonacci:
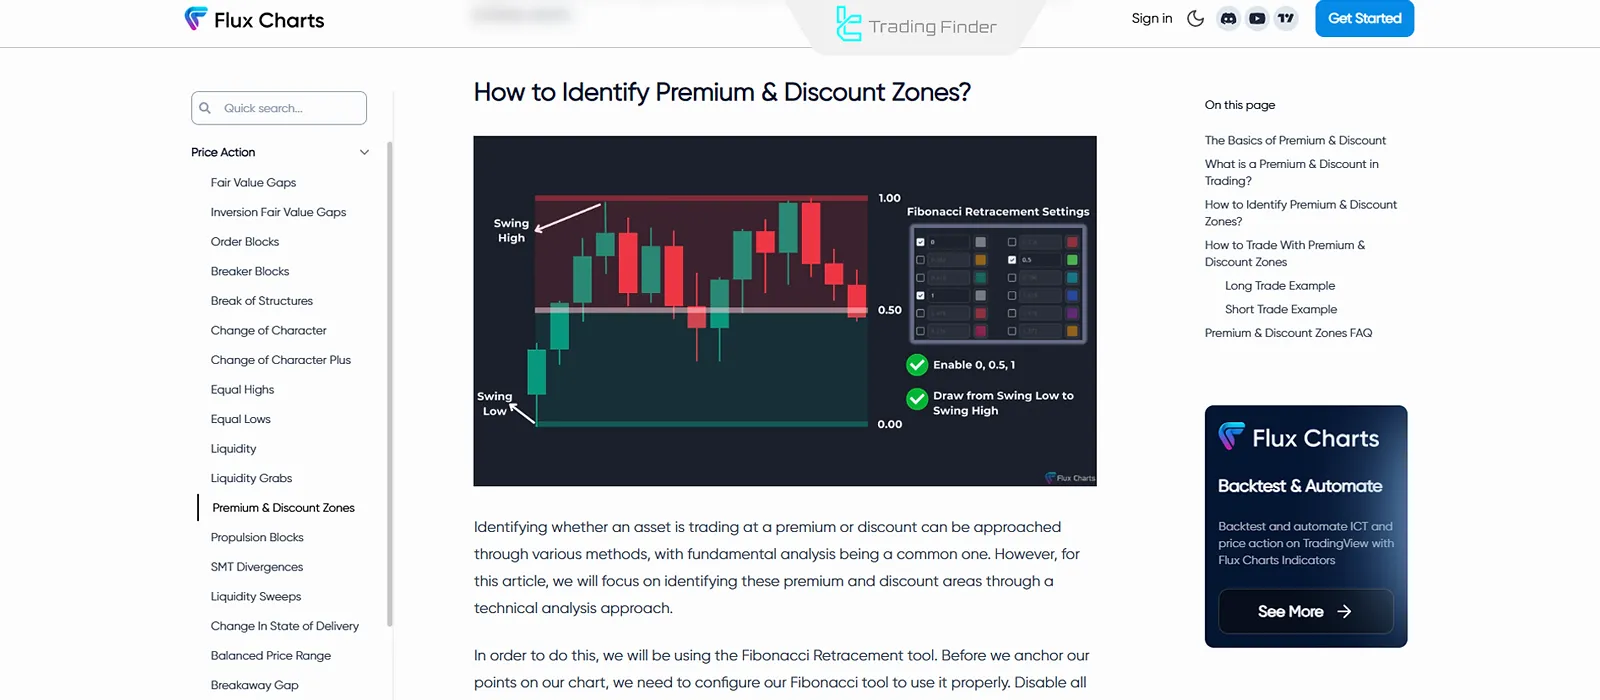
- Draw Fibonacci from a price high to a price low;
- The 5 level marks the equilibrium point (50% of the range);
- Area Above 50% Range is the Premium Zone (expensive);
- Area below 50% Range is the Discount Zone (cheap);
- Monitoring Price Movements Relative to the 0.5 Level.
How to Use PD Array?
To use a PD Array (Premium-Discount Array), follow the steps below:
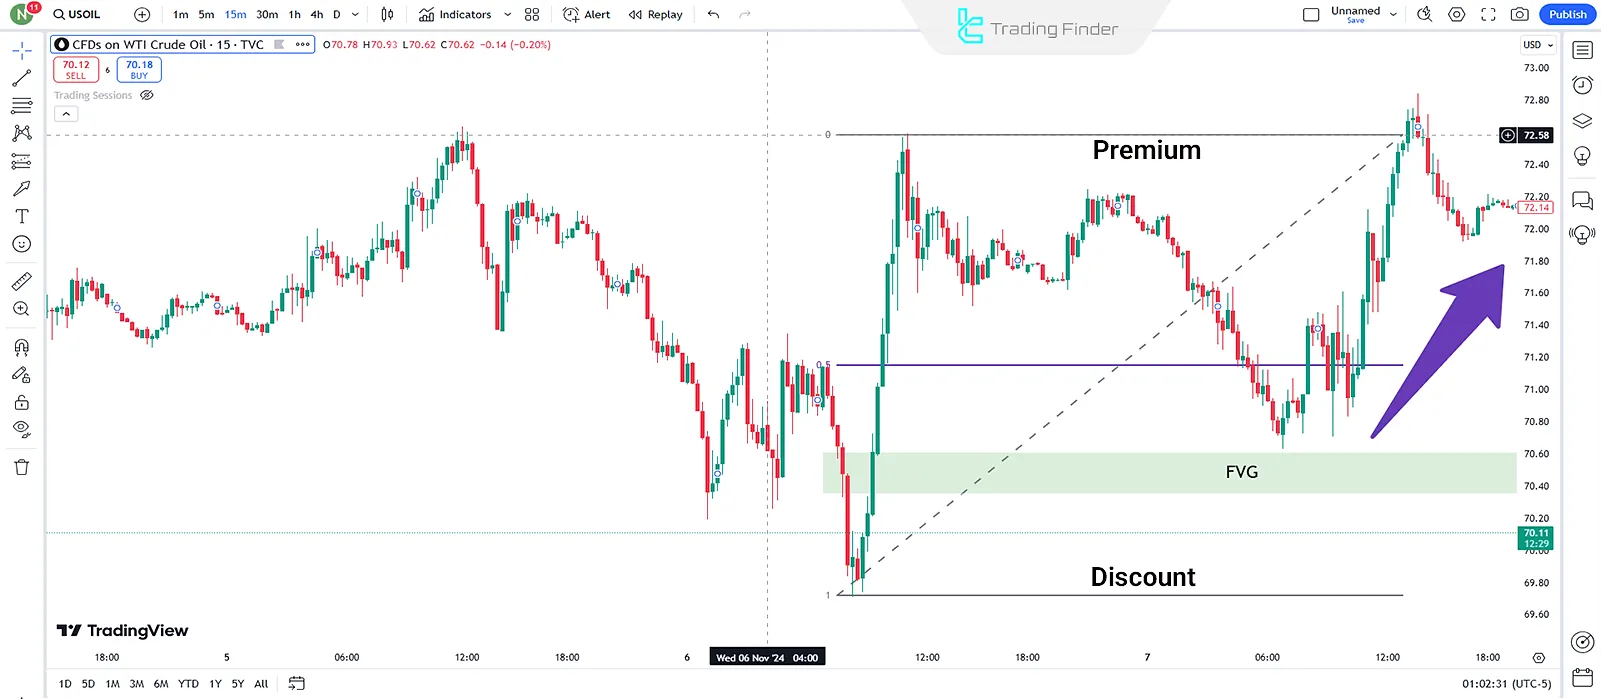
Bullish Scenario
If the price shifts to an upward structure and lies in the Discount Zone, enter a Buy
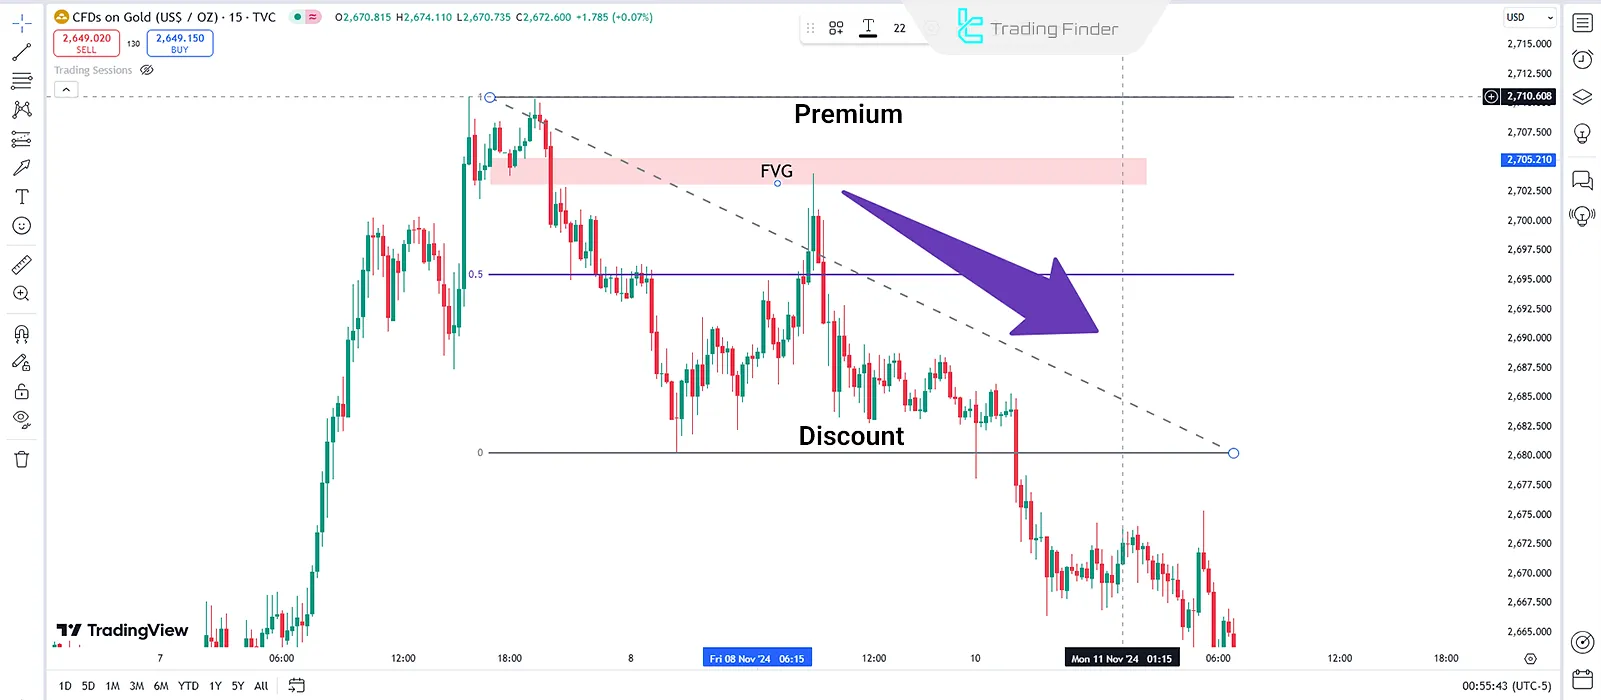
Bearish Scenario
If the price shifts to a downward structure and lies in the Premium Zone, enter a Sell
Best Timeframes for Premium and Discount Zones in ICT
Traders use the daily timeframe to identify the overall market trend, while the 15-minute and 5-minute timeframes are suitable for finding precise entry points.
Additionally, tools such as Fibonacci Retracement are considered the best companions for identifying discount and premium zones.
Which Markets Are Suitable for PD Array?
Originally designed for major indices like NASDAQ (NQ Futures) and S&P 500, this strategy has demonstrated high accuracy and efficiency.
Over time, it has been adapted to other markets, including:
- Forex: Major currency pairs like GBP/USD and EUR/USD
- Precious Metals: Proven effectiveness in markets like Gold (XAU/USD)
Buy Trades Example in PD Array
In a bullish array, the overall market trend can be determined using higher timeframes such as the 1-day and 4-hour charts.
When the trend is bullish and the price is within the discount zone, ICT tools can be used to find confirmation in the direction of the overall market (uptrend) and enter buy trades accordingly.
Sell Trades Examplein PD Array
In a bearish array, the overall market trend can be identified using higher timeframes such as the 1-day and 4-hour charts.
When the trend turns bearish and the price is in the premium zone, ICT tools can be used to find confirmations in the overall market direction (downtrend) and enter sell trades accordingly.
Advanced Tips for Using PD Array
To use PD arrays in the most efficient way, here are some tips you should know before using them:
- Multi-Timeframe Analysis: Align multiple timeframes for consistent analysis
- Market Structure Confirmation: Ensure alignment with market trends
- Tool Confluence: Combine PD Array with other ICT tools
- Trend Identification: Accurately analyze market direction
Common Mistakes Traders Make When Using PD Array
When working with the PD Array (Premium and Discount), traders often make mistakes that reduce the accuracy of their analysis. The most common of these errors include:
- Ignoring higher timeframes: Many traders focus only on lower timeframes and overlook the broader market structure (Market Bias);
- Incorrect identification of Premium and Discount zones: Sometimes the Premium and Discount ranges are drawn inaccurately, causing the trader to enter trades against the direction of liquidity;
- Not combining PD Array with complementary tools: Using PD Array alone, without considering Order Blocks, FVGs, or overall market liquidity, can lead to false signals;
- Entering prematurely without confirmation: Traders sometimes open positions merely when price reaches the Premium or Discount area, while a price action confirmation is still required;
- Neglecting risk management: Even the most accurate analysis can lead to heavy losses if stop-loss and risk limits are not respected.
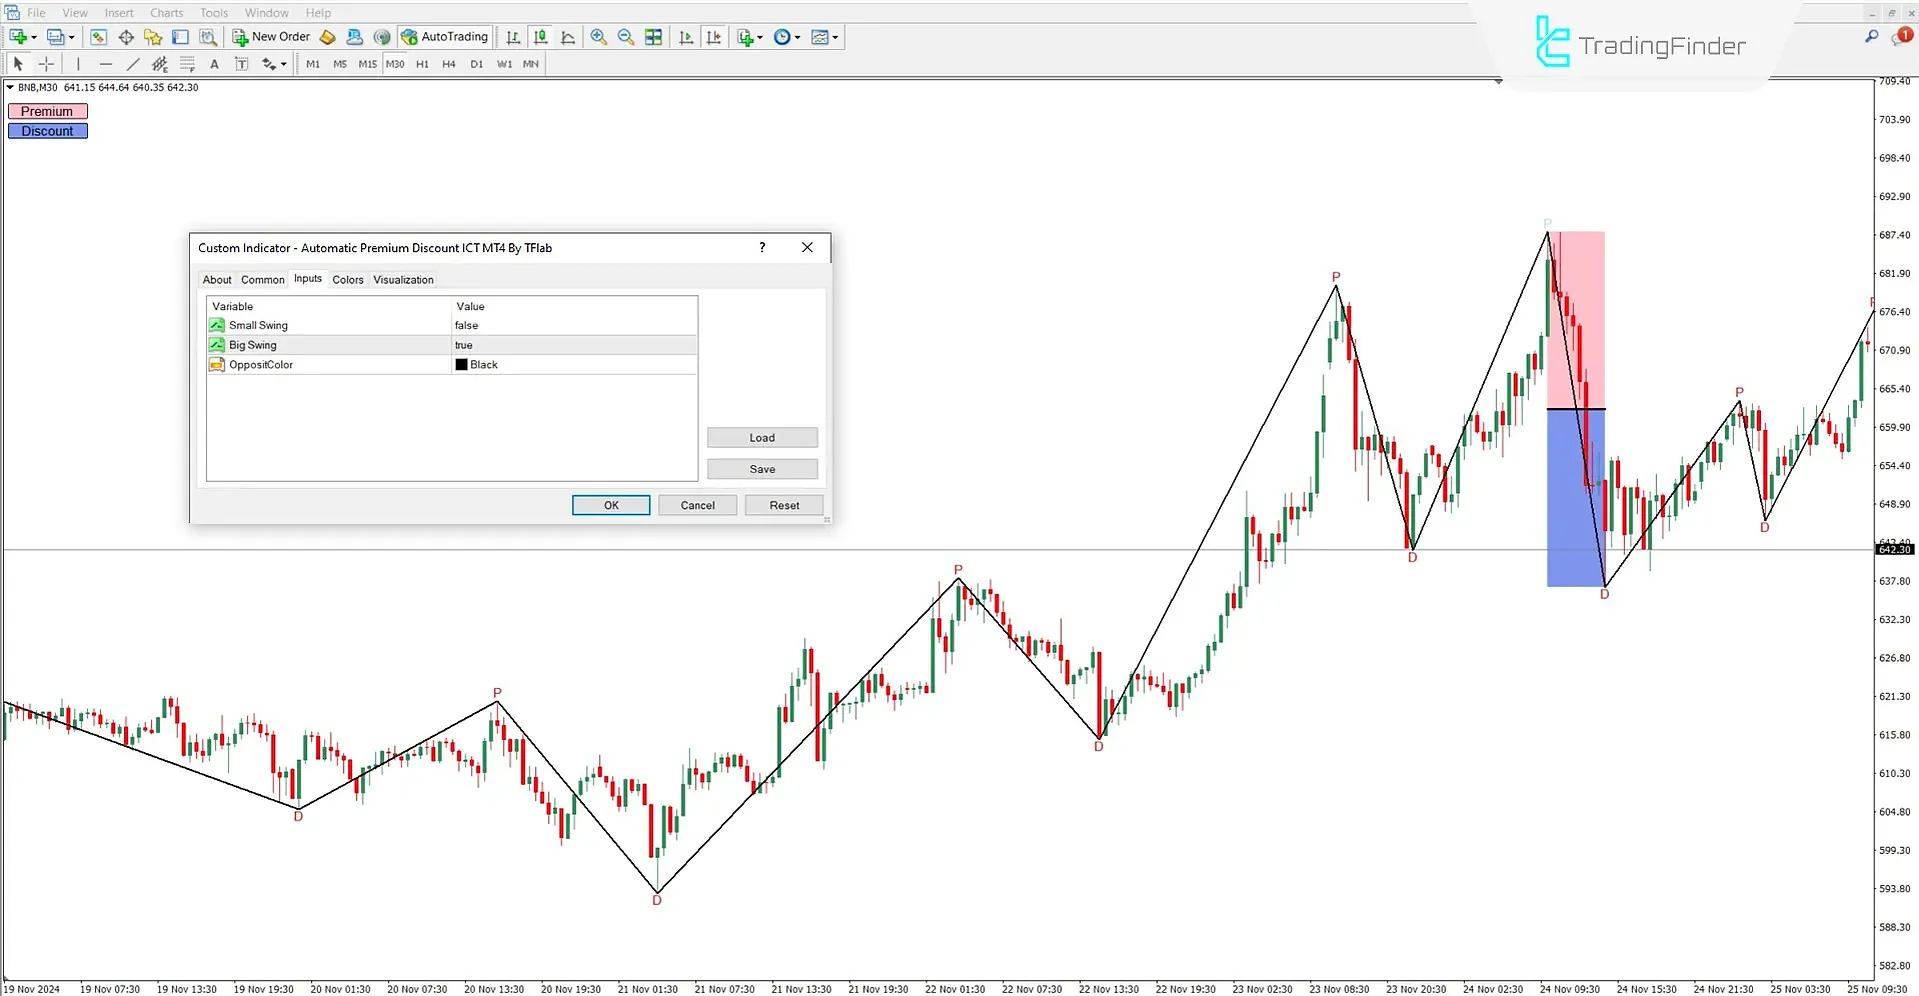
Premium and Discount Zones Indicator
The Automatic Premium and Discount Zones Indicator is one of the ICT tools that visually displays premium and discount areas in a simple way.
This indicator identifies the desired ranges by analyzing swing highs and swing lows and places the labels “P” and “D” on the chart.
When these labels are activated, the premium and discount zones appear clearly along with the 50% midpoint line . Educational video on how to use the Premium and Discount Zones Indicator:
In the specifications table, this indicator falls under the ICT and liquidity tools category. It is best suited for advanced traders.
The indicator is reversal-based and supports multi-timeframe analysis. It can be applied to different trading styles, including day trading, scalping, Forex, cryptocurrency, and stocks.
The structure of the indicator consists of two main zones:
- The pink area, representing the Premium zone;
- The blue area, representing the Discount zone.
This division allows traders to identify suitable entry points depending on whether the market is in an uptrend or a downtrend.
In uptrends, the area above the 50% line is considered Premium, while in downtrends, the same pattern applies inversely.
The indicator uses a zigzag line to determine trend direction and, based on swing analysis, draws important price zones.
One of its key advantages is the simplicity of identifying ideal trading ranges and its flexibility across multiple markets .
In the settings panel, users can enable minor or major swing analysis and change the zigzag line color according to their preferences.
The Automatic Premium and Discount Indicator is an efficient tool for quickly detecting overbought and oversold zones.
By combining swing analysis with clear visual representation, it helps traders identify entry and exit points more effectively. Links to the Premium and Discount Zones Indicator:
- Automatic Premium and Discount Indicator for MetaTrader 4
- Automatic Premium and Discount Indicator for MetaTrader 5
Conclusion
The ICT PD Array is a powerful, structured method for analyzing and executing trades.
Integrating advanced tools and modern techniques allows traders to analyze markets with precision, manage risk effectively, and achieve consistent success.


