


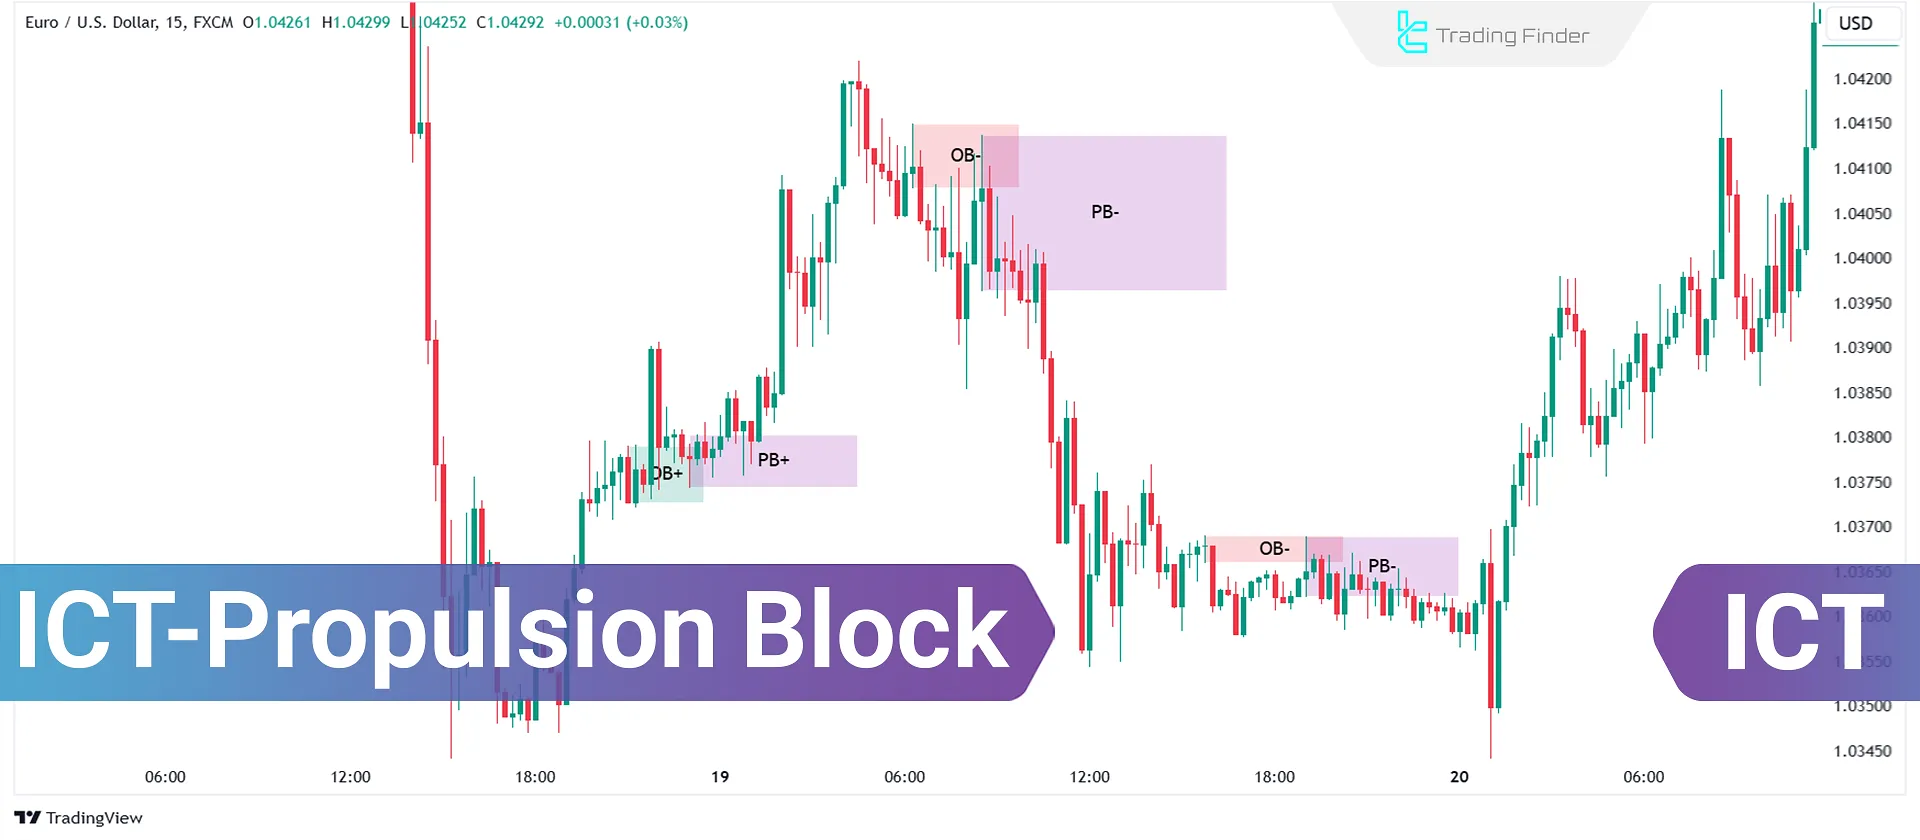
The ICT Propulsion Block is a key ICT trading concept that helps identify precise price movements. This concept focuses on candles interacting with order blocks and generating strong price movements.
This structure, after the accumulation of liquidity in a specific range and then the market’s reaction to a valid Order Block, activates institutional order flow and initiates a directional move with a high probability of success.
Within this zone, the Institutional Imbalance significantly widens the gap between buy and sell orders and creates the foundation for a rapid price surge.
When the price returns to the propulsion block for the second time, the momentum increases and the trend continues strongly.
These characteristics turn the propulsion block into a precise analytical reference for identifying sensitive market zones, especially in strategies based on liquidity and Order Block behavior.
What is ICT Propulsion Block in ICT?
In general, the term "Propulsion" means "to propel forward." In trading, this concept refers to a single candle that pushes the price away from itself.
The ICT Propulsion Block (PB) is a candle that trades within an order block and then drives the price away from it.
A sharp and sudden reaction occurs when the price returns to the Propulsion Candle, allowing traders to capitalize on it.
Difference Between the Propulsion Block and the Order Block in the ICT Style
In the ICT price-action methodology, the visual similarity of structures leads many traders to regard the Propulsion Block (PB) as equivalent to the Order Block (OB).
However, these two zones differ deeply and fundamentally in their formation logic, their role in liquidity flow, the strength of momentum they represent, and the timing they offer for entries.
A precise understanding of this distinction clarifies the position of each of these structures within price movement and makes the ICT analytical framework more purposeful and transparent.
In the table below, the Order Block and the Propulsion Block are compared professionally:
Feature | Order Block (OB) | Propulsion Block (PB) |
Nature | Institutional pending order zone | A single candle formed after order activation |
Role | Origin of the initiation of the move | Accelerator and confirmer of momentum strength |
Formation Timing | Before the main move | After the move begins and imbalance is created |
Structure Strength | Lower strength due to incomplete order release | Higher strength due to directional order flow |
Retracement Behavior | Slower return, milder reaction | Faster return, sharper reaction |
Entry Placement | Early entries or anticipatory entries | Higher-probability entries after confirming strength |
Analytical Application | Identifying the origin of the move | Selecting a higher-quality entry point |
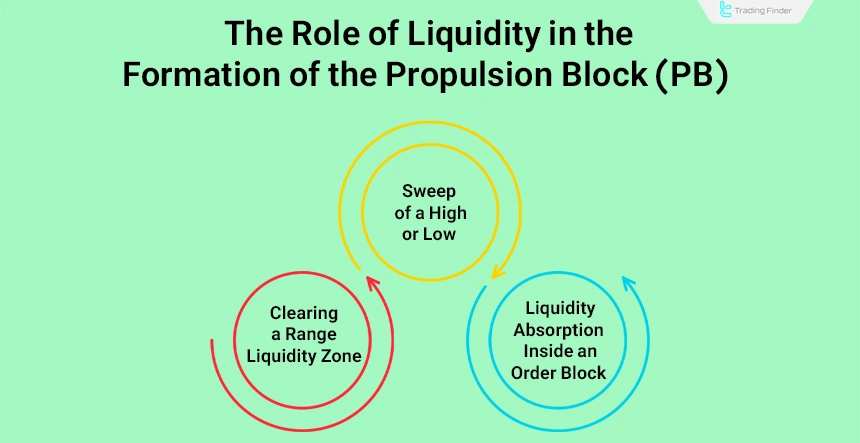
Role of Liquidity in the Formation of the ICT Propulsion Block
No valid Propulsion Block forms without the accumulation of Liquidity, and the most important liquidity patterns preceding this structure include:
- Sweep of a high or low: the market first triggers the stop-losses of retail traders and, after clearing liquidity, creates the Propulsion Block in the opposite direction;
- Clearing a Range Liquidity zone: when the market compresses several consecutive candles within a tight area and then suddenly sweeps the liquidity, the probability of forming a Propulsion Block increases noticeably;
- Liquidity absorption inside an Order Block: when an Order Block becomes active, part of the liquidity is naturally absorbed, and the Propulsion Block appears as the exit candle originating from that same Order Block.
The importance of liquidity for the Propulsion Block comes from the fact that this structure is essentially the direct response of Institutional Order Flow, and as long as Smart Money does not have sufficient liquidity available for entry, the Propulsion Block will not form.
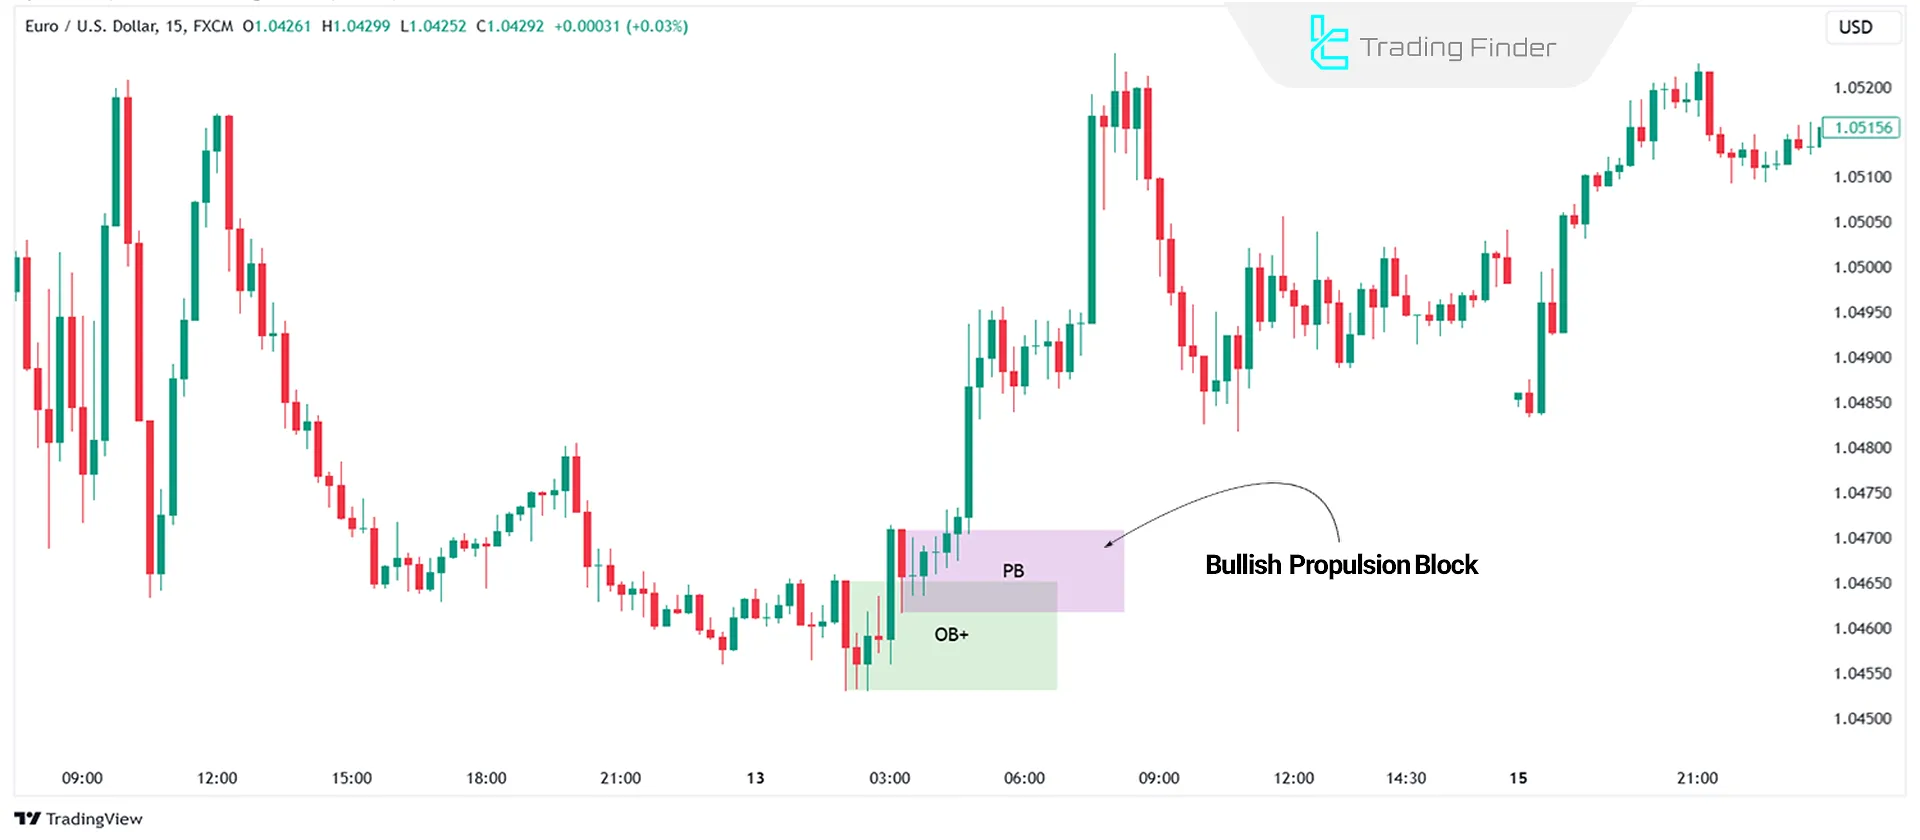
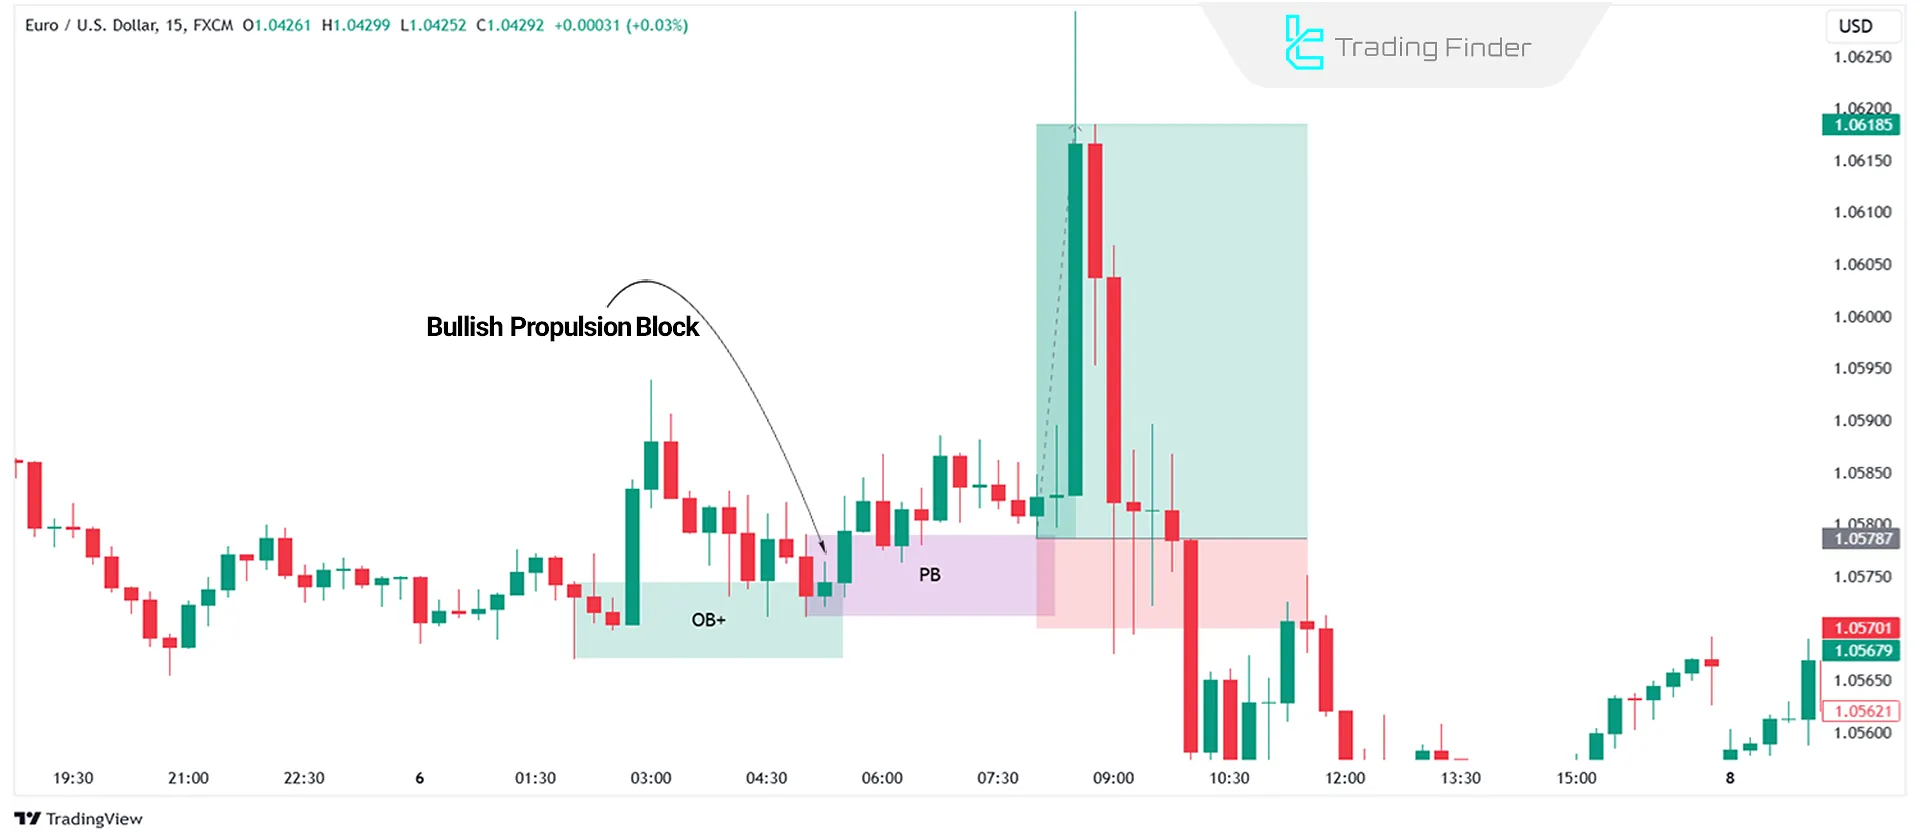
Bullish ICT Propulsion Block
A Bullish ICT Propulsion Block (PB+) is the last bearish candle that enters a bullish order block and then pushes the price upward.
When the price returns, the Propulsion Candle acts as support and rises again.
How to Trade the Bearish ICT Propulsion Block
In the bullish ICT Propulsion Block setup for a buy entry, the following steps are followed:
- Identifying the Mean Threshold of the Propulsion Candle: using the Fibonacci tool, the distance between the high and low of the Propulsion Candle is measured, and the 50% level is marked as the midpoint reference;
- Evaluating the quality of the block: the bullish structure is considered valid as long as the price moves above the midpoint level of the block and does not consolidate below this level;
- Waiting for the price retracement: the chart is monitored until the price returns to the body of the Propulsion Candle and retests this zone;
- Entering the buy trade: as the price approaches the midpoint of the block, the buy entry is triggered; the stop-loss is placed a few pips below the low of the Propulsion Candle, and the take-profit is set at the next liquidity zone or Fibonacci expansion levels.
Consistent execution of these steps turns the bullish ICT Propulsion Block setup into a coherent and purposeful trading framework within the ICT style.
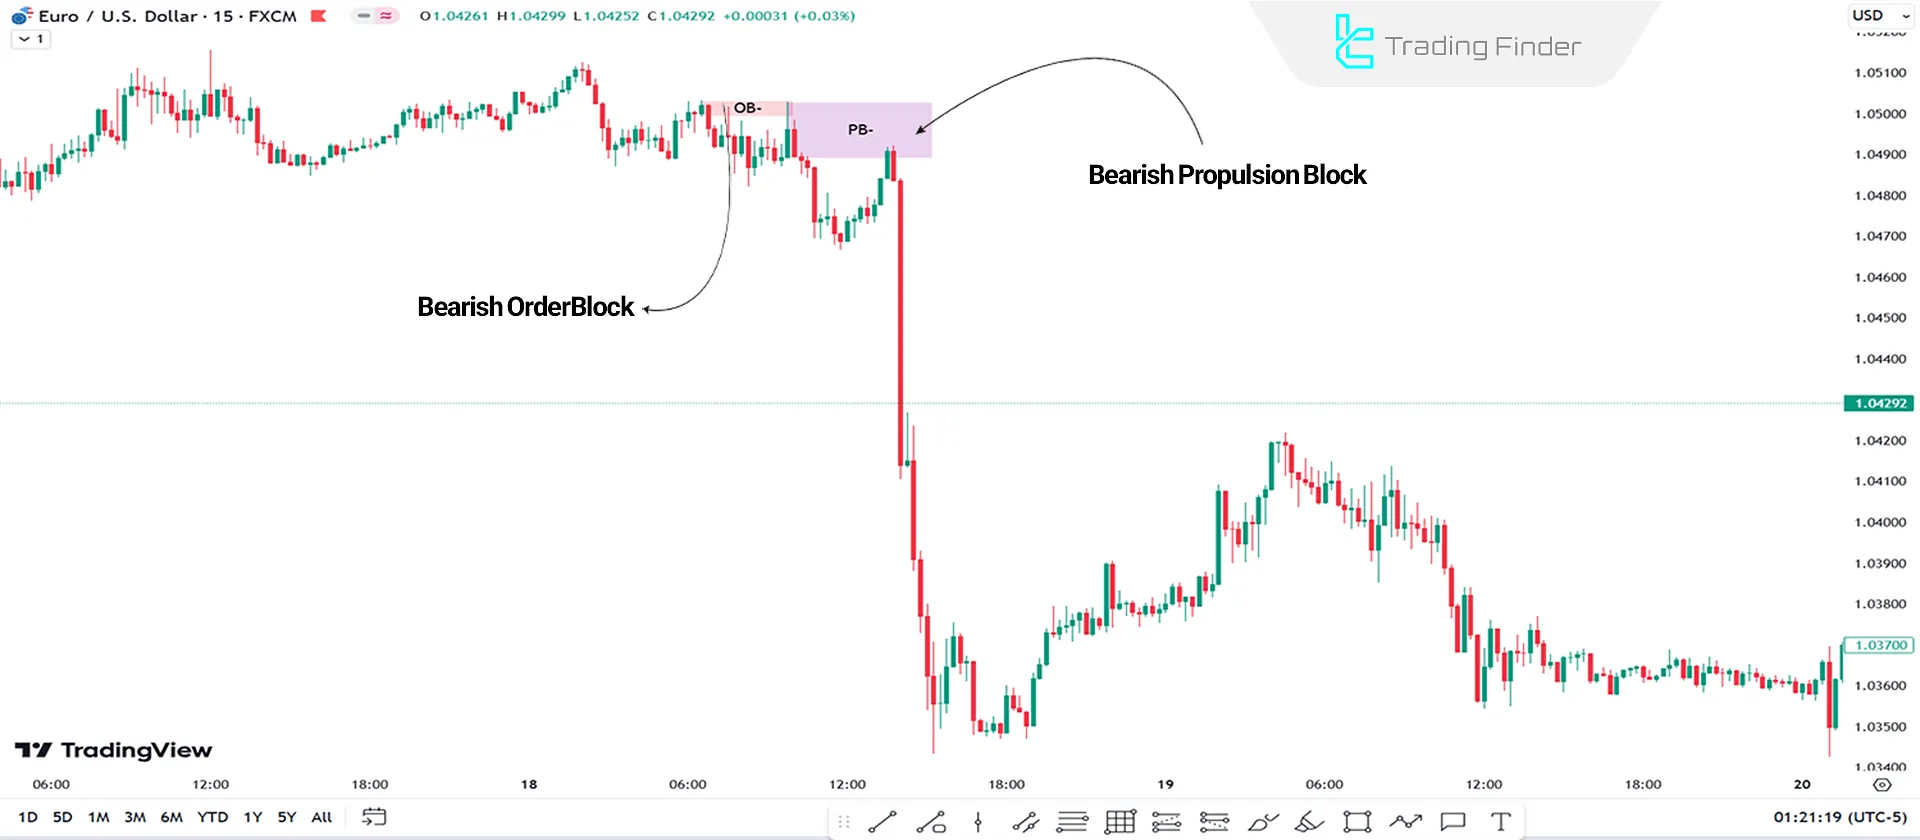
Bearish ICT Propulsion Block
A Bearish ICT Propulsion Block (PB-) is the last bullish candle that enters a bearish order block and then pushes the price downward.
When the price returns, the Propulsion Candle acts as resistance, and the price declines again.
How to Trade with Bearish ICT Propulsion Block
For trading the bearish ICT Propulsion Block, the following steps are followed:
- Identifying the Mean Threshold of the candle (Mean Threshold): using Fibonacci, the distance between the high and low of the Propulsion Candle is measured, and the 50% level is defined as the retracement zone;
- Evaluating the quality of the block: the price must not move below the midpoint level of the block (MT), and the validity of the structure is preserved only as long as this level remains unviolated;
- Wait for the price to return: you wait for the price to return to the Propulsion Candle and retest the zone;
- Entering the sell trade: the sell entry is taken when the price reaches the midpoint level of the block; the stop-loss is placed a few pips above the high of the Propulsion Candle, and the take-profit is set based on the next liquidity pool on the sell side (Next Liquidity Pool) or Fibonacci levels.
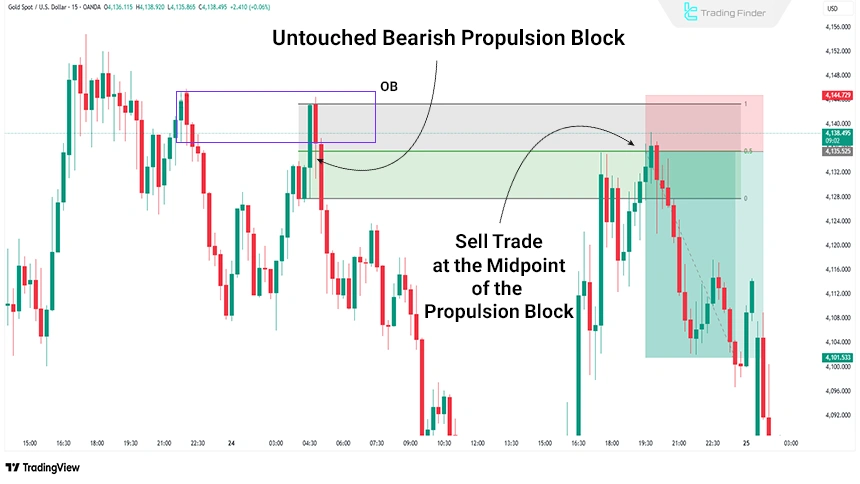
Example of Trading the Bearish Propulsion Block
On the 15-minute chart of XAU/USD, an untouched Propulsion Block formed as a result of the reaction to a valid Order Block.
When the price reaches the midpoint of this block, a sell trade can be executed, and the stop-loss can be placed with a small buffer above the Propulsion Block. The target for this trade can be set at a 2R reward level or at the next liquidity zones ahead.
Types of Propulsion Blocks Based on Market Structure (MSS and FVG)
The ICT style does not limit Propulsion Blocks only to bullish and bearish forms; rather, based on market structure, two types of PBs can be identified. In the following, we examine the types of Propulsion Blocks based on market structure:
Propulsion Block After a Market Structure Shift (MSS)
This type of Propulsion Block forms when the market, after accumulating Liquidity, prints a valid Market Structure Shift, and then the Propulsion Block appears in the same direction as the shift. This category offers the highest quality, and its characteristics include:
- Precise formation immediately after the structure break;
- Often accompanied by a Fair Value Gap;
- More reliable entry with a smaller stop-loss.
Propulsion Block Inside an Imbalance (FVG)
This type of block is created when, after the formation of a Fair Value Gap, the price prints an impulsive candle within the same zone, and the Propulsion Block forms inside the imbalance. The characteristics of this type of Propulsion Block include:
- Very fast reaction;
- Formation typically on lower timeframes (m1–m5);
- Suitable for scalping and intra-day trading.
More explanations about the Propulsion Block (PB) are provided in the educational video by the TTrades channel, which interested users can refer to:
Invalid and Failed Propulsion Block (Failed Propulsion Block)
Sometimes a PB forms, but instead of continuing the trend, it fails and the price moves in the opposite direction. This happens when:
- the PB is touched before being retested;
- the price returns to the PB slowly and without momentum;
- the trading volume of the PB candle is lower than the average volume of previous candles;
- the PB forms against the Daily Bias;
- the Order Block behind the PB is not valid or has already been consumed.
The definite signs of a failed ICT Propulsion Block include:
- the close of a full-bodied candle below the Mean Threshold level;
- complete filling of the FVG behind the PB;
- the price returning into the parent Order Block with no reaction.
Conditions for a Valid Propulsion Block (PB)
Not every candle that moves away from an Order Block is considered a valid Propulsion Block, and before any entry, the following criteria must be checked:
- presence of accumulated liquidity (Liquidity Pool) before the move begins;
- presence of an activated Order Block in the path of the movement;
- formation of an imbalance gap (FVG), or at least two impulsive candles after the Propulsion Block;
- the zone must not be touched again before the structure is retested;
- the Propulsion Candle must form with a clear and dominant body, generally larger than the wick;
- an increase in relative volume compared to the average volume of previous candles.
Following these criteria increases the probability of success for the Propulsion Block. In the ICT Propulsion Block tutorial article on the writofinance.com website, additional explanations about PBs are provided, which traders can refer to.
Propulsion Block Indicator in MetaTrader
The Propulsion Block Indicator (ICT Propulsion Block) in MetaTrader functions as a specialized tool for analyzing price structure based on the Smart Money concept and the ICT methodology.
It also identifies zones where the market returns to Order Blocks to complete the cycle of liquidity extraction, gap filling, and confirmation of the dominant directional bias.
These zones typically form after high-volatility phases and become levels with a high probability of strong price reactions.
The indicator, by analyzing the behavior of the latest retracement candle, detects blocks that act as Propulsion Blocks and, after absorbing liquidity, generate the energy needed for the trend to resume in the market.
- Download Propulsion Block Indicator for MetaTrader 5
- Download Propulsion Block Indicator for MetaTrader 4
Bullish Order Blocks are displayed in green, bearish Order Blocks in red, and Propulsion Blocks in lighter shades of these colors so that the trader can identify the direction of Order Flow at a glance on the chart.
This visual architecture makes monitoring liquidity behavior clearer in markets such as forex, cryptocurrency, stocks, forward markets, and corporate assets.
In an analytical scenario on a 4H timeframe of a currency pair, the return of price to a bullish Order Block absorbs resting liquidity, and a light green Propulsion Block forms on the chart, creating the foundation for the beginning of an upward wave and a Long entry.
Conversely, on the 1H timeframe of another currency pair, the price reaction to a bearish Order Block and the formation of a light red Propulsion Block signal seller dominance and increase the likelihood of a continued bearish trend.
This structure provides an objective framework for initiating Short trades. The indicator's internal settings are organized into four main groups:
- Display Setting: managing the display type of objects and blocks on the chart;
- Color Theme: choosing a light or dark theme based on the chart style;
- General Setting: controlling the general behavior and processing logic of the indicator;
- Showing Trends: displaying trend status related to Propulsion Blocks on the chart.
Overall, the ICT Propulsion Block indicator, by integrating the concepts of Order Block, Liquidity, Gap Fill, and Market Structure, establishes a robust framework for identifying more precise entry points and structuring more logical exits.
It also enables a deeper understanding of price dynamics in multi-timeframe analysis within MetaTrader.
Common Mistakes Traders Make When Using the Propulsion Block (PB)
A correct understanding of the Propulsion Block has practical value only when the trader can interpret it within the context of daily market behavior and liquidity flow.
Many common mistakes arise from a shallow interpretation or rushing to use the PB, while this tool only has real effectiveness when aligned with the daily bias, market structure, and lower-timeframe confirmations.
In the following, we discuss five of the common mistakes in using PB:
- Entering before the Propulsion Block (PB) is retested: entering immediately after the formation of the Propulsion Block is invalid and is only executed correctly when the price returns to the zone and retests it;
- Confusing PB with OB or FVG: not every impulsive candle is considered a PB, and it is valid only when it forms inside an activated Order Block and activates institutional order flow within that specific zone;
- Ignoring the Daily Bias: even a strong Propulsion Block, when positioned against the daily bias, increases the probability of failure and reduces the overall setup quality;
- Using an unsuitable timeframe: identifying the Propulsion Block on higher timeframes (H1–H15) and executing the entry on lower timeframes (m5–m15) strengthens the structure’s precision and creates a clearer entry point;
- Weak risk management: a large stop-loss, unclear target, or unplanned exit removes the advantage of the Propulsion Block and weakens the performance of the setup.
Conclusion
The ICT Propulsion Block helps traders identify precise entry points. This concept is helpful for scalping, day trading, and swing trading.
Bullish blocks are identified by the last bearish candle inside a bullish Order Block, and bearish blocks are identified by the last bullish candle inside a bearish Order Block.
To determine the midpoint level of the block, using the Fibonacci tool provides high precision, and after that, the price’s return to the midpoint zone must be monitored.
In all conditions, defining a clear stop-loss and take-profit for risk management is mandatory, and the block structure only maintains its effectiveness if these controls are in place.


