


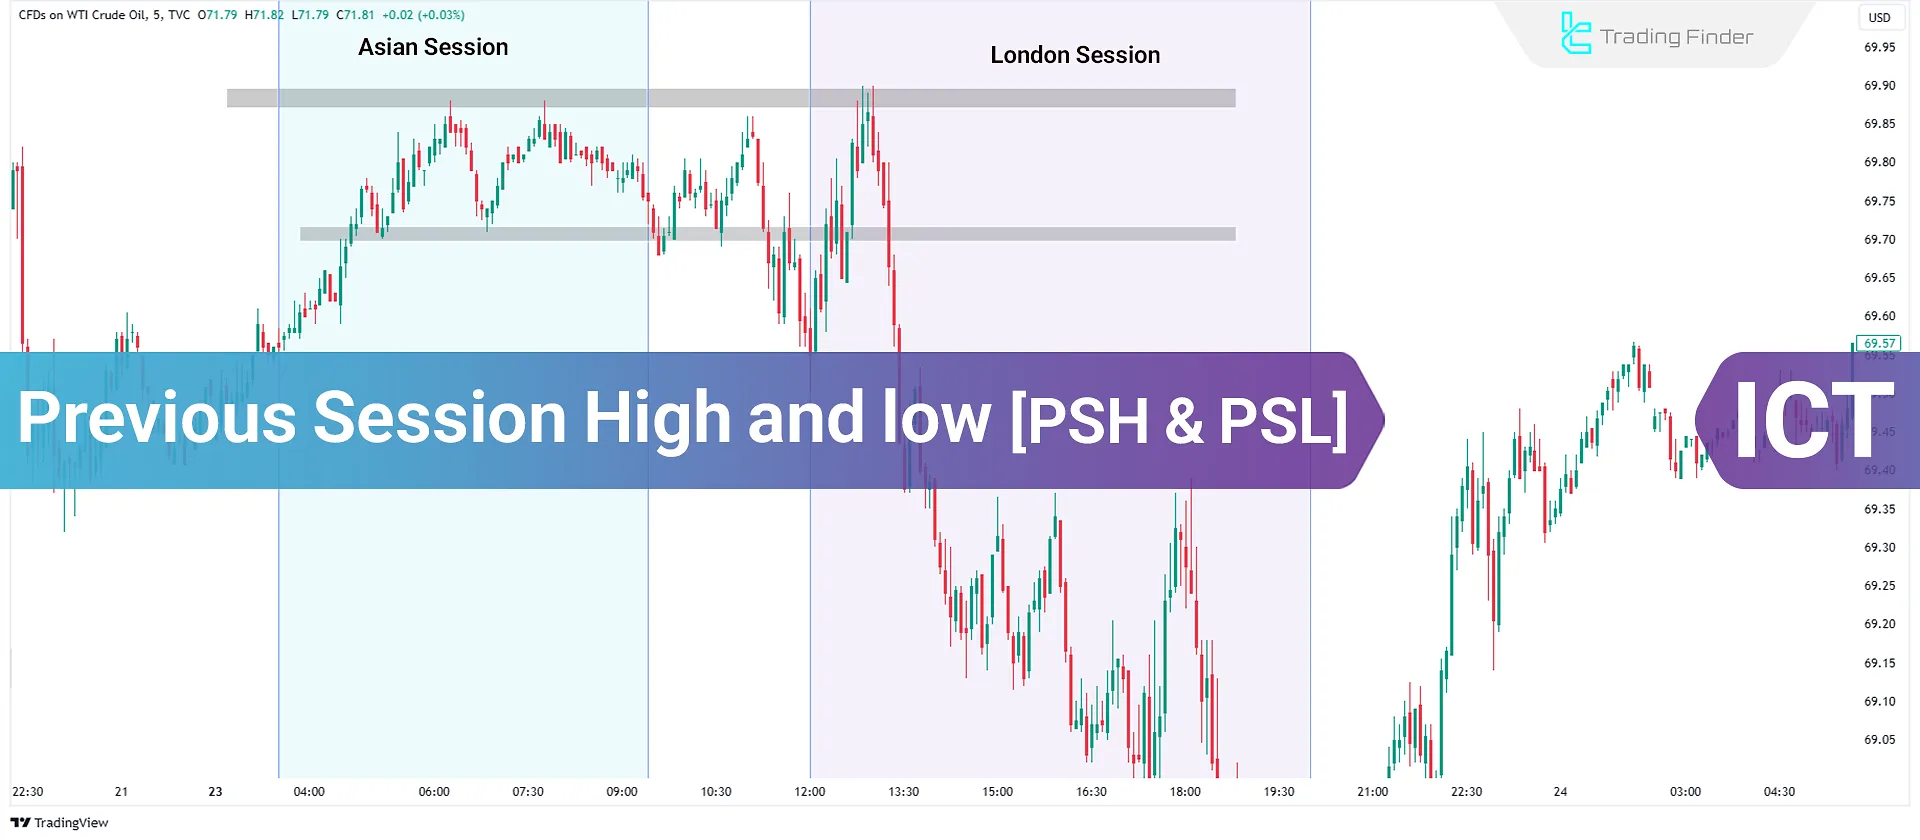
The Previous Session High (PSH) and Previous Session Low (PSL) are critical levels used in ICT style (Inner Circle Trader) and Smart Money Concepts (SMC) to identify key support and resistance zones in trading. These levels help traders predict market movements and structure their trades accordingly.
These two levels, in addition to defining liquidity zones, also reveal the probable direction of order flow in the current session. Moreover, combining price reactions to PSH and PSL with market structure, price bias, and session behavior can significantly improve short-term analysis accuracy.
What Are PSH and PSL?
The Previous Session High (PSH) refers to the highest price recorded in the prior trading session. This level is usually a point where the greatest amount of liquidity accumulates in the form of buy stop orders, because many traders exhibit similar behavior around structural highs and session highs.
In contrast, the Previous Session Low (PSL) is the lowest price of that same session. The previous session low is typically considered an area with a concentration of sell stop orders, and for this reason, in liquidity-based and institutional behavior analysis, it is regarded as a targeted level for manipulation or order accumulation.
In trading frameworks based on ICT and Smart Money Concepts (SMC), PSH and PSL do not merely function as simple highs or lows; rather, they are components of the market’s liquidity architecture. These levels indicate which areas the market recognized as movement boundaries in the previous session and which parts of price were left “untouched”.
Training on using PSH and PSL from ACY.com:
Advantages and Disadvantages of PSH and PSL
The previous session high and low are part of the market’s liquidity structure, and price behavior around these levels reveals important patterns of order flow.
Before applying these two levels in analysis, it is necessary to structurally examine their advantages and limitations in order to clarify their role in forming trading bias and identifying short-term market direction. Table of advantages and disadvantages of PSH and PSL:
Advantages | Disadvantages |
Precise identification of liquidity accumulation zones (Buy Stops / Sell Stops) and the ability to analyze institutional behavior | Possibility of false signals in low-volume markets or sessions with insufficient liquidity |
Providing clear reference points for setting stop-losses, targets, and entry zones | False breaks during news releases and fundamental data announcements |
Helping identify short-term directional bias and order absorption zones | Ineffectiveness in unsuitable timeframes or during session overlaps |
Compatibility with ICT and SMC structures and the ability to combine with OB, FVG, and BOS/CHoCH | Need for correct interpretation |
Suitable for day trading and scalping due to rapid price reactions to these levels | Potential to mislead traders if not aligned with the prevailing trend or liquidity flow |
High applicability in analyzing breakouts, reversals, and forming trading bias | Reduced validity when price has touched the level multiple times |
How to Trade Using the Previous Session High (PSH)?
Price reaction to PSH is one of the most prominent indicators for identifying liquidity flow direction in the current session.
This level shows where the market encountered supply constraints in the previous session and which point can now act as a decision-making reference.There are three effective ways to utilize PSH in trading:
Resistance Level
If the price approaches the Previous Session High (PSH) but fails to break above it, this level acts as a resistance.
It may form structures like a Fair Value Gap (FVG) or an Order Block (OB). In this case, traders can enter sell positions.
Breakout Strategy
If the price breaks above PSH in the current session, it signals bullish continuation and can act as a support level or a breaker block. Traders can use this breakout toenter buy orders.
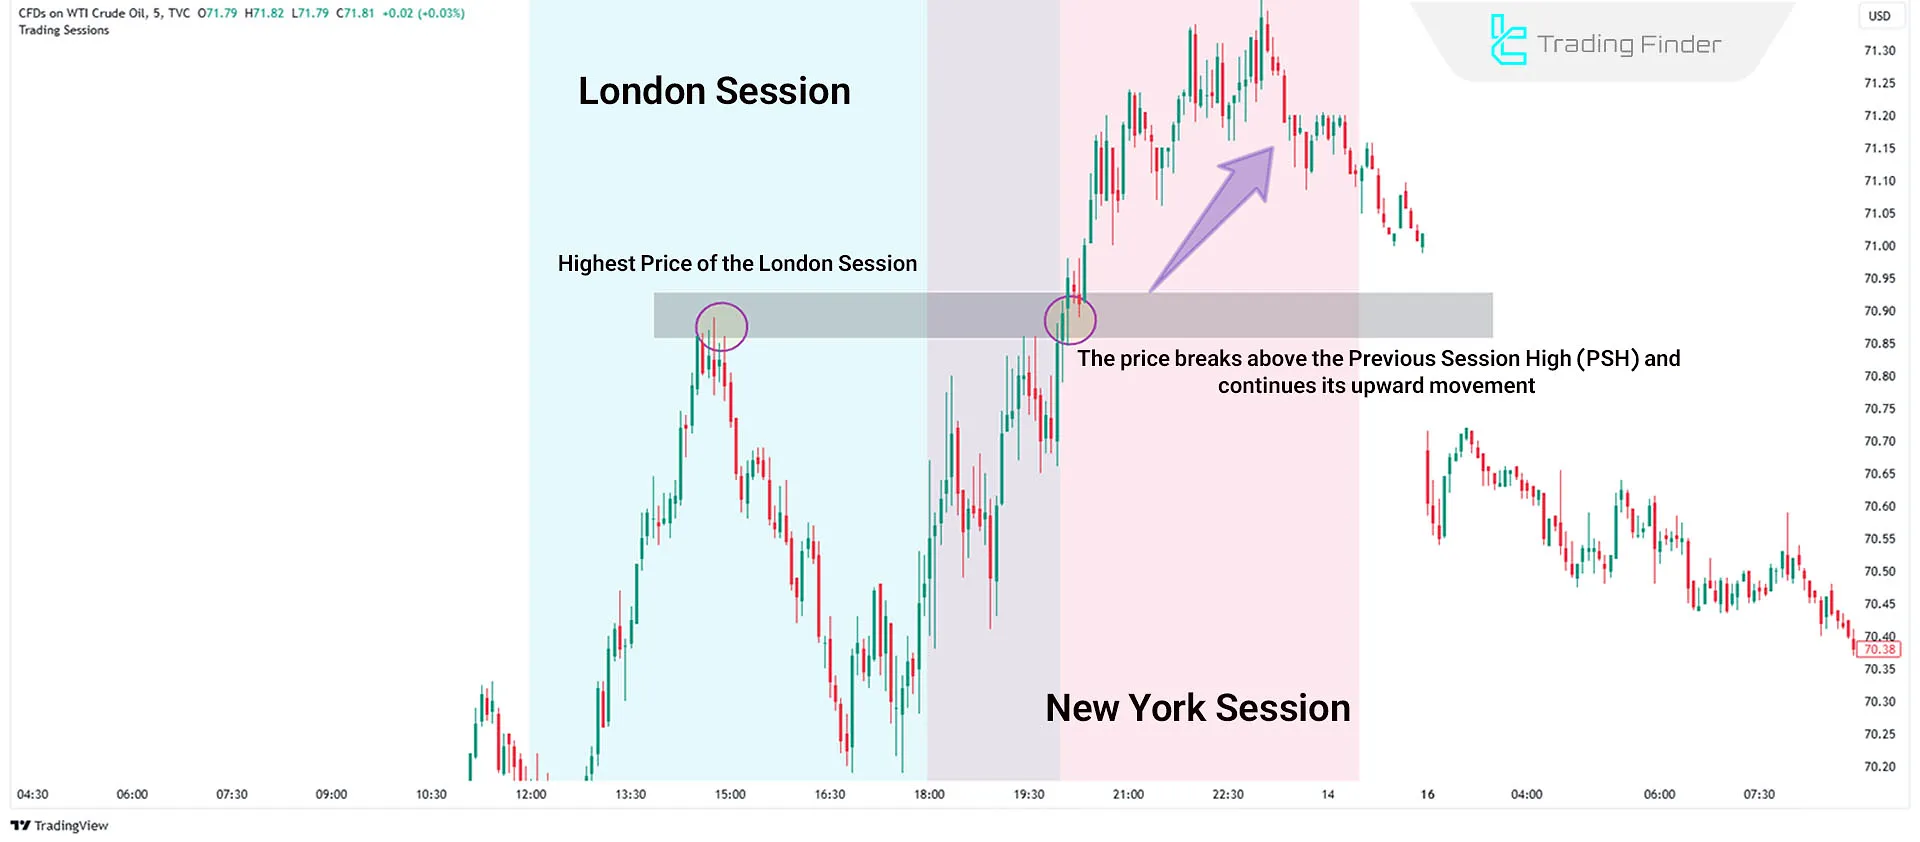
Trend Confirmation
A successful PSH breakout is often an indicator of market strength, confirming a bullish trend. Traders can use this confirmation alongside other bullish signals for trade validation.
This breakout usually occurs alongside the absorption of upside liquidity and indicates that buy-side order flow has become dominant over the short-term market structure.
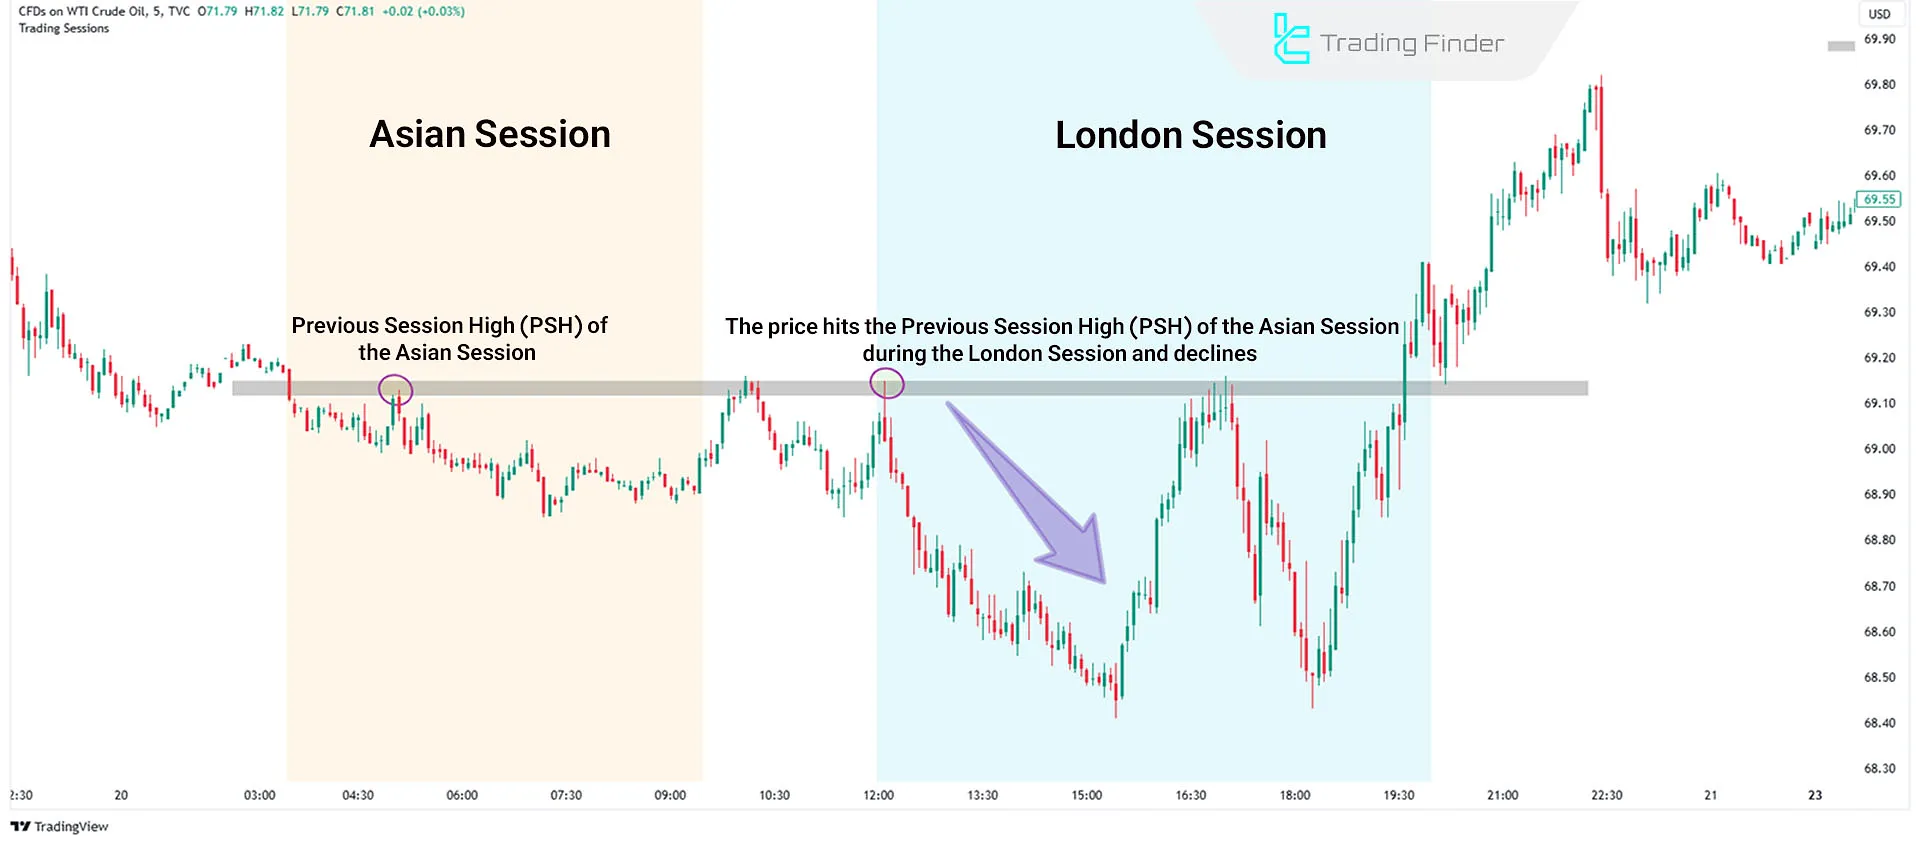
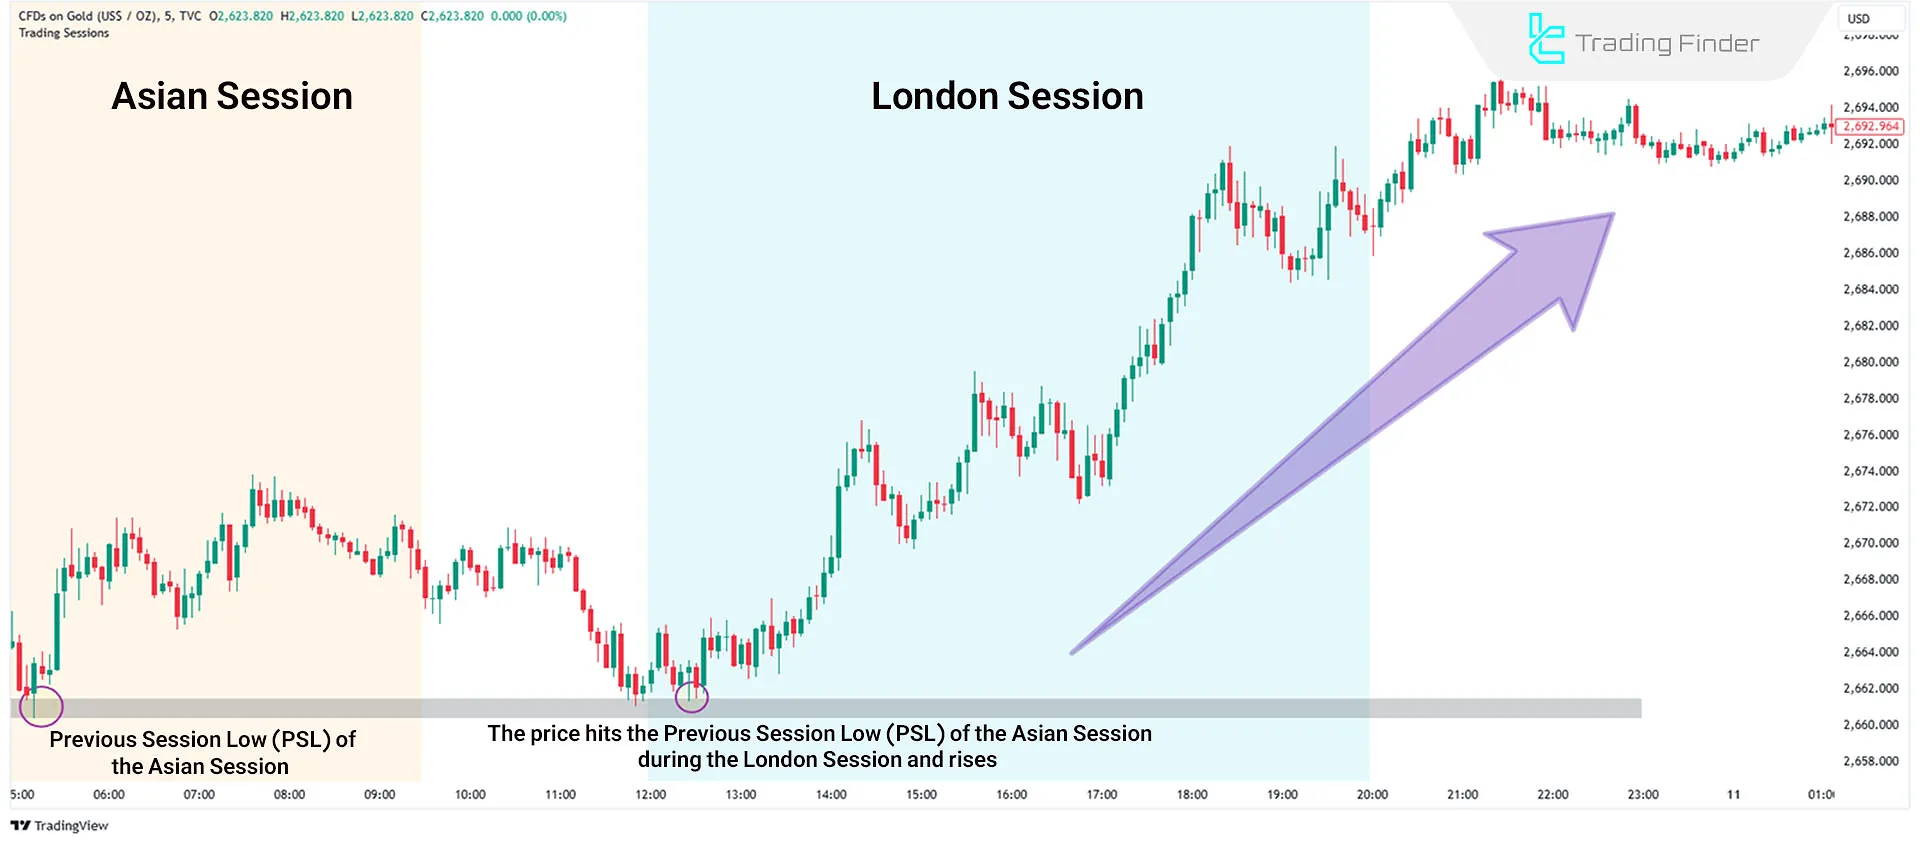
Example of Using PSH
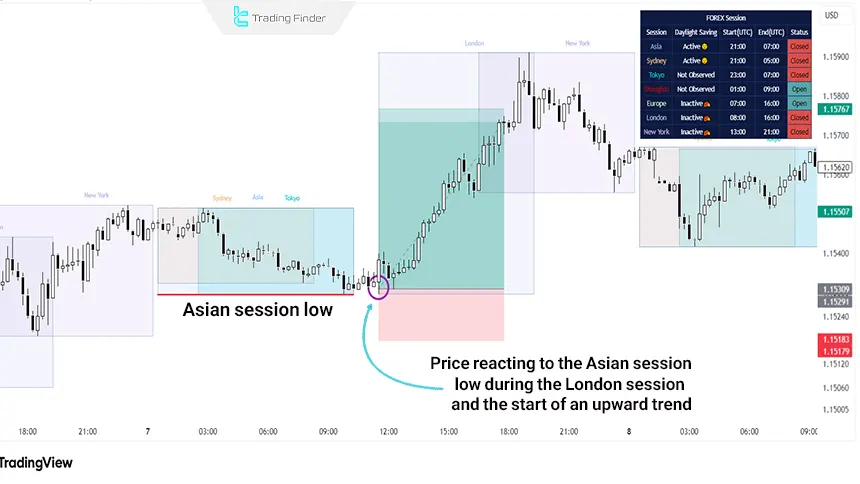
On the EUR/USD chart, the price reaction to the Asian session low at the beginning of the London session is shown; an area that acted as a liquidity zone and defined the short-term market direction.
Price tapping into this low activated the collection of resting orders and set the stage for the subsequent bullish move. The post-reaction structure also shows that the market completed its bullish phase by breaking internal fluctuations.
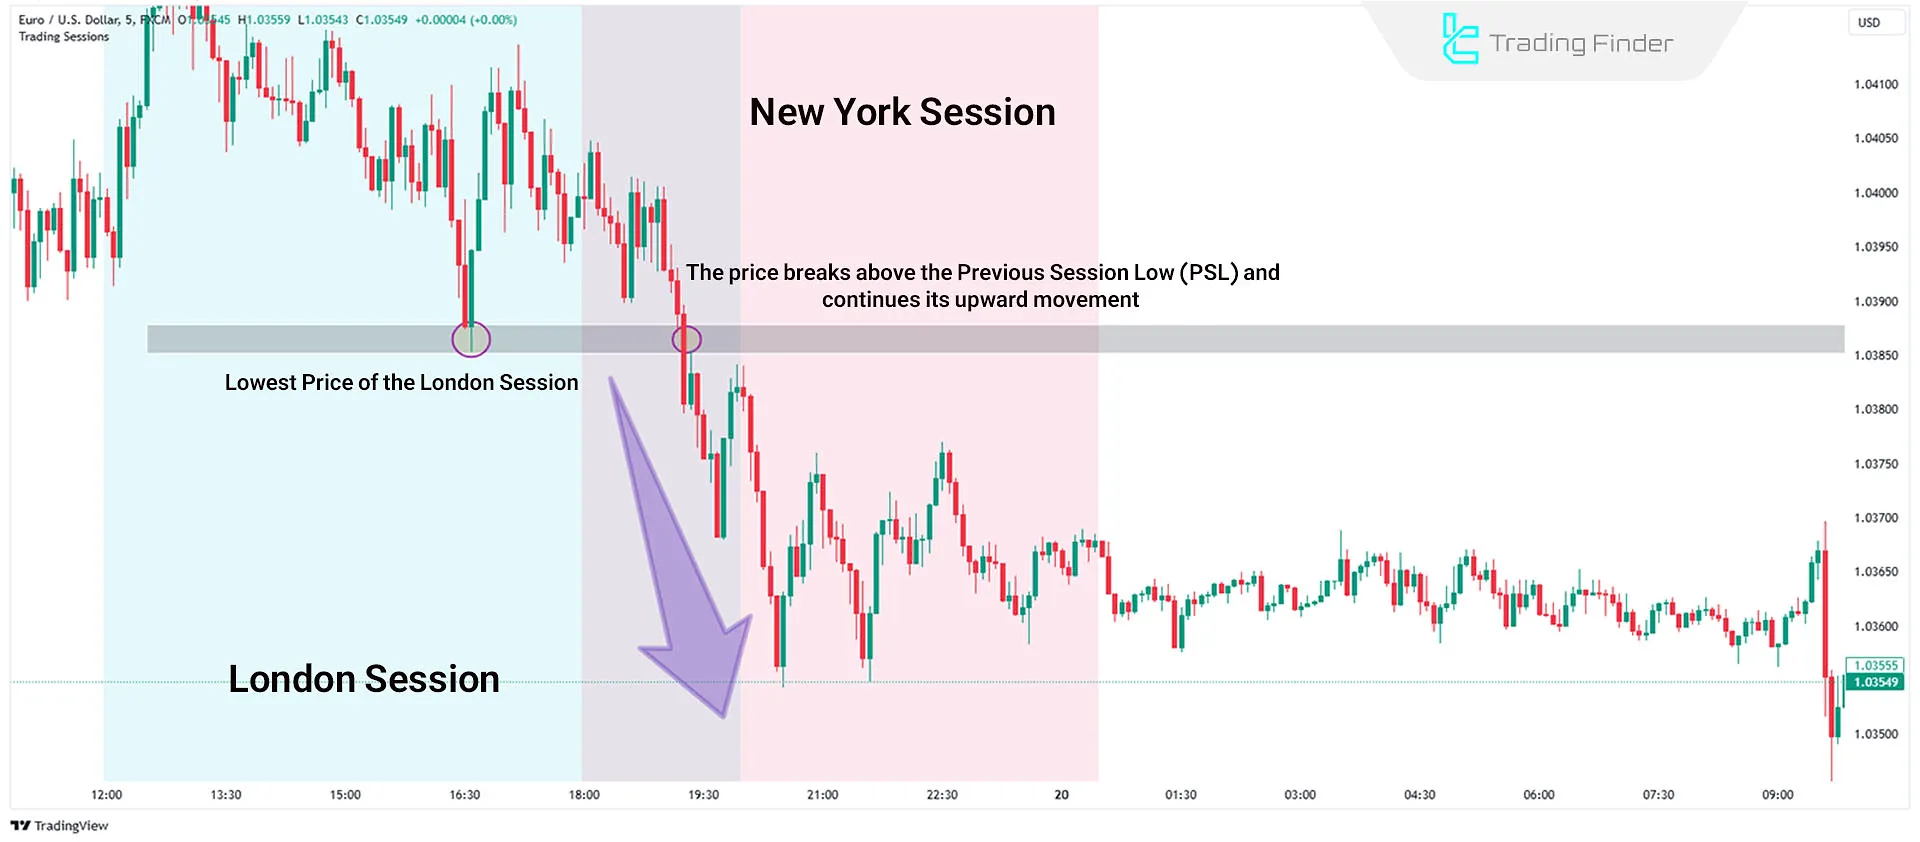
How to Use the Previous Session Low (PSL)?
Price behavior around PSL provides a precise view of liquidity direction and the state of selling pressure in the current session.
This level identifies where the market experienced a lack of demand in the previous session and which area can now generate the primary reaction.
The three key scenarios (support, breakdown, and trend confirmation) create a coherent framework for analyzing bearish bias and making trading decisions based on the previous session low. There are three main ways to apply PSL in trading:
Support Level
If the price approaches the Previous Session Low (PSL) but fails to break below it, this level acts as a support. Traders can look for buy opportunities in this scenario.
Breakdown Strategy
If the price breaks below PSL, it signals bearish continuation and the level may turn into resistance. Traders can use this breakdown to enter sell positions.
Trend Confirmation
A PSL breakout often indicates market weakness and confirms a bearish trend. Traders can use this as confirmation for bearish trade setups.
This behavior usually occurs after liquidity has been swept below the low and indicates that selling pressure remains active and the market has the capacity to continue moving toward lower levels.
Challenges and Limitations of using PSH and PSL
The application of PSH and PSL is only valid when market behavior around these levels is aligned with the liquidity structure. However, a set of structural factors can reduce the accuracy of these levels and hinder correct interpretation of order flow.
The following are the most important limitations that should be considered before relying on the previous session high and low in analysis or trade entry:
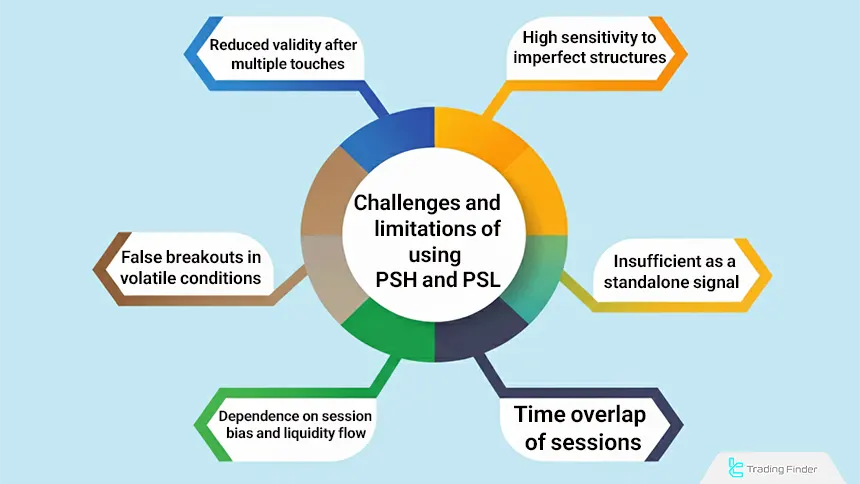
Reduced Validity After Multiple Touches
Each time price touches a PSH or PSL, part of the liquidity behind that level is consumed. As the volume of resting orders decreases, the structural role of the level weakens and the probability of a valid reaction declines.
As a result, traders should reassess the validity of the level with every subsequent touch and avoid relying on levels that have been used multiple times.
False Breakouts in Volatile Conditions
During news releases or periods of increased session volatility, an apparent break of PSH or PSL may only be a liquidity grab-a move designed to collect orders before reversing in the opposite direction. In such situations, relying on the level break can create a trading trap.
Therefore, breakout confirmation should be accompanied by additional evidence such as market structure, confirmation candles, and post-news price behavior.
Dependence on Session bias and Liquidity Flow
The previous session high and low have no meaning without an understanding of the market’s primary bias. If the dominant direction is unclear or order flow between sessions is contradictory, these levels will not provide predictable behavior.
Thus, the validity of the previous session high and low increases only when they are interpreted within the framework of the prevailing market bias and the logical continuation of liquidity flow.
High Sensitivity to Imperfect Structures
When the previous session has a small trading range, PSH and PSL do not form meaningful or high-pressure levels. This often occurs in low-volume sessions such as parts of the Asian session, causing the derived levels to lack analytical value.
In such conditions, relying on PSH and PSL without alignment with increased volume, meaningful liquidity displacement, or confirmation from the next session leads to weak and misleading signals.
Insufficient as a Standalone Signal
The previous session high and low identify liquidity locations, but they do not determine direction. Without combining them with market structure, OB, FVG, or order flow, using these levels in isolation results in incomplete analysis.
These levels only become decision-making tools when interpreted in alignment with the market’s structural context and signs of liquidity activation.
Session Time Overlap
In some assets, temporal overlap between sessions causes the previous session high and low to overlap with liquidity zones of the new session. This reduces the level’s distinction and reliability.
In such cases, identifying true liquidity boundaries requires precise separation of order entry timing and evaluation of price reactions during session overlap.
Forex Sessions Indicator for PSH and PSL
The Forex sessions indicator is a specialized tool for displaying the opening and closing times of major financial markets, enabling traders to analyze price behavior within the context of each session’s activity.
By defining time ranges for sessions such as Asia, Europe, and the US, this tool allows observation of each period’s volatility structure and the impact of trading volume on price movement.
Displaying these ranges as organized time blocks simplifies the identification of low- and high-volatility periods and provides a suitable foundation for trade planning. Educational video on using the Forex sessions indicator:
During the Asian session, liquidity typically flows at lower levels and price movements are more orderly compared to later sessions.
This characteristic makes the highs and lows of this period highly important for traders in subsequent sessions, as they often act as key liquidity zones.
Currency pairs linked to Asian economies are also more active during this period. With the start of the European session, trading volume increases and directional movements become more apparent.
As major financial centers in this region begin operations, greater structural volatility usually forms, and price reactions to previous session highs and lows gain significance.
The US session accounts for the highest daily volume, and its intense activity-especially during overlap with the European session-creates ideal conditions for volatility-based traders.
In this period, breakouts, explosive moves, and liquidity-driven behaviors are more commonly observed.
In addition to color-coded session displays, this indicator provides a time panel that precisely shows the opening and closing hours of different markets. This feature is especially important for traders who make decisions based on market timing and peak liquidity hours.
The tool’s settings allow enabling or disabling each session, changing colors, and setting custom times. This flexibility enables traders to design their preferred time structure and maintain an analytical environment aligned with their trading style.
Overall, by offering a clear view of market time cycles, this indicator helps traders select more precise setups and align their strategies with the natural behavior of each session.
Download link for the Forex sessions indicator for use with PSH and PSL:
Conclusion
The Previous Session High (PSH) and Previous Session Low (PSL) serve as key support and resistance levels that help traders anticipate price movements.
These levels allow traders to analyze market behavior, identify entry and exit points, and determine trend direction.
A price reaction at these levels can signal trend continuation or potential reversal, making them valuable tools in ICT and SMC trading strategies.


