


The Quasimodo (QM) pattern is an advanced concept in technical analysis under the RTM (Read the Market) style. It is used to identify trend reversals and market turning points.
This pattern combines shallow breakouts with changes in market structure, often appearing at key areas such as resistance and support levels.
Definition of the Quasimodo (QM) Pattern
The QM Pattern (also known as Over and Under) consists of five steps:
- Formation of an initial high or low
- Formation of a new low or high (opposite to the first step)
- Market creates a Higher High (HH) or Lower Low (LL), surpassing the previous level
- Market then moves downward (or upward) to form a new low or high, lower (or higher) than the previous one.
- Price returns to the initial level but does not breach it.
This pattern acts as a reversal tool, signaling the end of the current trend and the start of a new one.
Steps to Identify the QM Pattern
To spot this pattern on a chart, consider the following:
- Observe the previous trend (uptrend or downtrend)
- Examine how the price reaches new levels at key points
- Identify the point where price returns but does not surpass the previous breakout, marking a suitable entry point
How to Trade Using the QM Pattern
To trade based on the QM Pattern, follow these steps:
- Determine the Trend: First, identify the main market trend (uptrend or downtrend).
- Identify Key Levels: Pay attention to previous highs and lows. The key area is where the price retraces but fails to break through.
- Enter a Trade:
- Sell trades: Enter near the retracement level of the high
- Buy trades: Enter near the retracement level of the low
- Risk Management:
- Place your stop-loss above the high (for sell trades) or below the low (for buy trades).
- Set your take-profit targets based on risk-to-reward ratios (commonly 1:3).
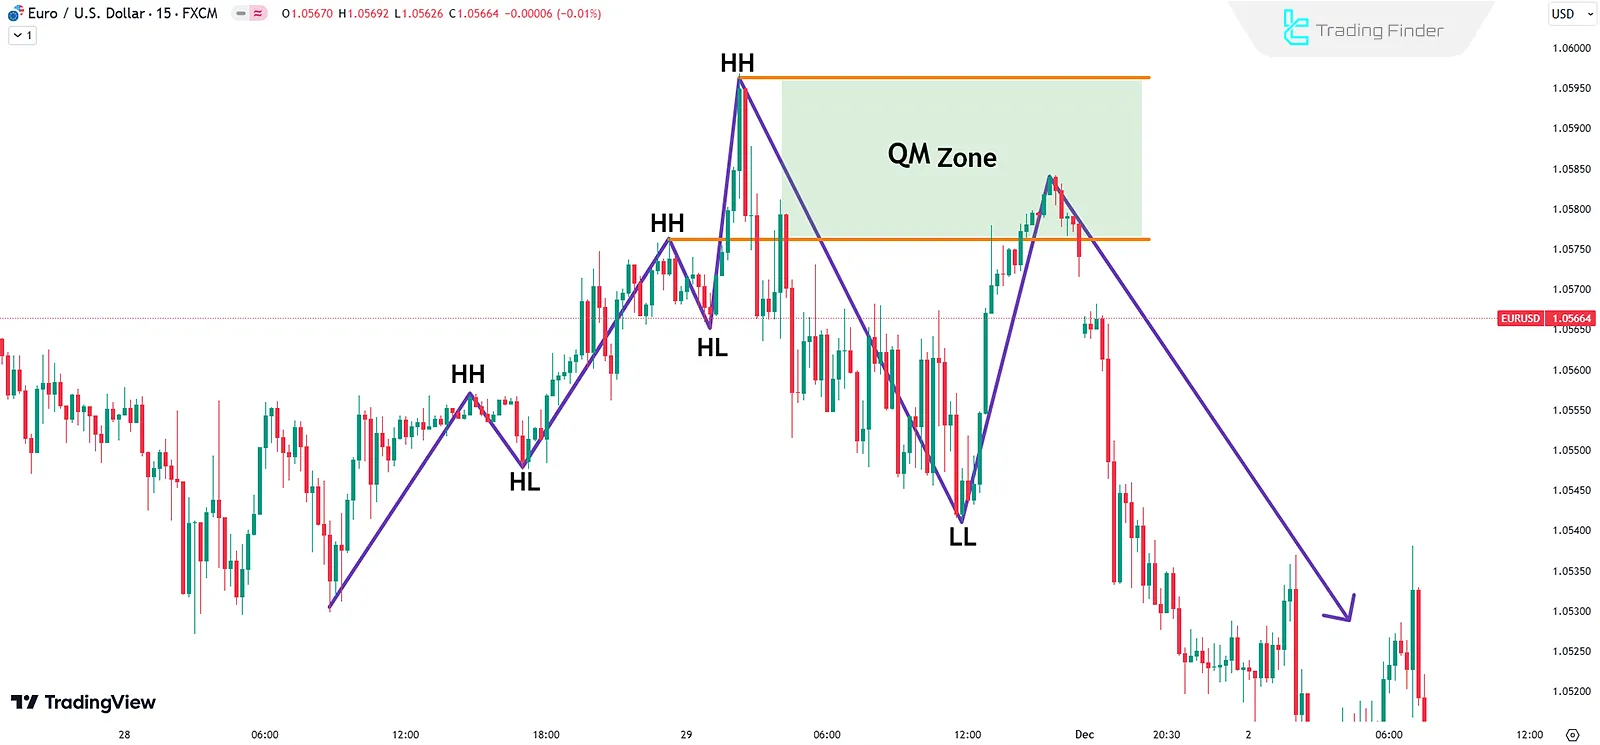
Practical Example of the QM Pattern
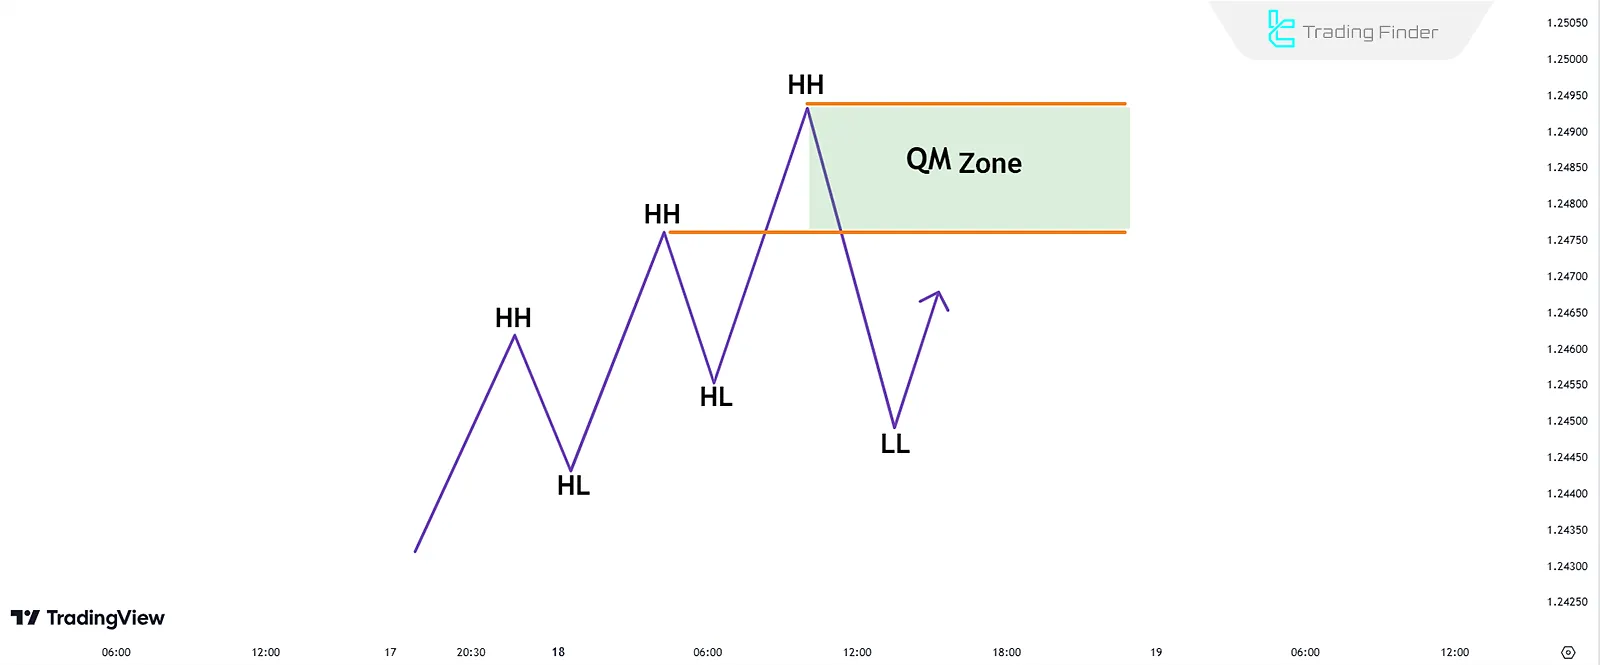
In the example below, a real case of the QM pattern is illustrated. The market is in an uptrend, and the following steps occur:
- The price creates a High (H) and then a Low (L)
- It rises again to form a Higher High (HH)
- It then falls, creating a Lower Low (LL)
- Finally, the price retraces to the initial high but does not surpass it
At this point, you can execute a sell trade, setting your stop-loss above the Higher High (HH).
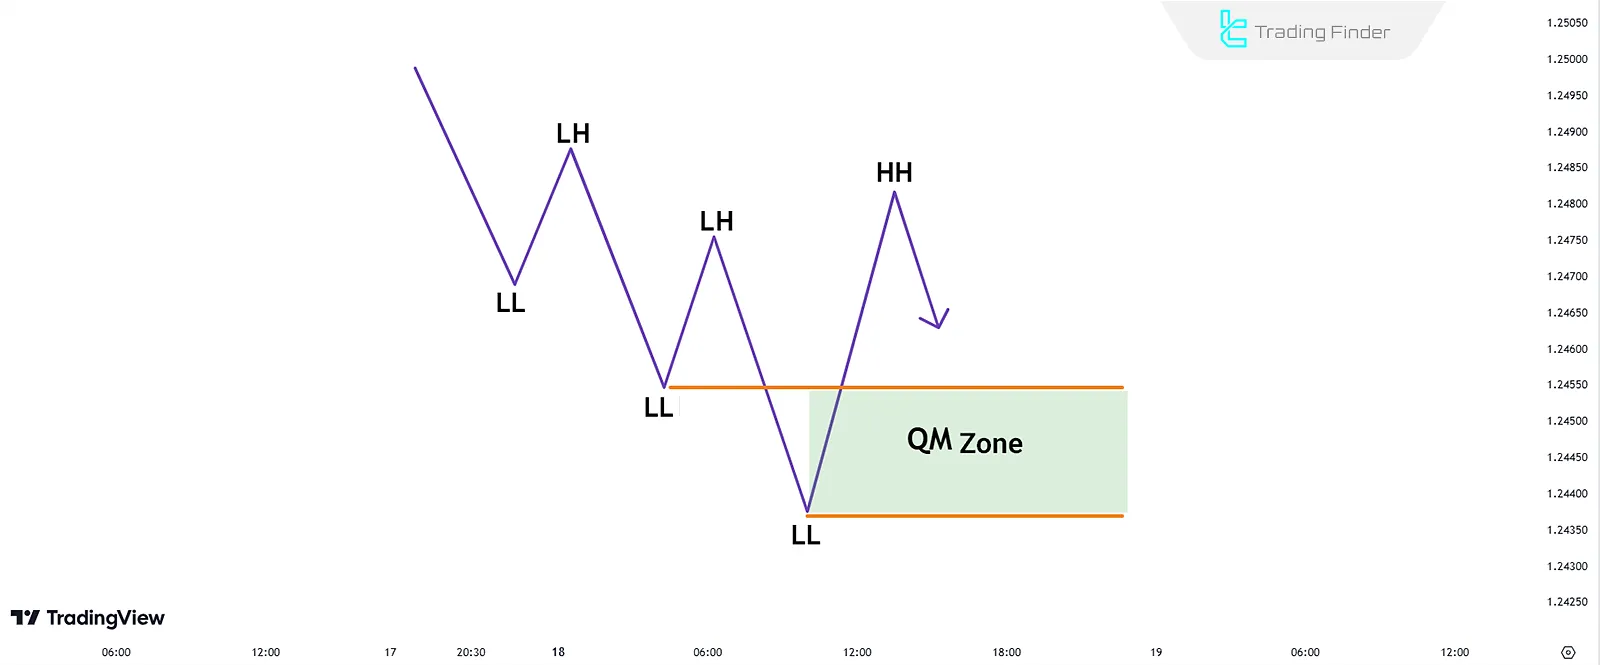
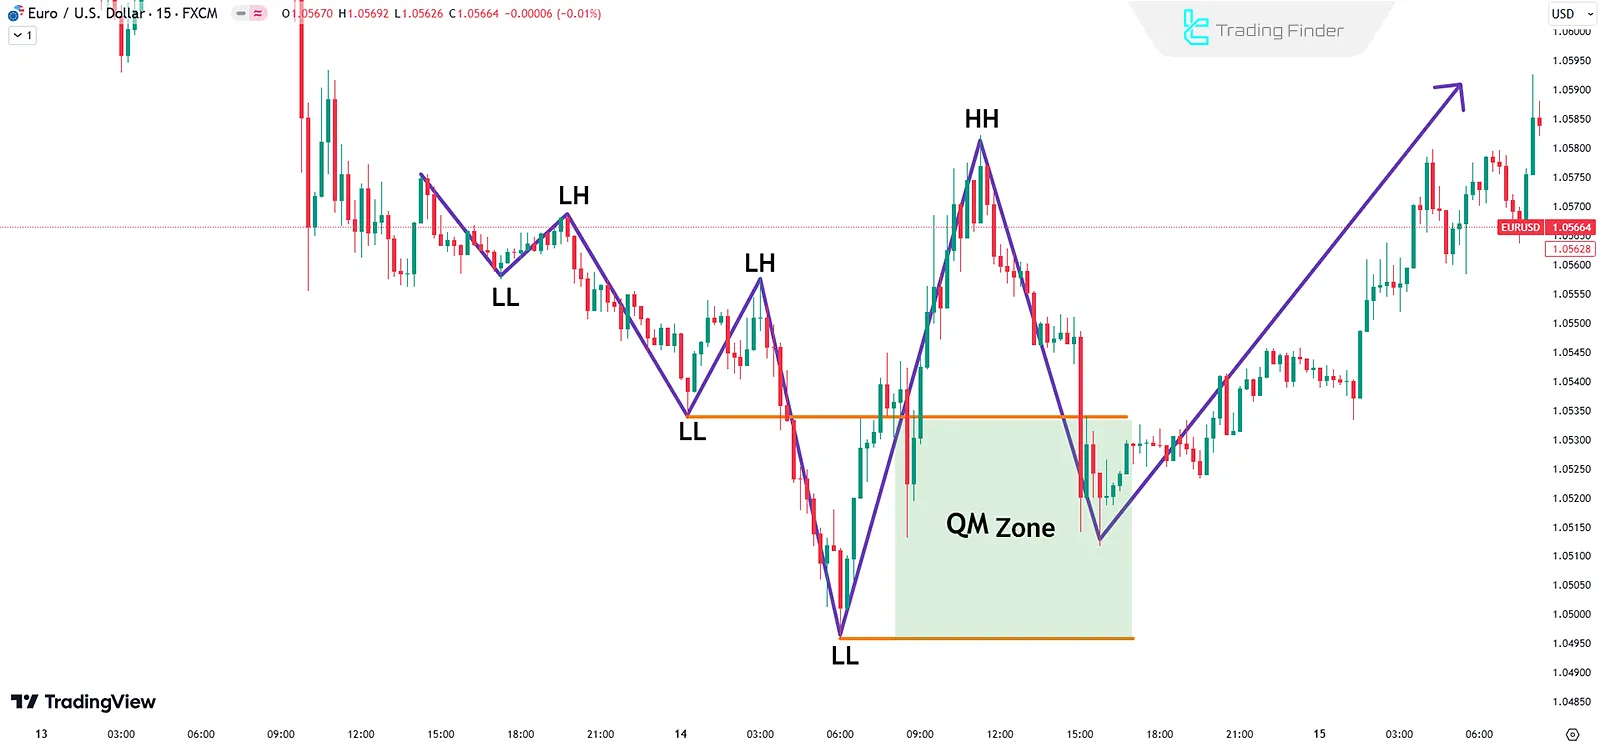
In the chart below, the reverse scenario (a transition from a downtrend to an uptrend) is shown:
Key Points for Using the QM Pattern
- Supply and demand zones are useful for locating this pattern.
- The distance between highs and lows should not be too large, as this determines the entry and exit zones; A wide distance can disrupt the risk-to-reward balance.
- This pattern is most effective when combined with other analyses, such as divergences or key levels.
Conclusion
The QM Pattern is a price action-based tool in the RTM style used for identifying trend reversals. It provides traders with opportunities to enter trades with favorable risk-to-reward ratios.
The pattern is rooted in market price behavior, making it applicable across all timeframes and markets.


