By using the concepts of retracement and pullback in ICT style and Smart Money styles, long-term market trend changes and temporary movements that create suitable entry or exit opportunities can be identified.
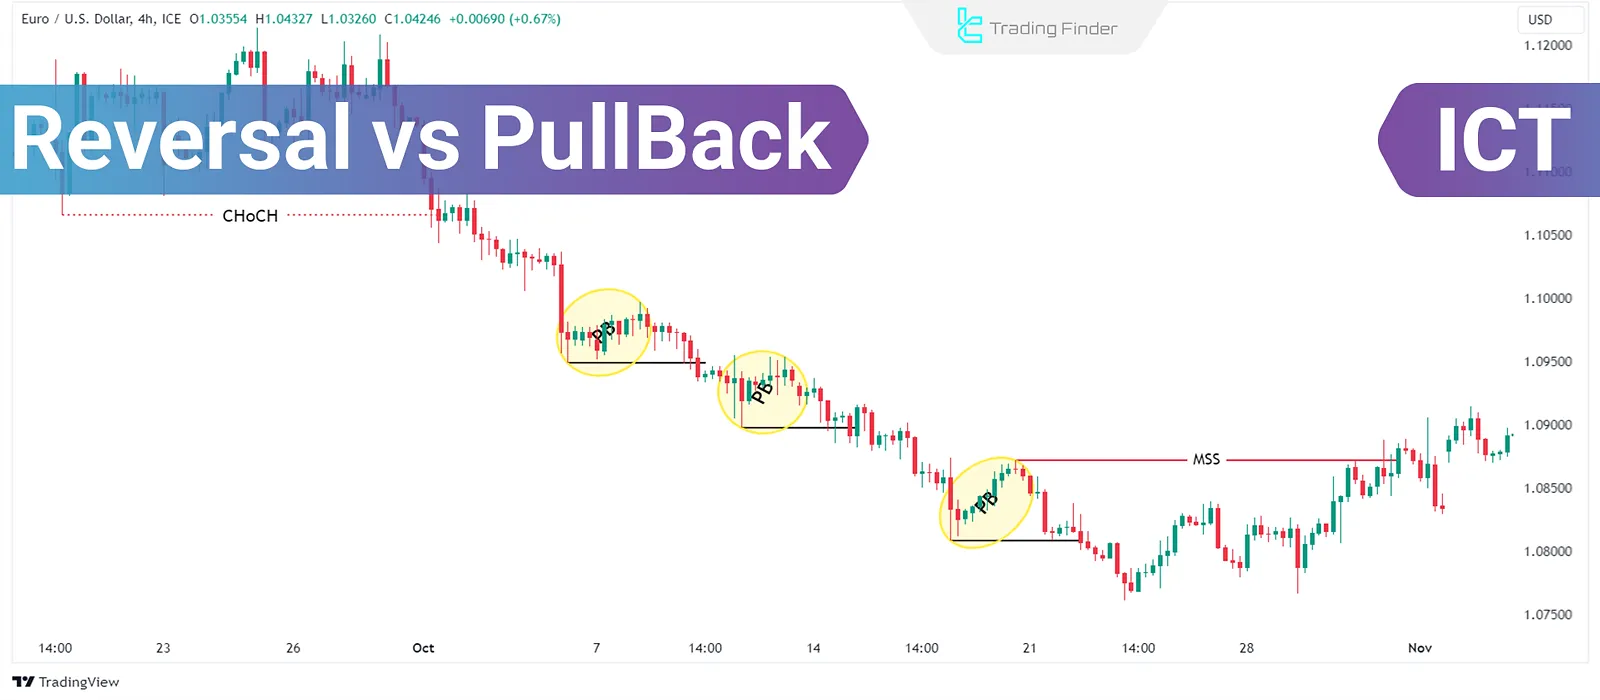
Understanding Market Structure
Market structure refers to how price movements are organized over time. By analyzing market structure, analysts can effectively identify trends, reversals, and pullbacks.
Price action analysis and understanding their psychology are the key to distinguishing between reversals and pullbacks.
What Is a Pullback?
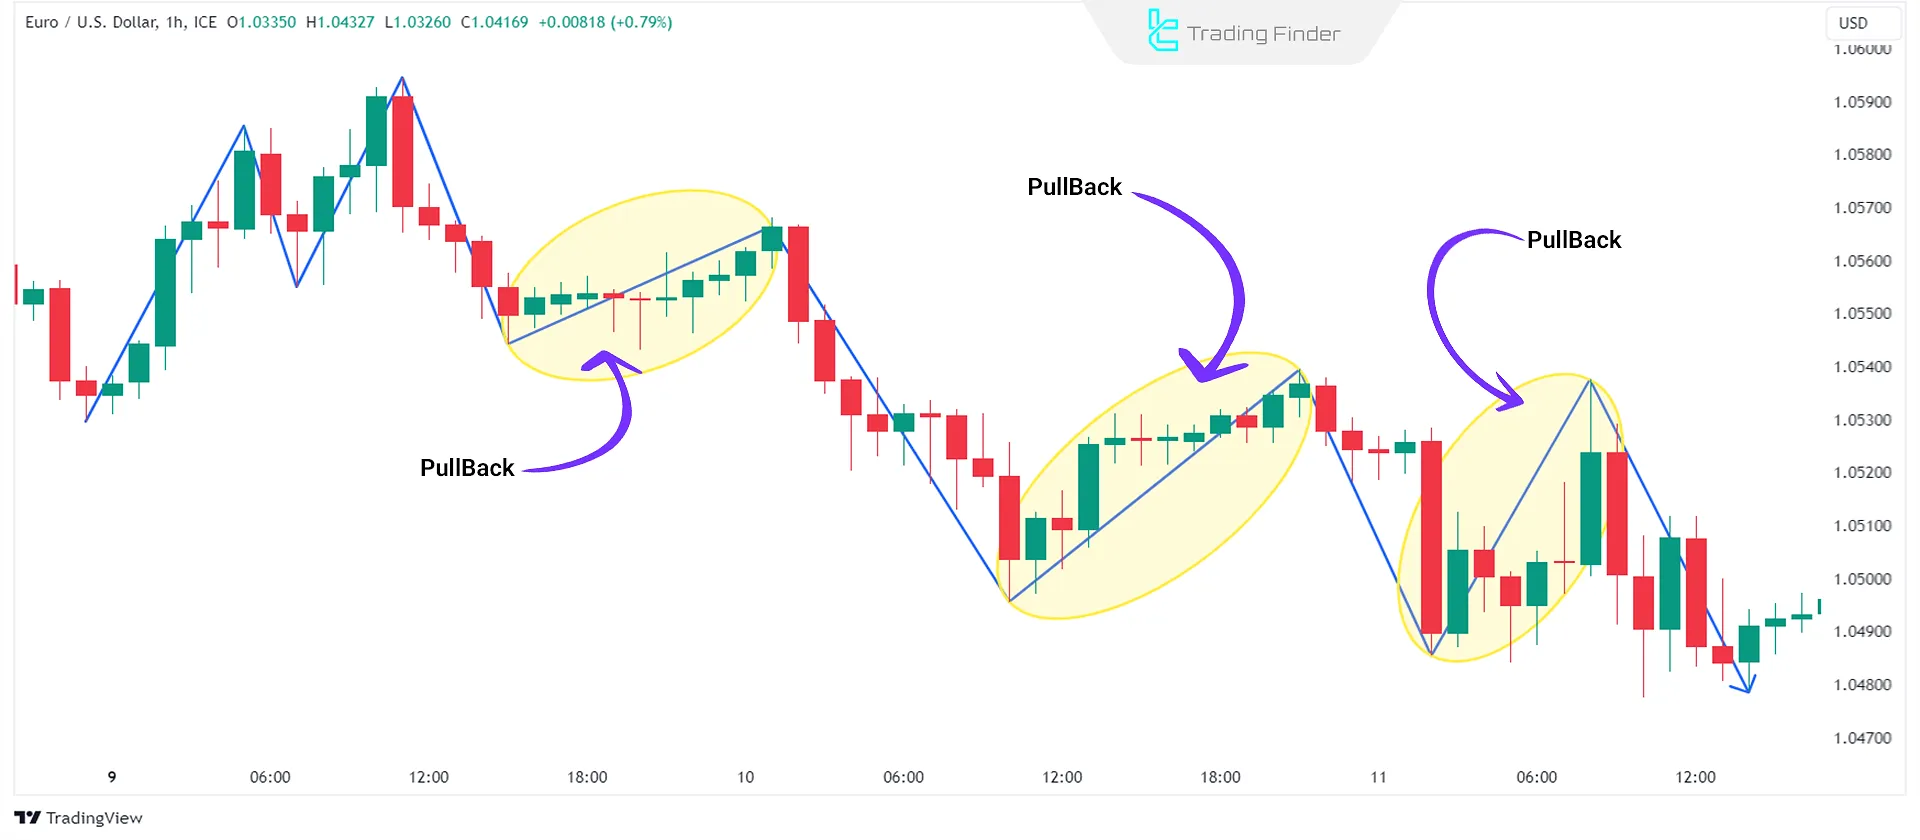
A Pullback is a temporary price movement against the prevailing trend. For example, in an uptrend, the price may reach a temporary high, decline slightly, and then resume upward.
Pullbacks are typically accompanied by lower trading volume and do not break key support levels, differentiating them from reversals.
For instance, a pullback occurs in an uptrend when prices decline before continuing higher. Comparing reversals and pullbacks shows that pullbacks are often seen as opportunities to enter trades at better prices, allowing traders to benefit from the overall trend.
What Is a Reversal?
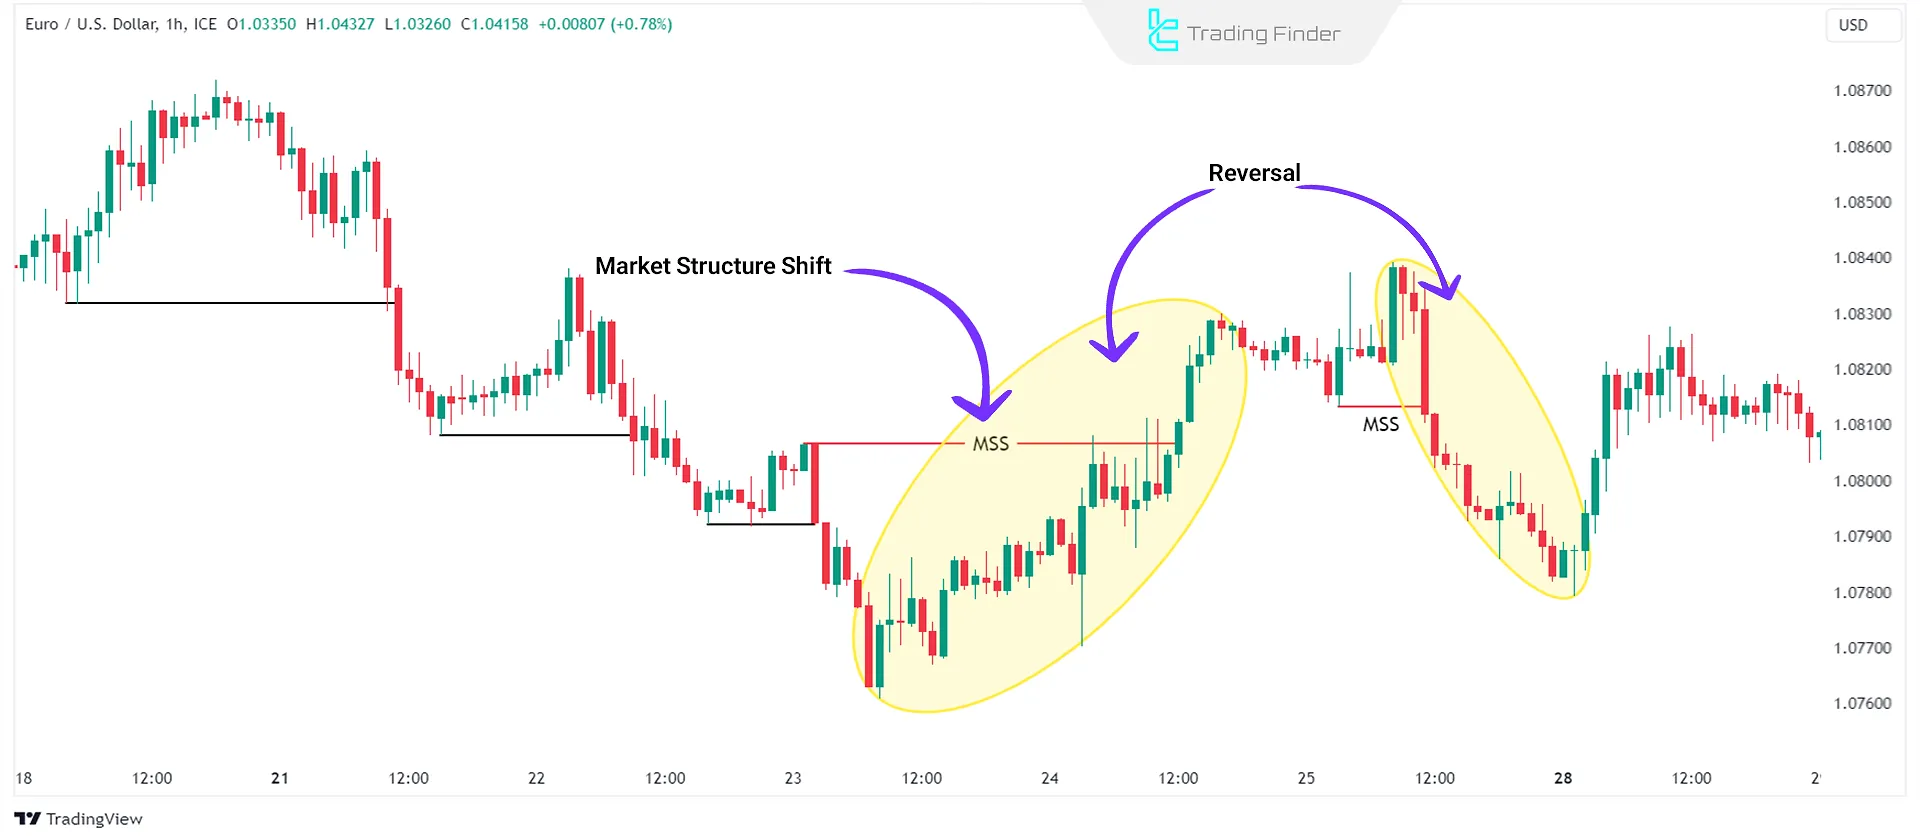
In contrast, a Reversal represents a significant shift in market direction. A reversal occurs when an uptrend transitions into a downtrend or vice versa.
Identifying the difference between a pullback and a reversal is critical for traders, as reversals often indicate a shift in market sentiment and the emergence of new trading opportunities.
Differences Between a Reversal vs Pullback
To distinguish between reversals and pullbacks using market structure and short-term highs and lows, consider the following:
- Using Trendlines: Draw trendlines connecting short-term highs and lows to visualize the Advnaced market structure;
- Watching for Breakouts: Monitor breakouts above recent highs or below recent lows. A breakout could indicate a potential reversal, whereas failure to break key levels suggests a continuation of the trend (pullback);
- Volume Analysis: A surge in trading volume during a breakout can confirm the strength of a move. Conversely, low volume may indicate a weak pullback.
Identifying Short-Term Highs and Lows
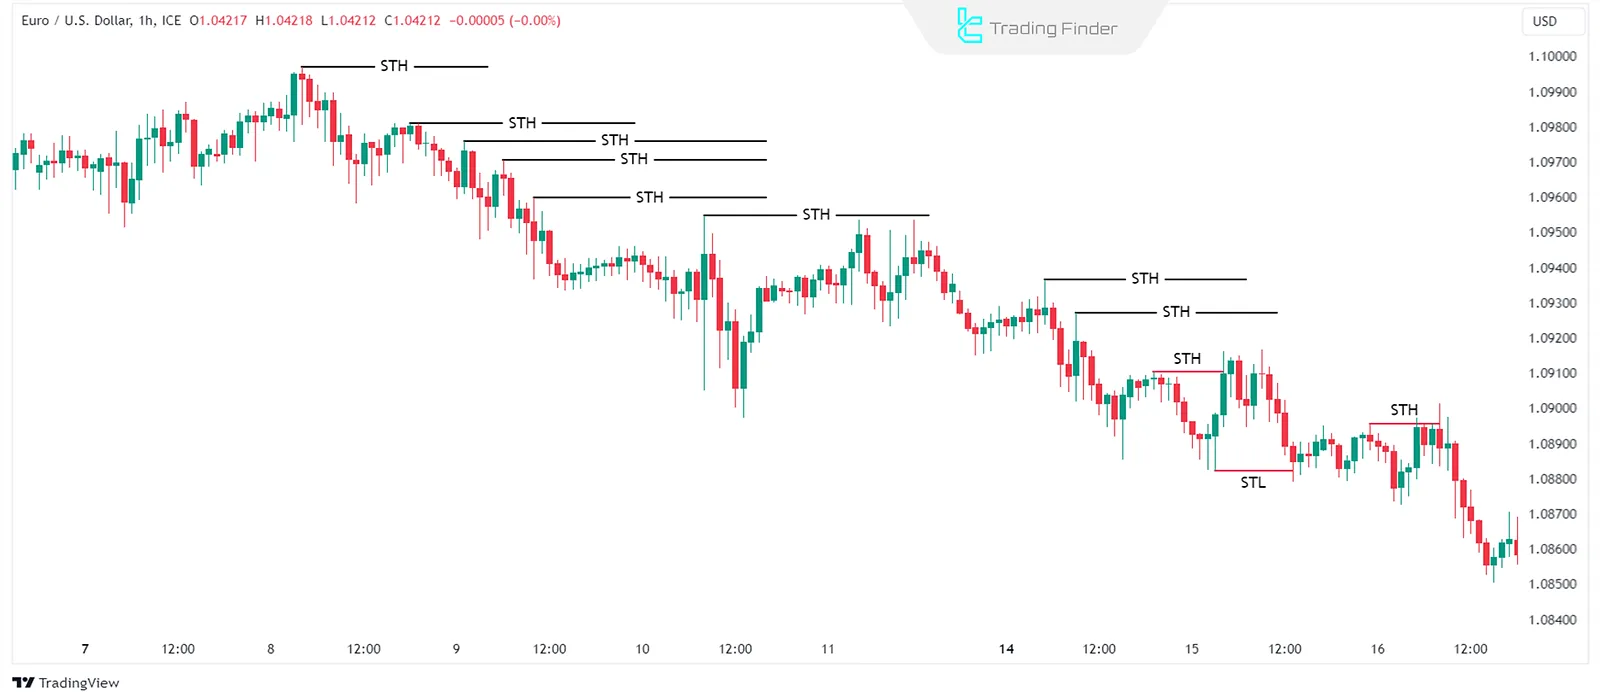
One effective technique for distinguishing reversals from pullbacks is to mark short-term highs and lows (STH/STL).
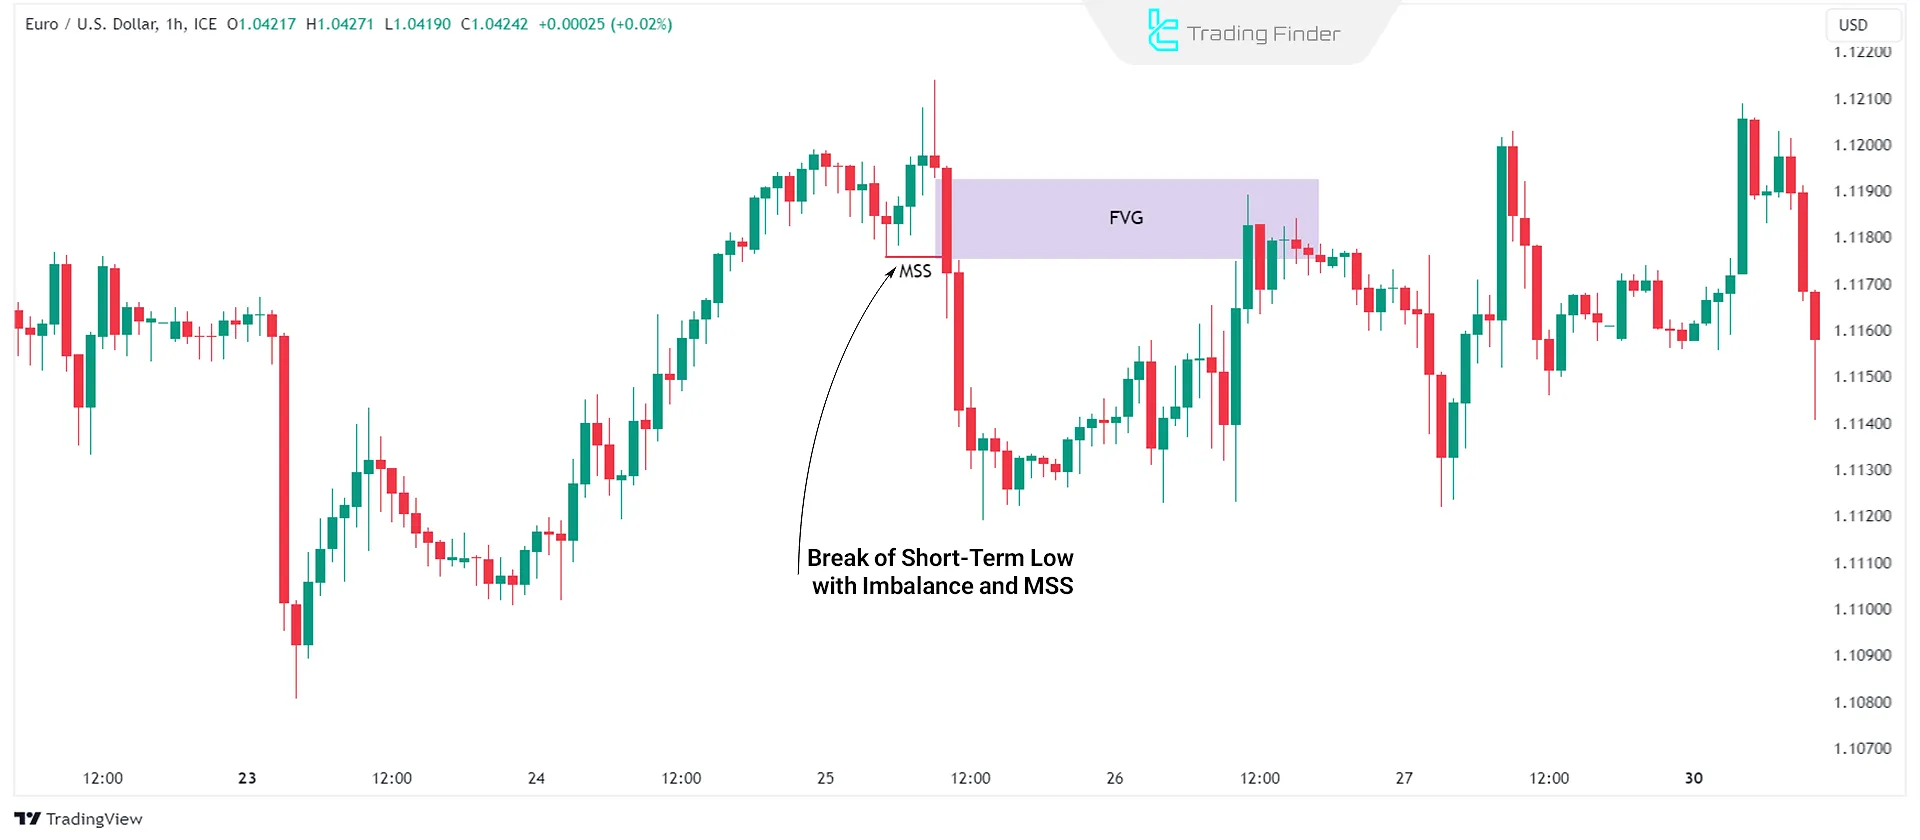
In an uptrend, a reversal occurs when the price breaks below a short-term low (MSS).
If the short-term low remains intact, the price correction is classified as a pullback, indicating trend continuation.
In a downtrend, the opposite applies—a reversal happens when a short-term high is broken.
Recognizing Market Imbalances
Market Imbalances like Fair Value Gaps occur when structural changes in the market coincide with supply and demand imbalances.
These imbalances often signal the beginning of trend reversals.
For example, if a Market Structure Shift (MSS) occurs alongside strong buying or selling pressure (Imbalance), the likelihood of a trend reversal increases.
Understanding and analyzing these imbalances helps traders identify key market turning points and distinguish between a pullback and a reversal.
Sharp price changes, increased trading volume, and unbalanced market zones often characterize such conditions.
Significance of Higher Timeframes in Identifying Pullbacks and Reversals
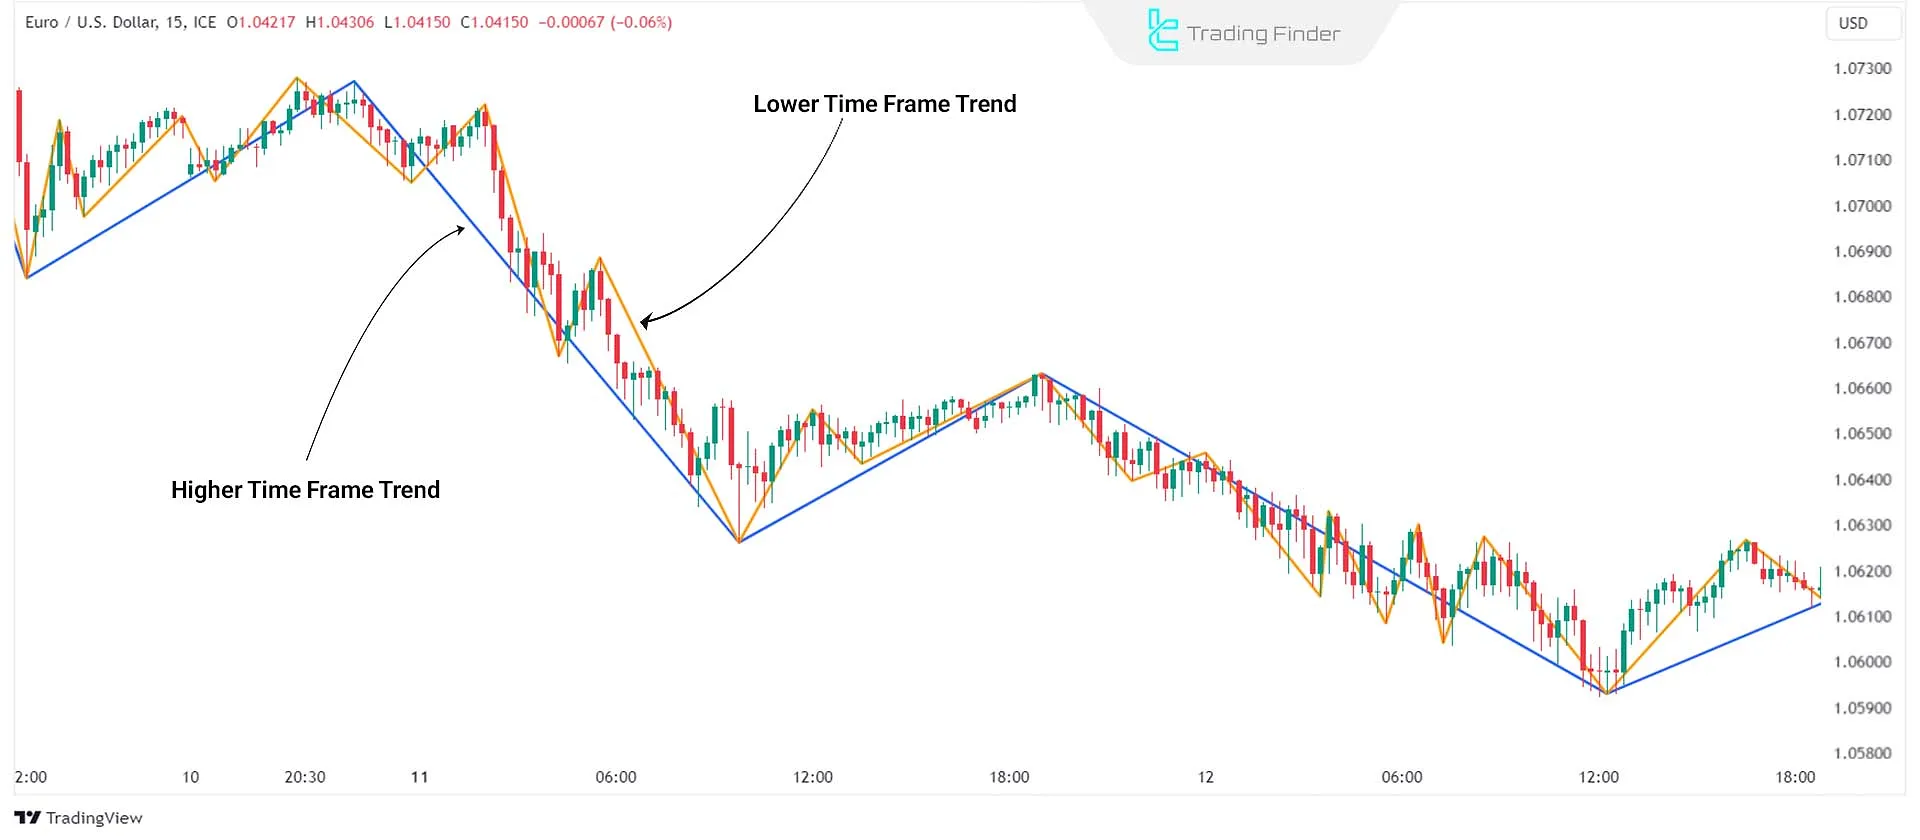
When analyzing market structure, higher timeframes provide a more transparent and less noisy view of market trends. They also make it easier to identify pullbacks and reversals accurately.
For instance, in an uptrend on the daily chart, the 4-hour chart might display pullbacks that provide ideal entry points in the direction of the main trend. Such analysis helps traders avoid entering trades against the dominant trend.
Higher timeframes help smooth out price fluctuations, allowing traders to focus on the overall trend rather than short-term market noise.
How to Use Higher Timeframes Effectively
Aligning higher timeframes with lower timeframes and understanding the overall market trend is essential to maximizing their benefits.
- Identify the Main Trend: Use higher timeframes to identify the trend and distinguish pullbacks from reversals;
- Mark Key Levels: Identify support and resistance levels on higher timeframes, as they act as potential entry or exit points;
- Look for Confluence: Analyze multiple timeframes for confluence. A 15-minute pullback in a bullish daily trend may signal a strong buy opportunity.
Conclusion
Understanding the difference between a reversal and a pullback is crucial for Forex and crypto traders.
Traders can refine their trading strategies and make more informed decisions by utilizing market structure analysis, higher timeframes, short-term high and low identification, and imbalance detection.


