


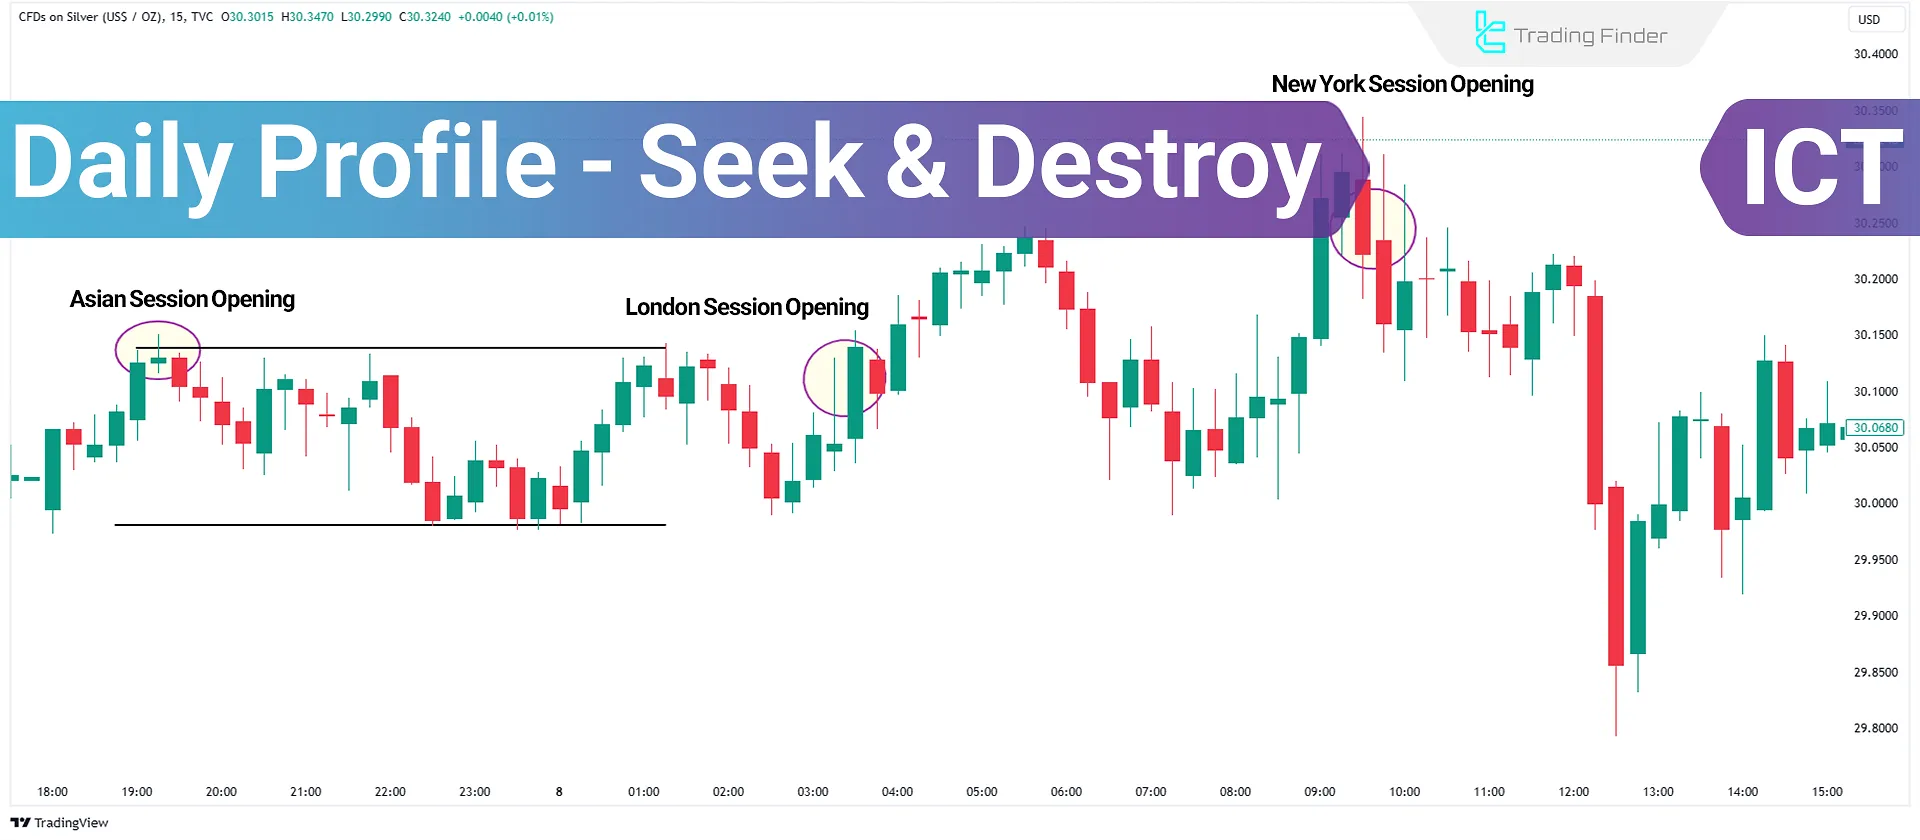
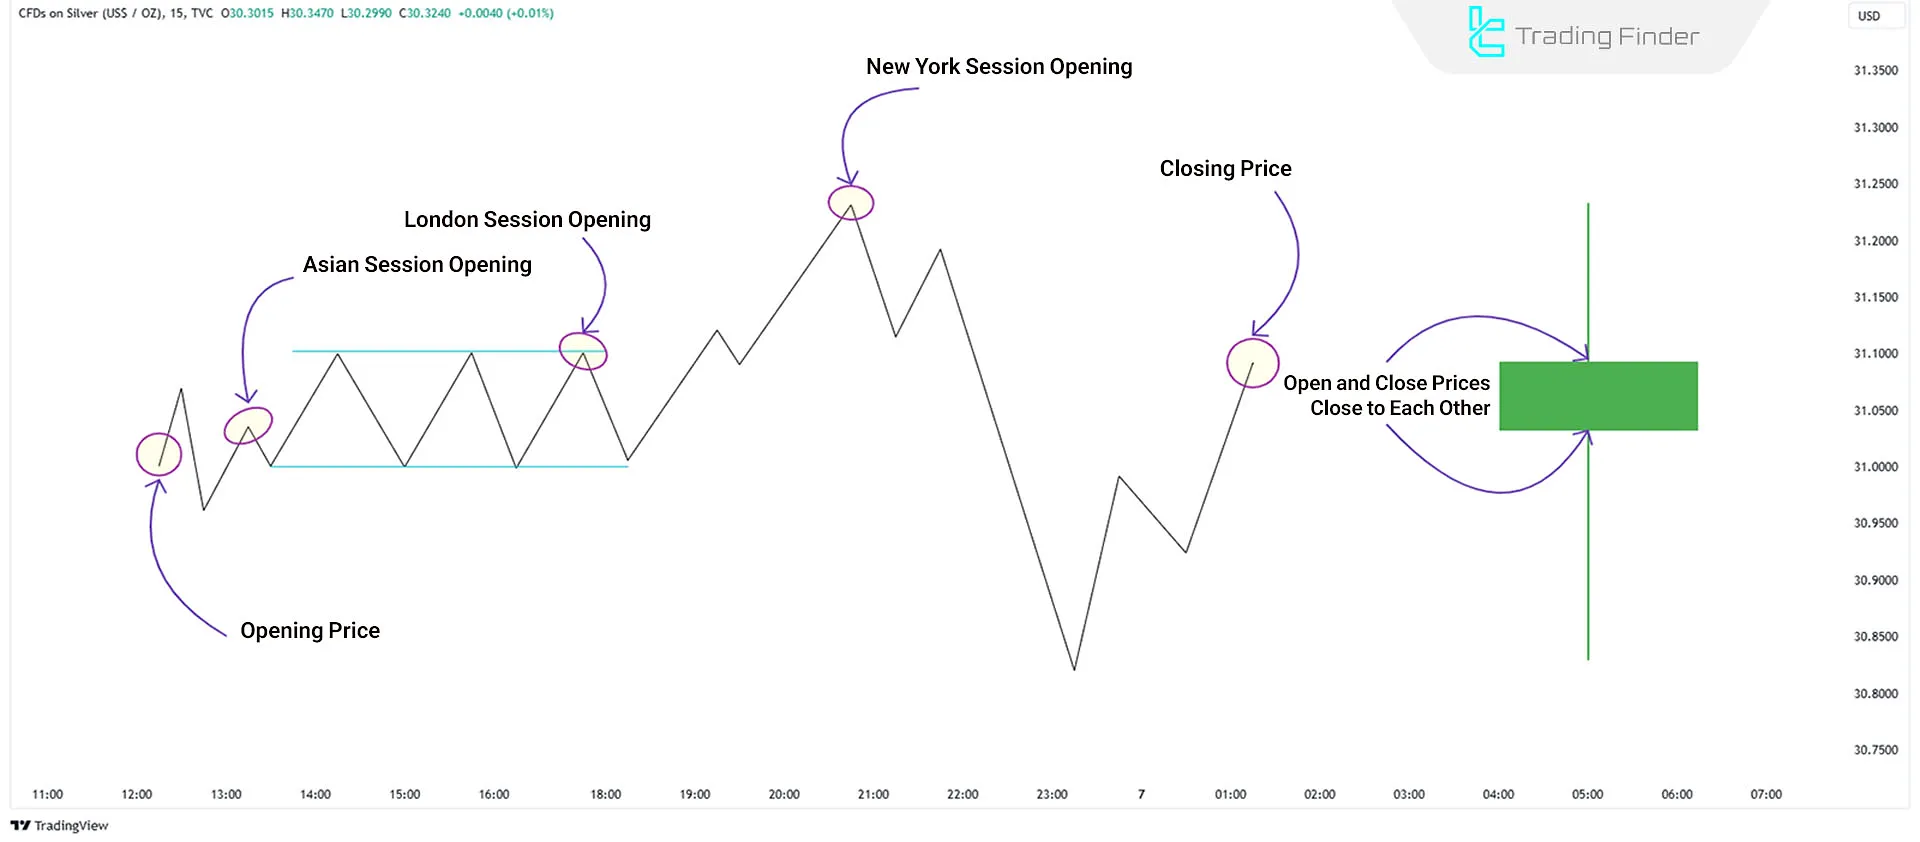
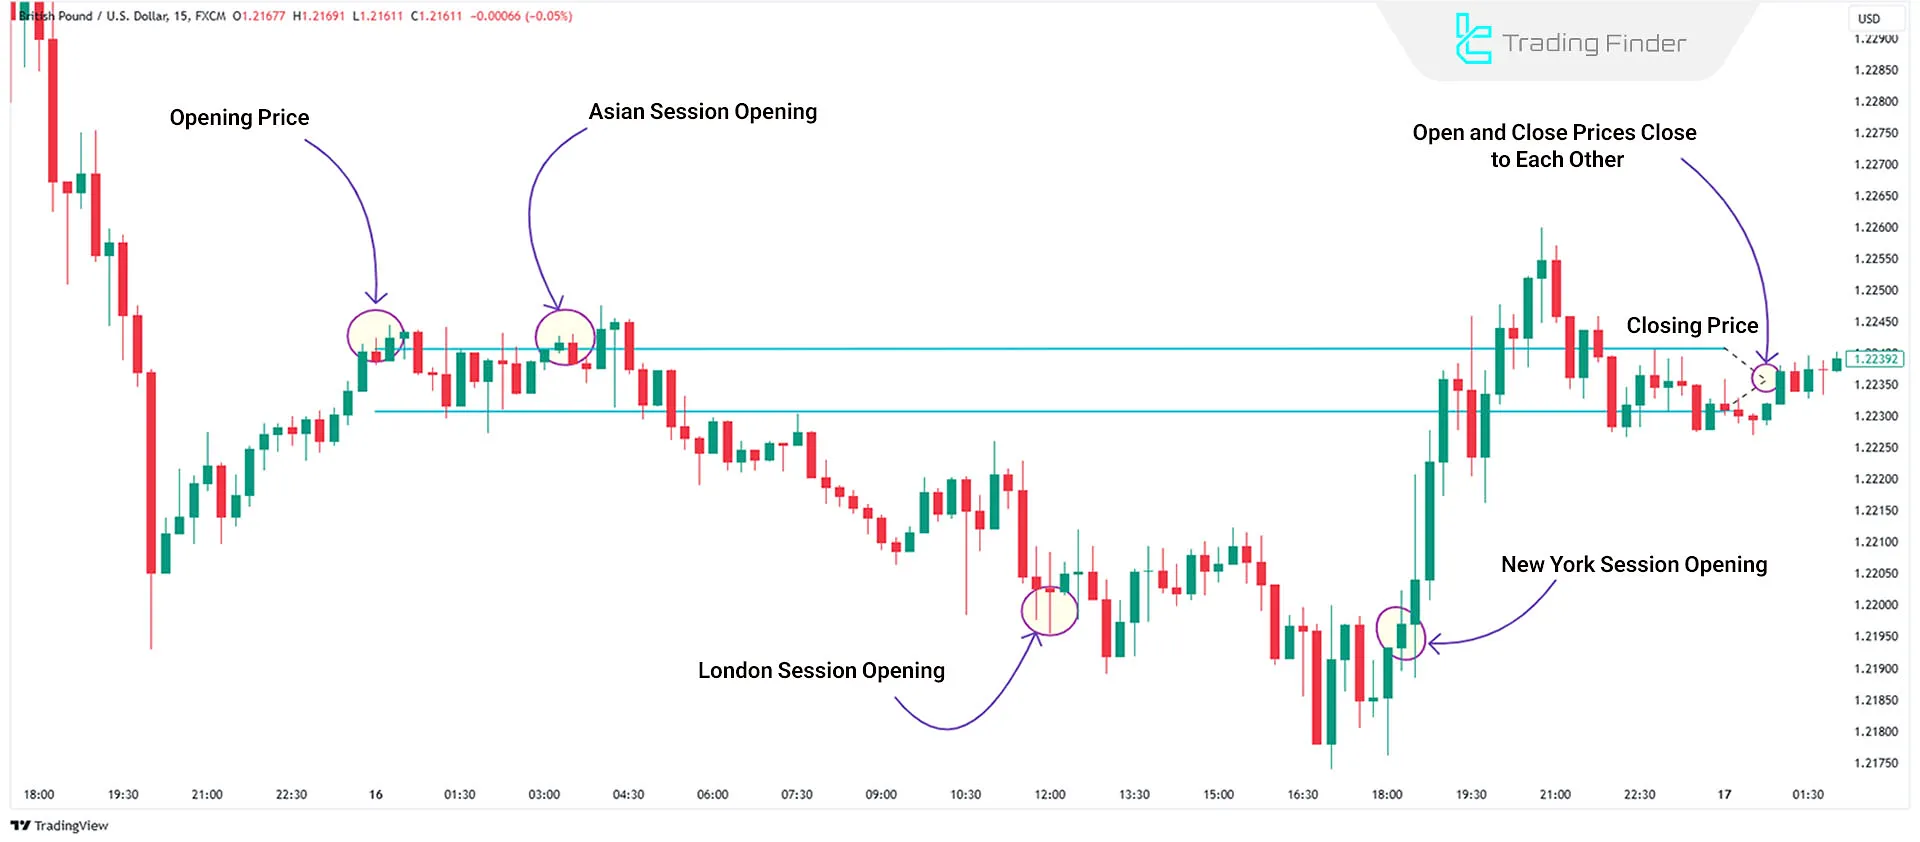
The Seek & Destroy (S&D) profile is a common daily market behavior in the ICT trading strategy, often observed on days with unclear price movements and market consolidation.
This profile in ICT Style helps traders identify periods of market uncertainty and avoid unnecessary trades. It is also referred to as S&D and is used to analyze market conditions and price action patterns.
What is the Seek & Destroy (S&D) Profile?
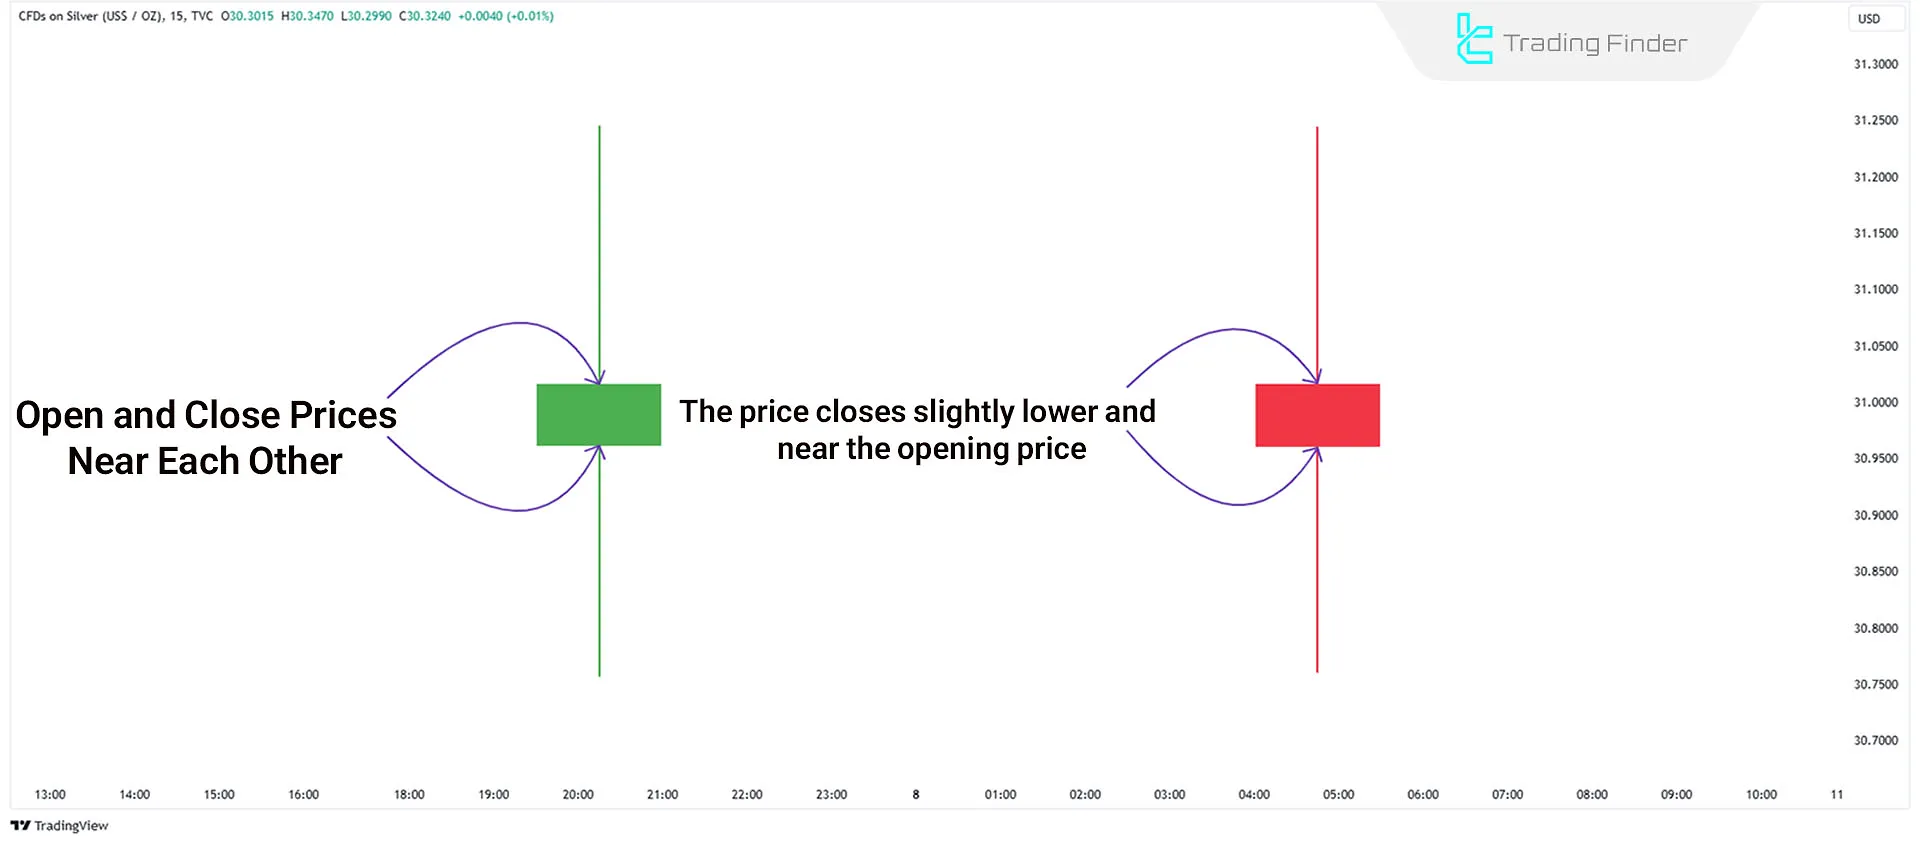
The S&D profile appears on daily charts as an Indecision Candle, indicating that price action lacks clear direction throughout the day.
In such cases, the opening and closing prices are relatively close, signaling market indecision.
Key Features of the S&D Profile on Lower Timeframes:
- At the beginning of the day, the market has no clear direction or daily bias.
- The London session moves price in one direction, but the move is reversed later
- Even when pricebreaks out, it tends to return to the previous range
Why and When Does the Seek & Destroy (S&D) Profile Occur?
The S&D profile commonly appears under these conditions:
- Waiting for Major Economic News: The market may remain uncertain before critical news releases such as CPI, FOMC decisions, or NFP reports;
- Lack of Higher Timeframe Direction: Daily or higher timeframe charts may lack clear trends, leading to random price movements on lower timeframes.
How to Identify the S&D Profile?
To detect this profile, analyze key trading sessions Kill Zones:
- Asia Session: Usually sets the initial price range for the day;
- London Session: In S&D profiles, price sweeps both sides of the Asian range but fails to establish a trend;
- New York Session: Price continues to range and returns to the initial consolidation zone.
How to Trade the Seek & Destroy (S&D) Profile?
Follow these steps to trade the S&D price action in daily profiles:
- Focus on Reversion to the Range: Instead of trading breakout movements, identify trade setups where price returns inside the initial range;
- Identify Premium & Discount Levels: Use the London session range to mark equilibrium zones. Look for entries when price returns inside these zones;
- Use Daily Range for Confirmation: Identify the opening and closing prices for the daily range. If price breaks out, expect a reversion to the mean.
Risks of Trading the Seek & Destroy (S&D) Profile
The Risks of This Trading Style Include the Following:
- This profile often leads to choppy, aimless price action, increasing the risk of failed trades.
- The market tends to range, reducing the probability of profitable setups.
- If the London session forms a key range, the probability of a strong New York move decreases.
Conclusion
The Seek & Destroy (S&D) Profile is a complex market behavior in ICT trading that represents uncertainty and price indecision.
Due to lack of trend direction, traders are advised to avoid high-risk trades, as random price movements can trigger stop losses and lead to unnecessary losses.


