


Sell-Side Imbalance and Buy-Side Inefficiency (SIBI) and Buy-Side Imbalance andSell-Side Inefficiency (BISI) in the ICT trading style are used to identify key market points and predict price movements.
These concepts are essentially Fair Value Gaps (FVG), forming strong bullish or bearish trends. Additionally, the first and third candlesticks align with the candle that contains the Fair Value Gap.
In ICT, the SIBI and BISI zones are often considered as the consequence of real Displacement, and their validity increases when they overlap with aligned PD Arrays of higher timeframes.
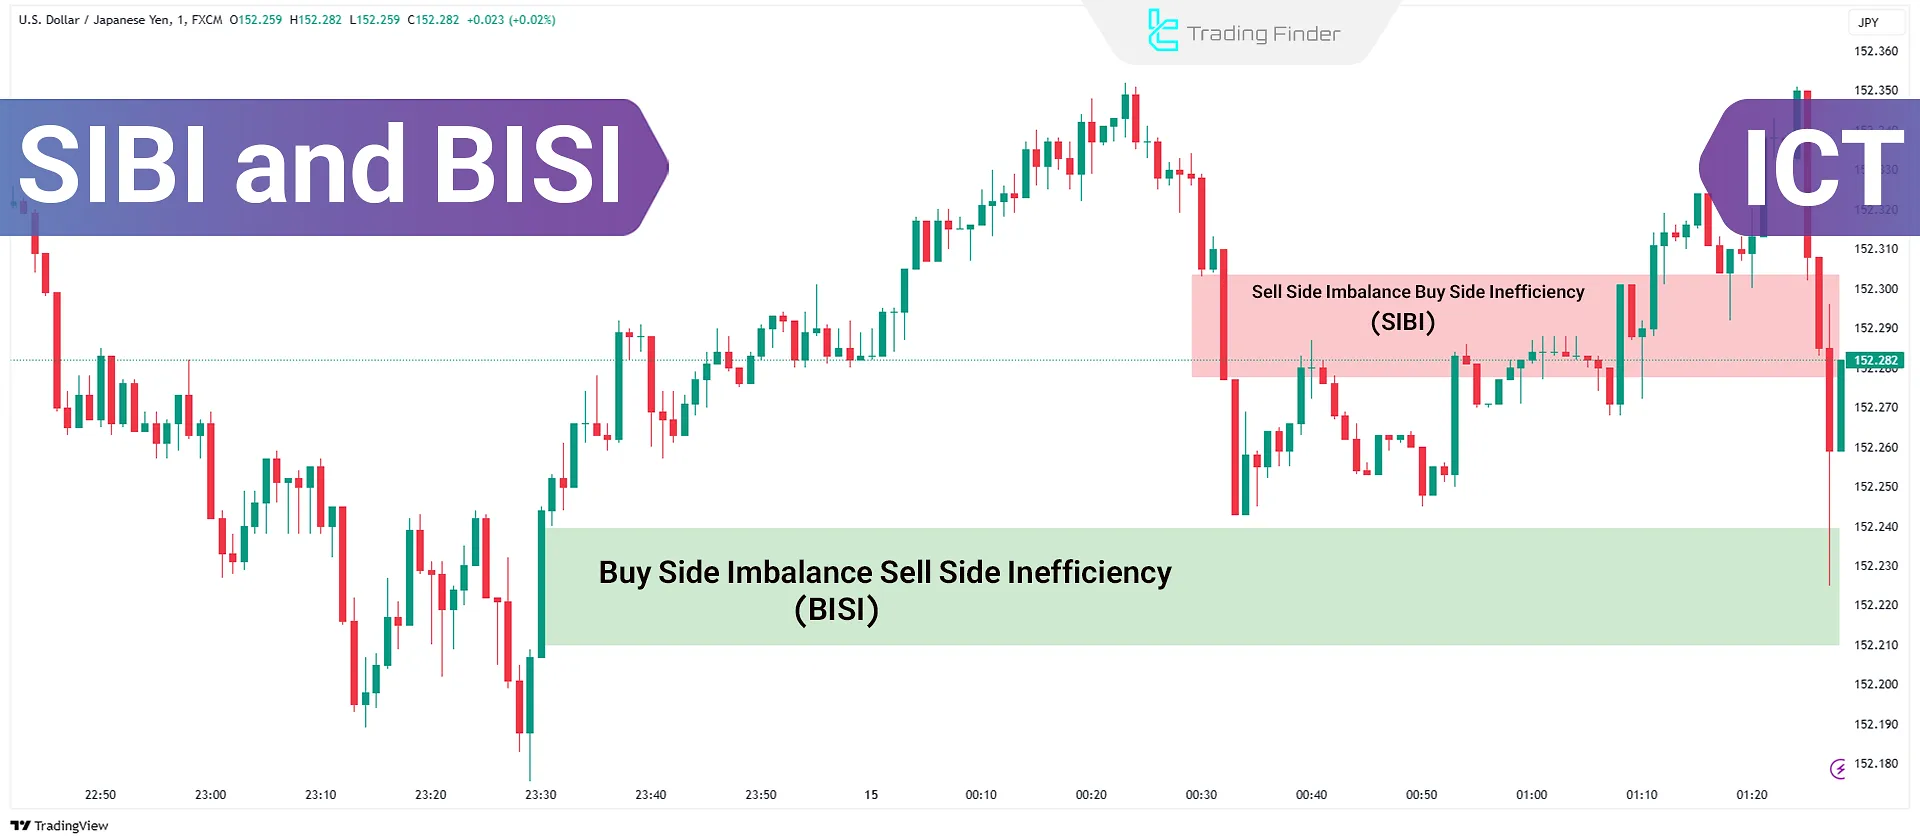
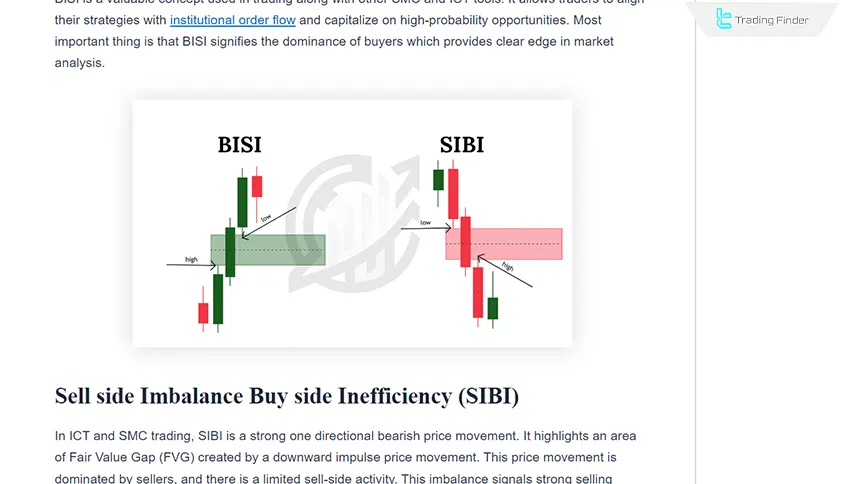
What are Buy-Side Imbalance and Sell-Side Inefficiency (BISI)?
Buy-Side Imbalance and Sell-Side Inefficiency (BISI) refers to a bullish gap that signifies strong buying pressure in the market. This pattern typically forms in strong bullish trends and indicates that buyers have control over the price movement.
Under such conditions, sellers are unable to cover orders, and the market moves toward higher levels with greater momentum.
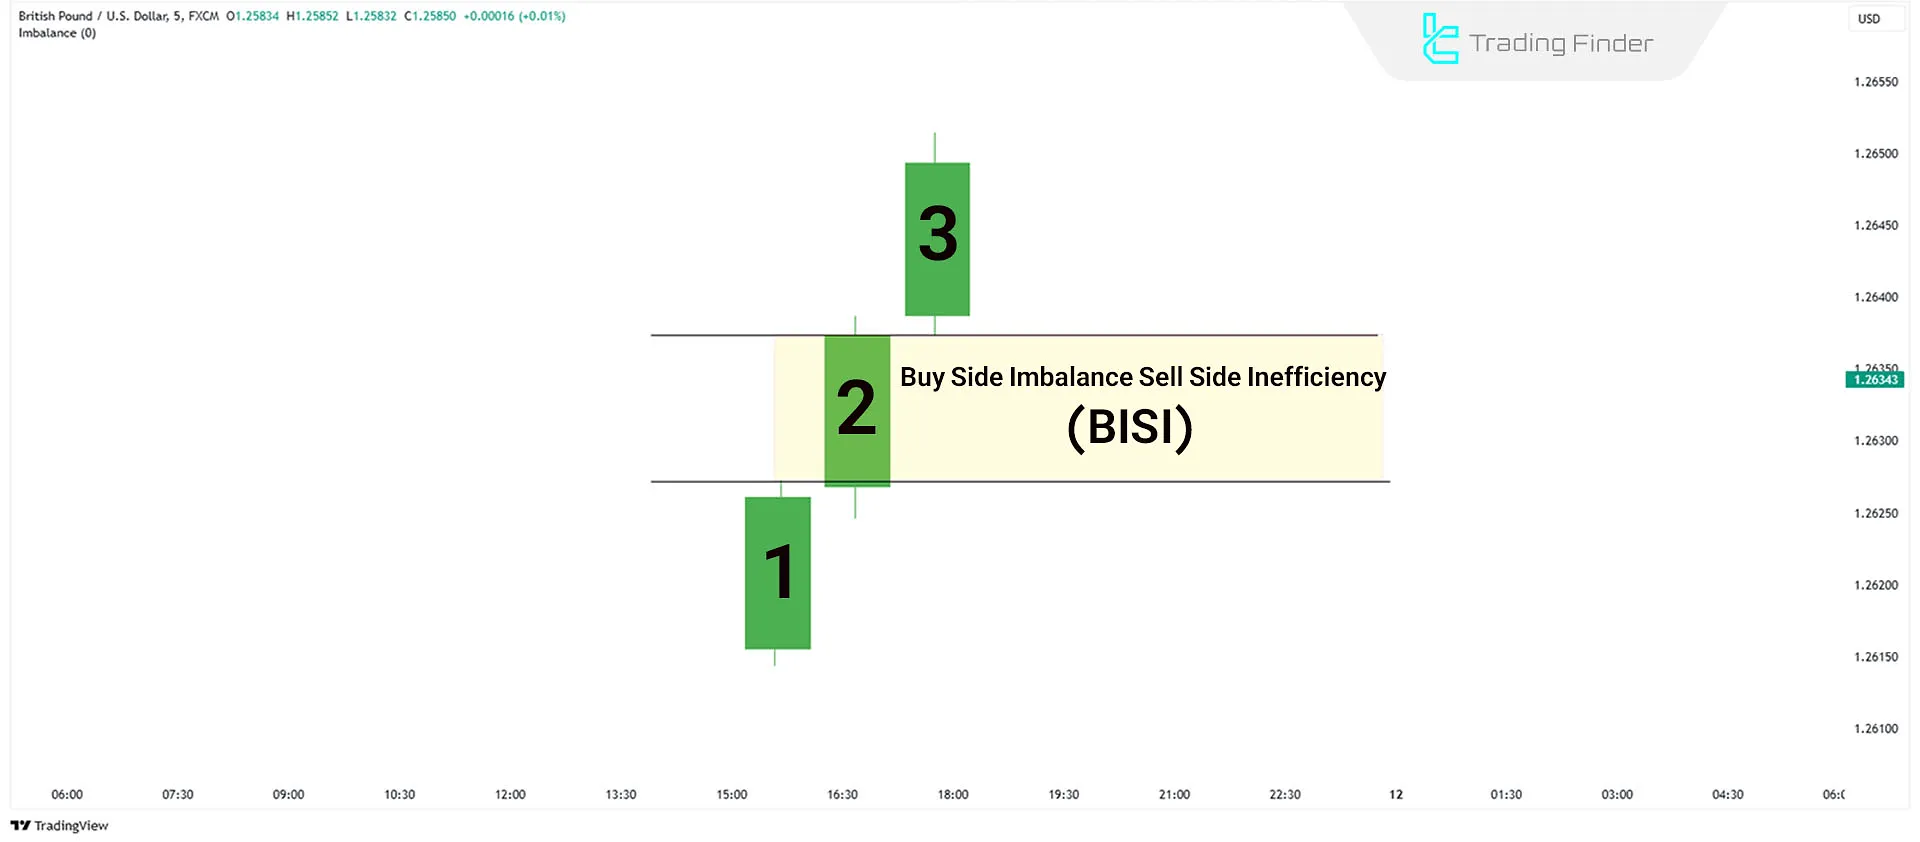
BISI Structure Analysis
The gap is created between the high of the first candle and the low of the third candle. This structure is a sign of strong buying and a gradual decrease in sellers' power, and it typically acts as a potential support zone in the continuation of an uptrend.
The BISI pattern consists of three candles:
- The first candle has a large bullish body, indicating the start of strong buying pressure;
- The second candle continues the upward movement with a large body;
- The third candle extends the upward movement, creating a gap.
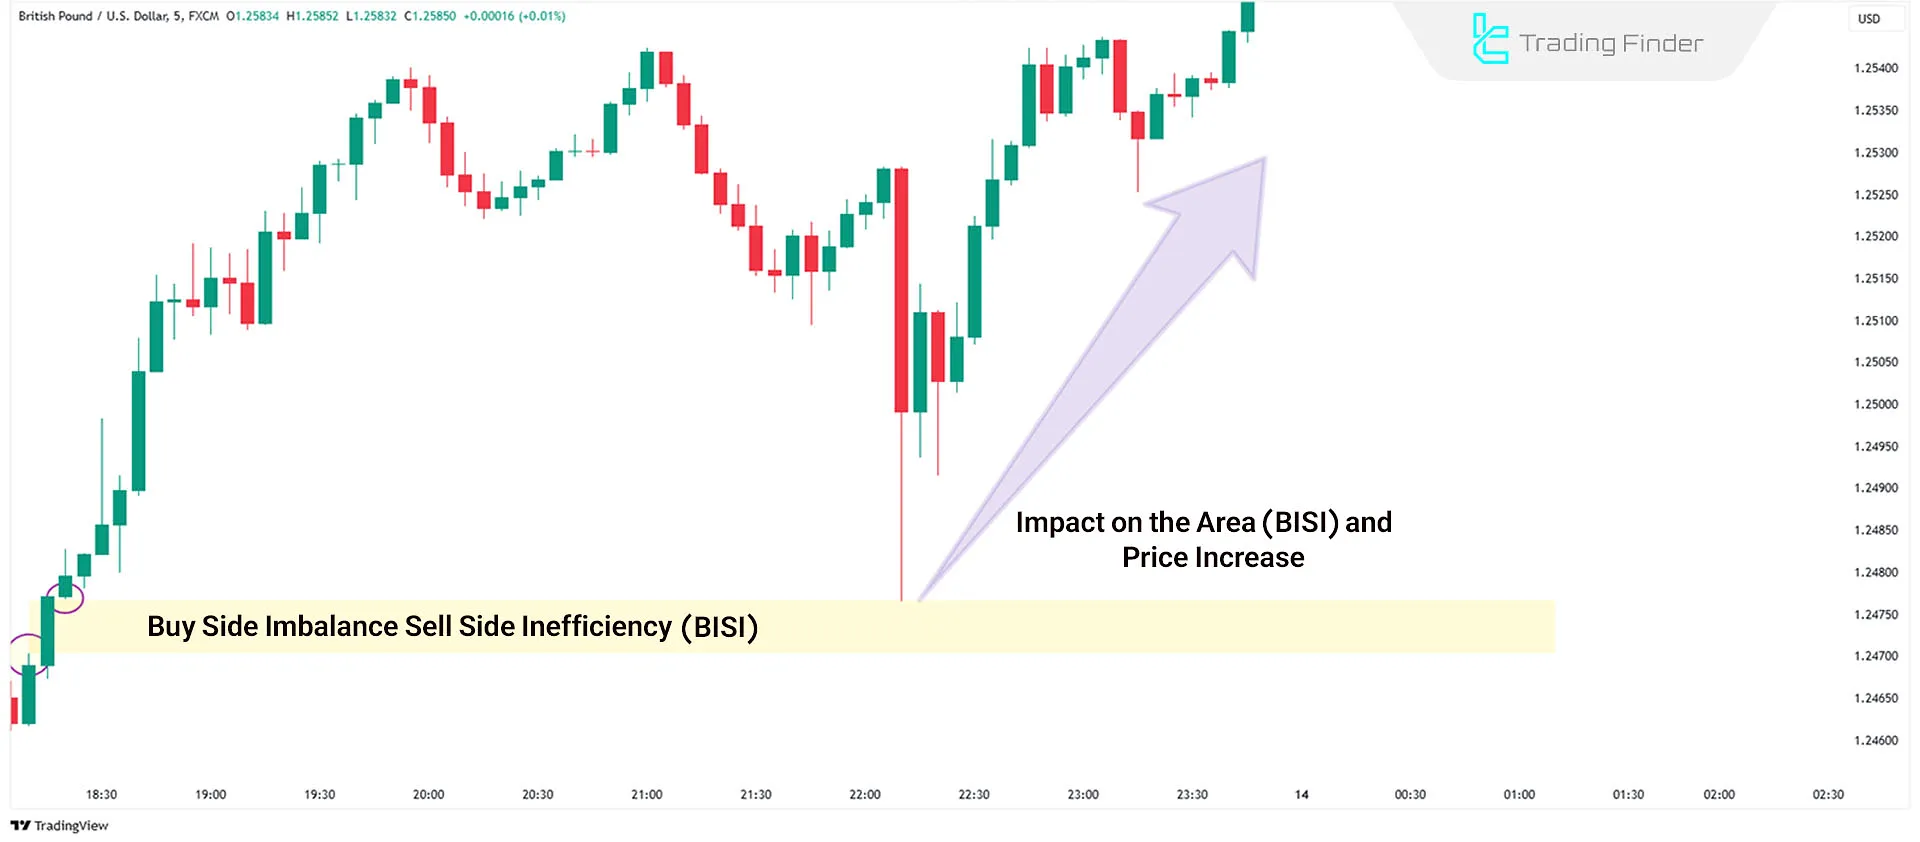
Example of Trading with Buy Side Imbalance and Sell Side Inefficiency
Trading with BISI starts with identifying the pattern. The first candle must be large and bullish, the second candle should continue the upward movement, and the third must create a gap. After spotting the gap, traders can confirm the buying pressure and enter a long position.
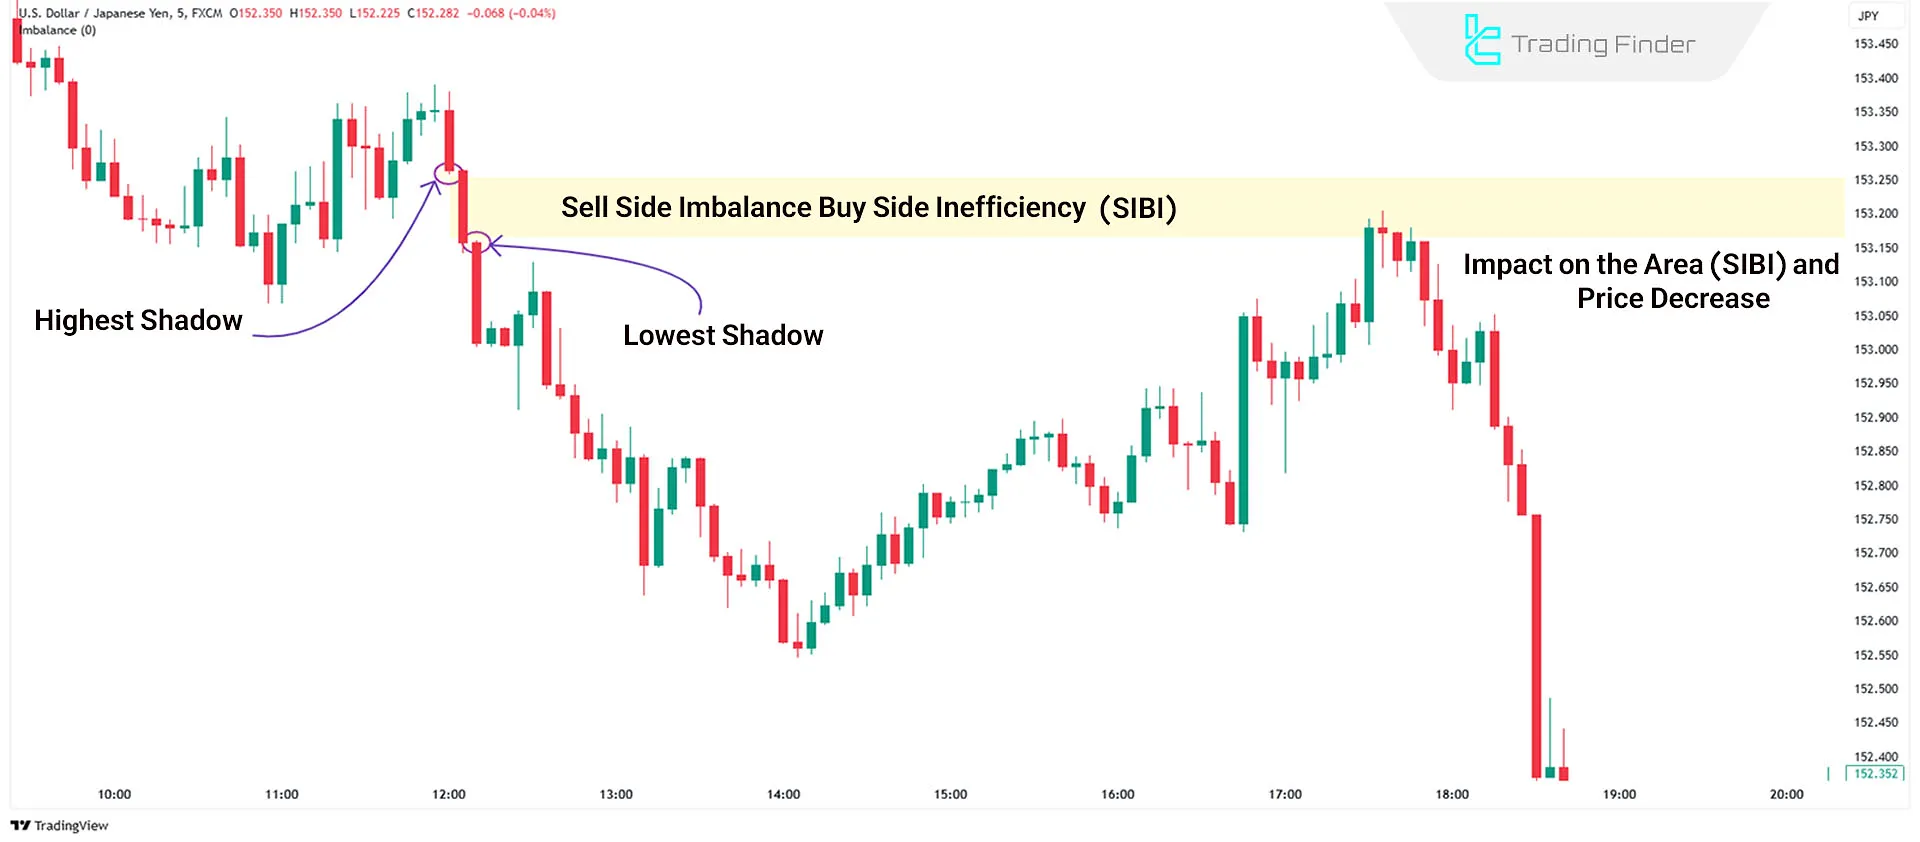
What is Sell-Side Imbalance and Buy-Side Inefficiency (SIBI)?
Sell-Side Imbalance and Buy-Side Inefficiency (SIBI) is a bearish gap that signifies strong selling pressure. This pattern typically forms in strong bearish trends and indicates the dominance of sellers in the market.
Under such conditions, buyers are unable to absorb selling orders, and the price moves toward lower levels at a faster pace.
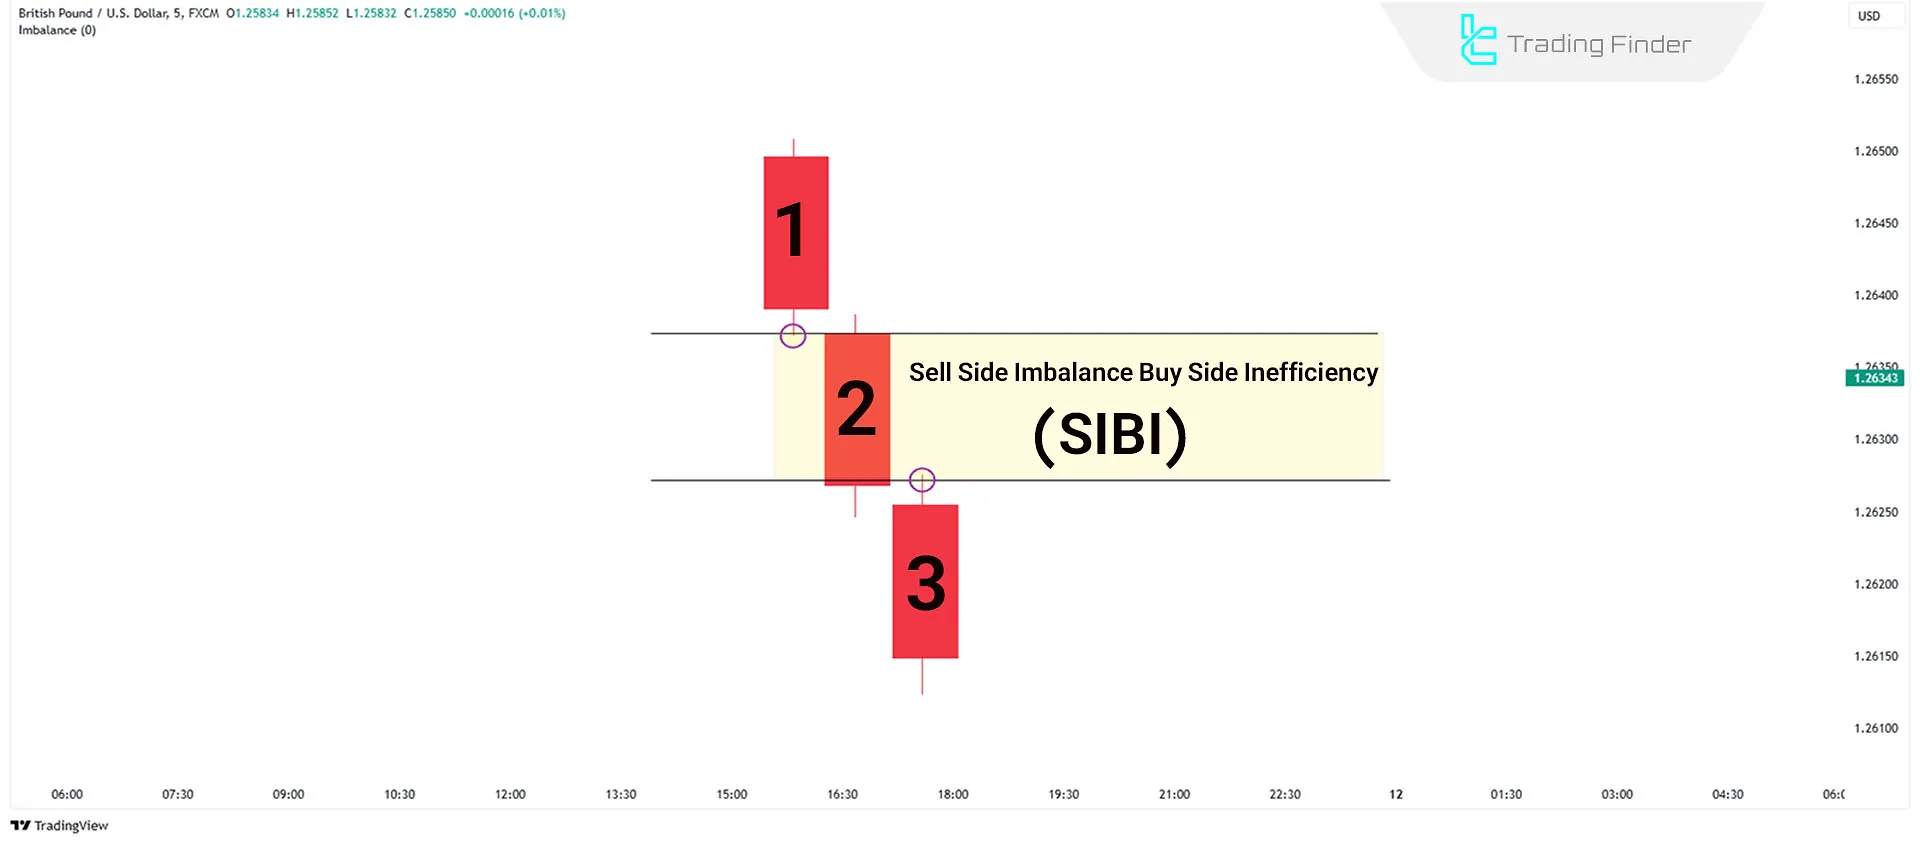
SIBI Structure Analysis
The gap is created between the low of the first candle and the high of the third candle. This structure is a sign of strong selling and a gradual decrease in buyers' power, and it typically acts as a significant resistance zone in the continuation of a downtrend.
The SIBI pattern consists of three candles:
- The first candle has a large bearish body, indicating the start of strong selling pressure;
- The second candle continues the downward movement with a large body;
- The third candle extends the downward movement, creating a gap.
Example of trading with sell-side imbalance and buy-side inefficiency
To trade with SIBI, the pattern must first be identified. The first candle should have a large bearish body, the second candle should confirm the bearish trend, and the third candle must create a gap, reflecting the continuation of the downward movement.
Once this gap is confirmed, traders can enter a short position, placing their stop-loss above the high of the third candle to manage risk.
What is the Difference Between SIBI and BISI?
Understanding the difference between buy-side and sell-side imbalances plays a crucial role in accurately analyzing market structure. Learning how to use SIBI and BISI from the writofinance website:
This comparison shows under which conditions each concept holds greater validity and how they influence price behavior. Comparison table for buy-side and sell-side imbalance and inefficiency (BISI & SIBI):
Parameters | Buy-Side Imbalance & Sell-Side Inefficiency (BISI) | Sell-Side Imbalance & Buy-Side Inefficiency (SIBI) |
Momentum | Dominant buying pressure | Dominant selling pressure |
Function | Acts as support | Acts as resistance |
Mode of Operation | Acts as support | Acts as resistance |
Type of Gap | Bullish Imbalance gap | Bearish Imbalance gap |
Price Behavior After Formation | Tendency for price to return and continue upward movement | Tendency for price to correct and continue downward movement |
Suitable Entry Position | Entering buy trades on pullbacks | Entering sell trades on rallies |
Suitable Stop-Loss Placement | Below the low of the imbalance zone | Above the high of the imbalance zone |
Alignment with Liquidity | Absorption of sell-side liquidity | Absorption of buy-side liquidity |
Pattern Reliability Strength | High when accompanied by structural breakout | High when accompanied by structural breakout |
Key Considerations for Using SIBI & BISI
Using SIBI and BISI concepts without considering the overall market conditions can reduce the accuracy of the analysis.
These zones are most valid when used alongside complementary tools and with proper risk management. An educational video on SIBI and BISI from the YouTube channel Arjo:
Key important points for using SIBI and BISI include the following:
- Combine SIBI and BISI with other technical tools like Order Blocks to improve accuracy;
- Use stop-loss and take-profit levels for risk management;
- Always wait for confirmation, such as market structure shifts or strong price action signals.
What is the Difference Between SIBI/BISI and Fair Value Gaps (FVG)?
The main differences between SIBI/BISI and Fair Value Gaps (FVG) are structure and trend strength. SIBI and BISI occur in strong trends, while FVG represents a temporary imbalance caused by supply and demand differences.
In SIBI and BISI, both the first and third candles align with the trend, whereas in FVG, this alignment is not always present.
SIBI and BISI comparison table with fair value gap (FVG):
Comparison Parameter | FVG (Fair Value Gap) | BISI / SIBI |
Concept Type | General price imbalance | Directional and powerful imbalance |
Candle Structure | Typically three candles, no requirement for same color | Three candles aligned with the trend |
Trend Strength | Forms in weak or neutral trends | Only in strong bullish or bearish trends |
Directionality | Neutral or two-sided | Purely bullish (BISI) or bearish (SIBI) |
Zone Validity | Medium and dependent on market conditions | Higher due to clear buyer or seller pressure |
Price Reaction | Probability of the gap being filled | Acts as valid support or resistance |
Trading Application | Identifying price correction areas | More precise entry, stop-loss and price target setting |
Need for Additional Confirmation | High | Still necessary, but signal is stronger |
Price Reaction to Imbalance Zones in SIBI and BISI
After the formation of price imbalance zones such as FVG, BISI, or SIBI, the market typically exhibits one of several defined behaviors.
In many instances, price tends to return to the imbalance zone and fill part of this price gap. This behavior results from the market's effort to balance supply and demand.
In some conditions, especially when trend momentum is very strong, price passes through the imbalance zone without returning to it and continues its movement in the same direction.
Also, if the price return to the imbalance is accompanied by a break in market structure, the probability of a trend reversal or the formation of a reversal scenario increases.
For this reason, imbalance zones are not only used for trade entry. These zones can be used as target price ranges, stop-loss placement areas, or key points for assessing potential market reversals.
Interaction of SIBI and BISI with Other Analytical Tools
To increase the validity of SIBI and BISI zones, the simultaneous use of complementary tools in the ICT style is of great importance.
These concepts alone are not considered entry signals; rather, they gain analytical value when analyzed within the context of market structure and liquidity.
Their correct combination with key tools reduces the probability of error and noticeably increases the quality of trades.
- Liquidity Void (LV): Liquidity Voids represent rapid price movements that form due to a lack of sufficient orders. If an SIBI or BISI is located near an LV, it indicates high market momentum, and the probability of the movement continuing in the same direction increases;
- Market Structure Shift (MSS): A shift in market structure is one of the most important confirmations for the validity of imbalances. When price returns to an SIBI or BISI zone after an MSS, this zone can be used as a low-risk entry point;
- Order Blocks (OB): Combining an Order Block with SIBI and BISI multiplies analytical power. If an imbalance zone overlaps with an order block, that area becomes a highly valid zone for price reaction and can play a stronger support or resistance role.
Overall, SIBI and BISI are most effective when examined alongside liquidity, market structure, and order blocks. This approach makes analysis more professional and trading decision-making more precise.
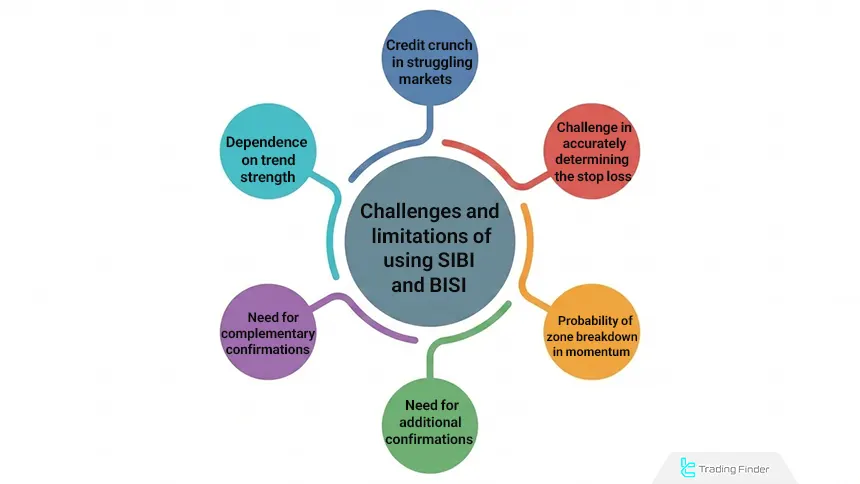
Challenges and Limitations of Using SIBI and BISI in the ICT Style
Despite the widespread use of SIBI and BISI concepts in identifying price imbalance zones, using them without understanding their limitations can lead to incorrect analysis.
These concepts are highly dependent on market conditions, trend strength, and complementary confirmations.
The most important challenges and limitations in using SIBI and BISI:
- Reduced validity in ranging and low-volatility markets
- High dependence on trend strength
- Identification errors on lower timeframes
- Need for complementary confirmations
- Probability of zone failure during strong momentum
- Challenges in precise stop-loss determination
Reduced Validity in Ranging and Low-Volatility Markets
Under conditions where the market lacks a clear trend, SIBI and BISI zones have less validity. In these phases, gaps may be filled quickly and not create reliable price reactions.
Also, in ranging markets, price movements are more back-and-forth, and imbalances typically do not last long. This increases false signals and reduces entry accuracy.
High Dependence on Trend Strength
These concepts only make sense in strong trends. In weak or corrective trends, identifying SIBI and BISI can be misleading and generate incorrect signals.
If market momentum is insufficient, the imbalance zone is easily violated, and the expected reaction does not occur. Therefore, assessing trend strength before using these concepts is essential.
Identification Errors on Lower Timeframes
On smaller timeframes, market volatility is higher, and candle structures can create false patterns. This increases the likelihood of error in identifying imbalances.
Under such conditions, any rapid movement may be misinterpreted as SIBI or BISI. Using higher timeframes for confirmation can reduce this error.
Need for Complementary Confirmations
Buy-side and sell-side imbalances and inefficiencies alone should not be the basis for trade entry. The absence of confirmations such as market structure shift or overlap with an Order Block significantly increases trade risk.
These zones primarily play the role of potential price reaction areas, not definitive entry signals. Combining them with appropriate price action increases the validity of the analysis.
Probability of Zone Failure During Strong Momentum
In very powerful movements, price may pass through the imbalance zone without a significant reaction. In such conditions, relying solely on these zones can cause late entry or stop-loss activation.
This usually occurs when significant liquidity is released in the direction of the trend. In this case, the market shows no inclination for a deep correction.
Challenges in Precise Stop Loss Determination
If the boundary of an SIBI or BISI zone is not correctly defined, the stop-loss is placed either too close or too far. This directly negatively impacts the trade's risk-to-reward ratio.
Incorrect stop-loss determination can cause premature exit from a trade or an unreasonable increase in risk. Using market structure and valid highs and lows helps improve this issue.
The Imbalance Indicator for SIBI and BISI
The Market Imbalance Detector indicator is an advanced tool for traders operating based on price action concepts, especially the ICT style.
Focusing on price imbalance zones, this indicator helps identify areas where supply and demand have acted asymmetrically, and price has moved rapidly. Such areas are typically the same key price reaction points known in SIBI and BISI concepts.
This tool can detect various types of imbalances, including Fair Value Gaps (FVG), opening gaps, and volume-related imbalances. The visual display of these zones is done with colored boxes; bullish imbalances are marked in green and bearish imbalances in red.
This color differentiation allows traders to analyze buy and sell pressure more quickly. Imbalance Indicator Tutorial Video:
Conceptually, the indicator's function is fully aligned with the logic of BISI and SIBI. In uptrends, green zones can represent buy side imbalance and sell-side inefficiency, often playing the role of dynamic support.
Price returning to the middle part of these zones, which is typically equivalent to 50% of the imbalance, can provide suitable conditions for considering entry into buy trades.
Conversely, in downtrends, red zones are known as sell-side imbalance and buy-side inefficiency and often act as resistance. The ability to filter by size and set a minimum imbalance range allows the trader to see only valid and important zones on the chart.
This is particularly important for identifying genuine SIBI and BISI and preventing the detection of weak or false patterns. Also, the option to show or hide each type of imbalance increases analytical flexibility.
Overall, this indicator is a supplementary tool for better understanding market structure and identifying imbalance zones, not an independent trading system.
When used alongside market structure analysis, price action, and concepts like SIBI and BISI, it can noticeably increase the accuracy of entry and exit points and make trading decisions more targeted. Imbalance Indicator Links:
Conclusion
The concepts of SIBI and BISI in the ICT trading style help traders identify price imbalance zones, which act as key areas for trade entries and exits. Although similar to Fair Value Gaps (FVG), SIBI and BISI occur in strong trends with two same-direction candlesticks on either side.
Combining SIBI and BISI with market structure, liquidity, and price action significantly increases the validity of these zones. Principled use of these concepts can lead to improved trading accuracy and better risk management.


