


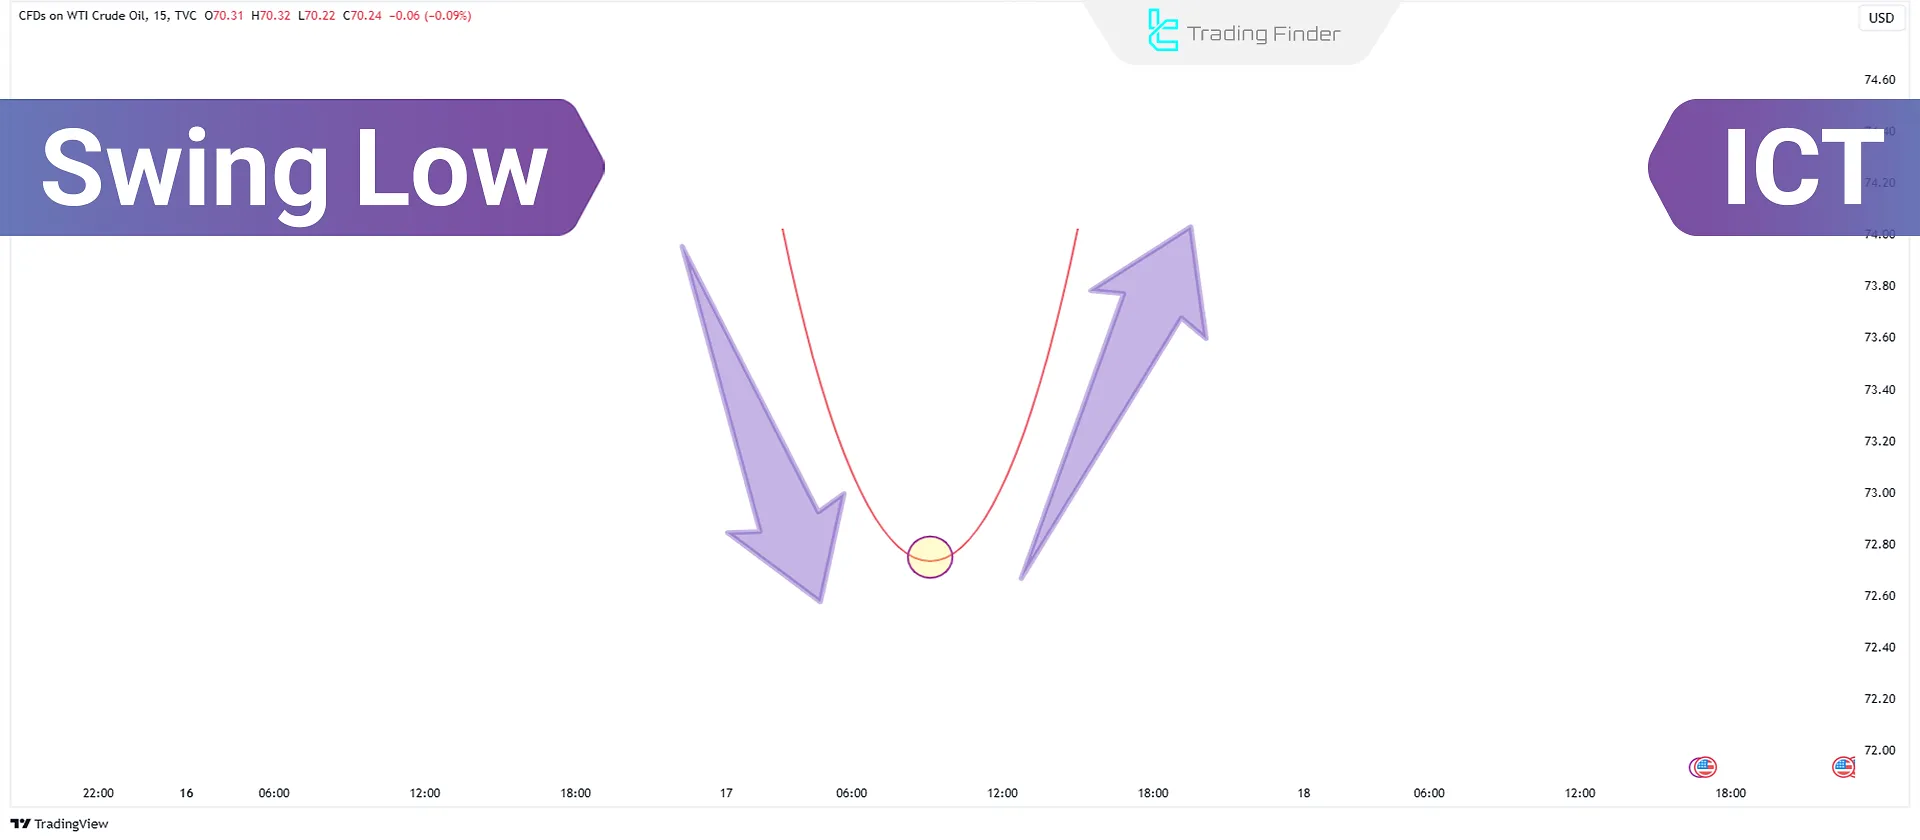
Swing Low is a key point on a price chart where the market reaches its lowest value within a specific timeframe and then moves upward. Higher highs on both sides characterize this point and serve as an essential indicator for identifying support and potential trend reversals in technical analysis.
A swing low is usually accompanied by a relative increase in volume or a decrease in bearish momentum, which can indicate a weakening of selling pressure. In market structure, a valid break of a swing low is often considered confirmation of a market structure shift and the beginning of a new bearish phase.
What is ICT Swing Low?
Swing Low occurs when the price declines and reverses upward at a specific point, forming a new low. These points appear across various timeframes and markets, making them useful in analyzing market trends in technical analysis and the ICT trading style.
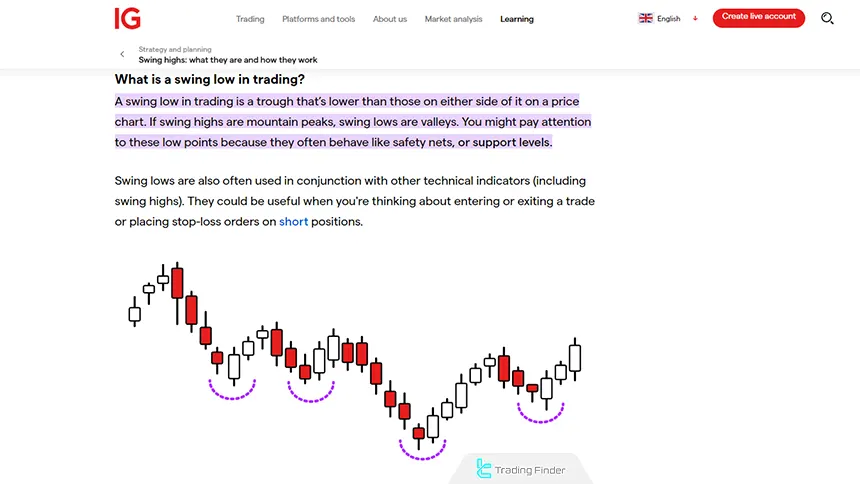
The counterpart to this strategy is Swing High, which forms during the creation of new highs. Visual Tutorial on Swing Low from IG.com:
Reason for the Formation of a Swing Low
The formation of a swing low is the result of the interaction between supply and demand forces in the market. When selling pressure gradually decreases and demand becomes active in a support area, price reaches a point where buyers are willing to enter the market.
This change in the balance of power between sellers and buyers causes the price decline to stop and leads to the start of a temporary or sustained upward move.
At the microstructure level, a swing low is the result of liquidity being absorbed below previous lows. Institutional traders (Smart Money) typically use these areas to accumulate buy orders after a false breakout.
In such conditions, by collecting resting orders in the support zone, the market prepares the ground for the next upward move. From the perspective of volume analysis and order flow, an increase in trading volume at low levels accompanied by a decrease in candle range indicates the absorption of weak sellers and the entry of fresh liquidity.
On higher timeframes, the repetition of swing lows at nearby price levels is often a sign of price consolidation before a trend change.
These areas later become recognized as valid structural support and play an important role in trading decisions based on ICT concepts or price action structure. Tutorial on Using Swing Lows from The Trading Channel YouTube Channel:
Swing Low Structure
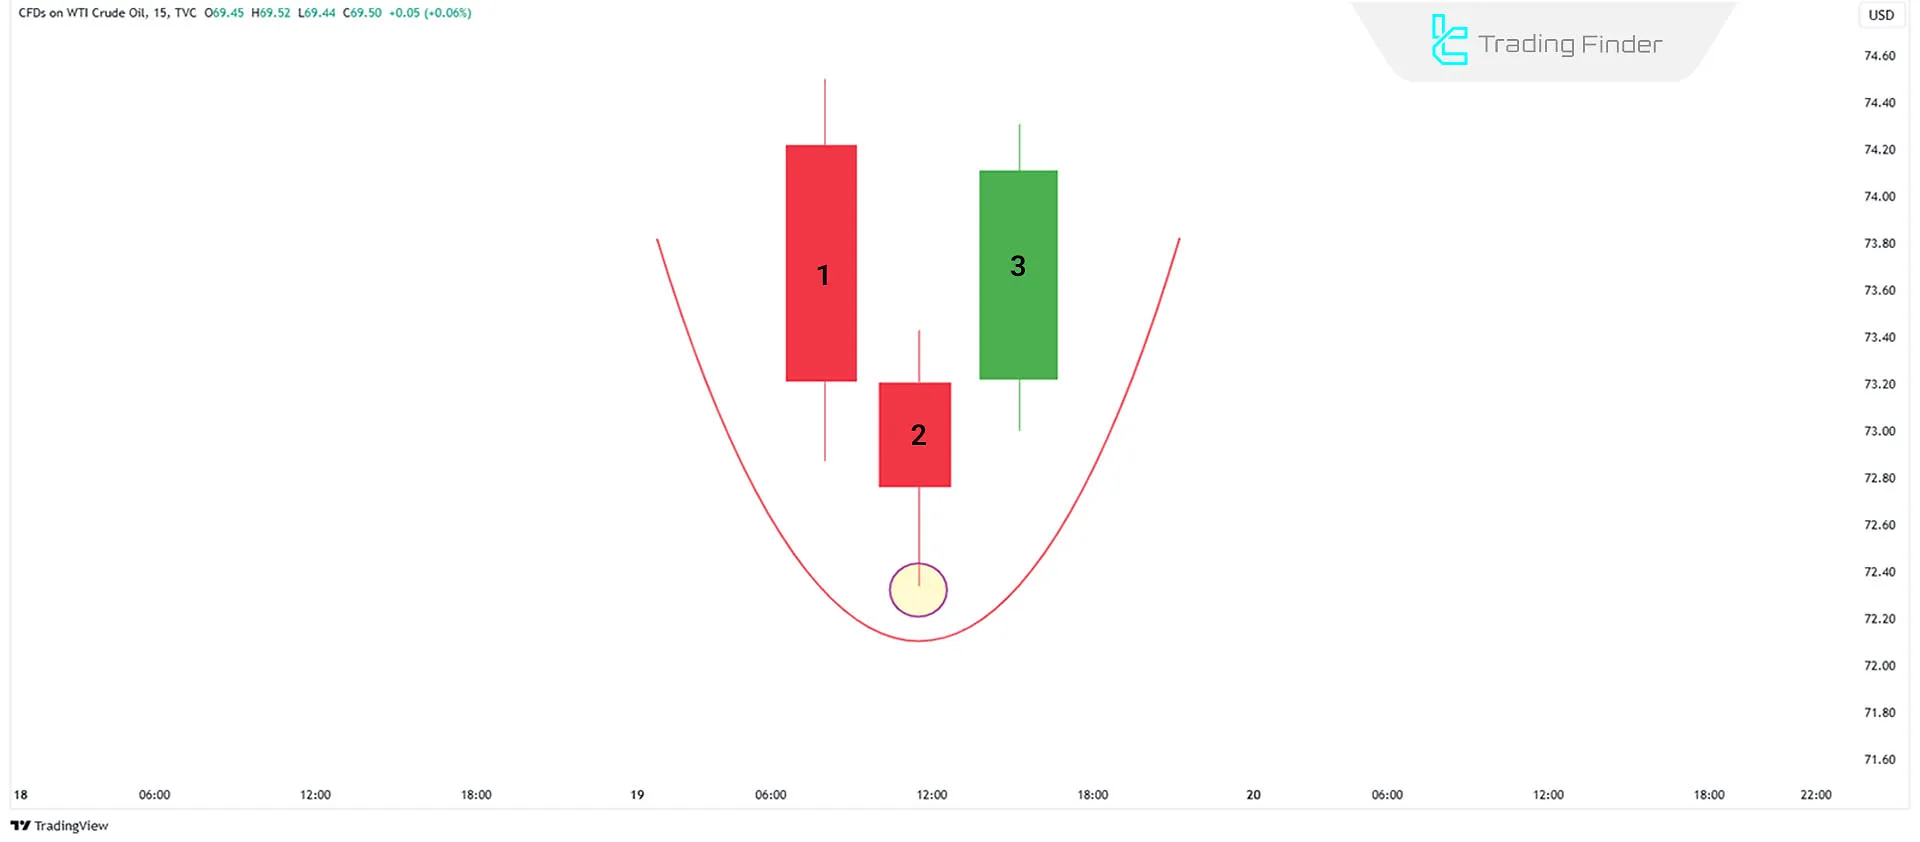
The Swing Low structure consists of three candles:
- The second candle is in the middle and has a lower price than the first and third candles;
- The first and third candles on either side have higher lows than the second candle.
This pattern resembles a "V" shape, where the second candle marks the lowest point of the pattern. At this point, the price begins its upward movement.
How to Identify Swing Low?
Follow these steps to identify this pattern:
- Locate the lowest low of a candlestick (the lowest point on the chart)
- Check the low of the left candle to ensure it is higher than the selected low
- Check the low of the right candle to ensure it is also higher than the selected low
If the lows of the left and right candles are higher than the middle candle, it is identified as an ICT Swing Low.
Advantages and Disadvantages of Swing Low
A swing low is considered an effective method for identifying support zones, risk management, and liquidity analysis; however, in highly volatile markets or without volume confirmation, it can become a source of error. Table of swing low advantages and disadvantages:
Advantages | Disadvantages |
Accurate identification of support zones | Misidentification in noisy markets |
Setting logical stop-loss levels | Increased risk in fast-moving trends |
Confirmation of a bullish phase shift | Possibility of false swing lows on lower timeframes |
Liquidity analysis and order absorption | Misinterpretation without volume data |
Multi-timeframe confluence for trend confirmation | Artificial signals in the absence of confluence |
Basis for entry after resistance breakout | Fake breakouts due to early entry |
How to Trade with Swing Low
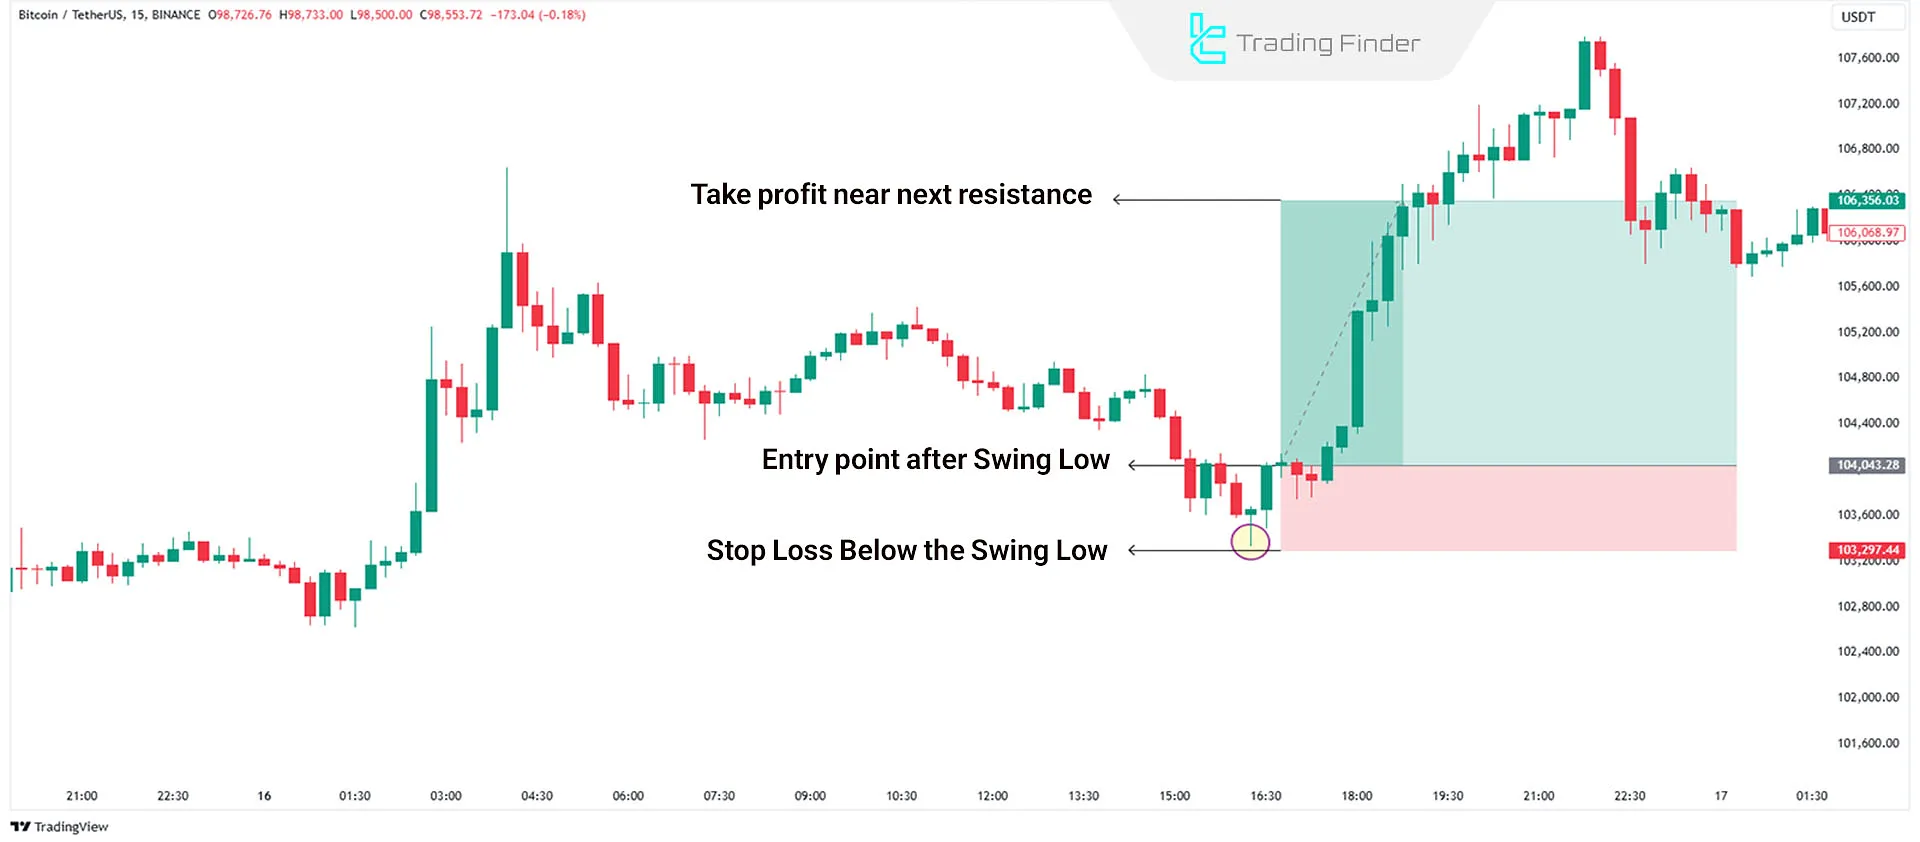
This step-by-step approach outlines a structured method for identifying and trading a bullish market opportunity. By focusing on market structure, trend direction, and proper risk management, traders can improve entry precision and control downside risk. The following steps explain how to execute this setup effectively.
#1 Identify Swing Low on the Chart
Locate a point where the market has reached its lowest value and begun an upward move. This pattern typically appears in market support areas. To increase accuracy, it is better for this point to be confirmed by a clear price reaction, such as a strong reversal candle or confluence with a decrease in bearish momentum.
#2 Uptrend and Resistance Breakout
In an uptrend, after this pattern forms and a resistance is broken, a buy signal is generated. In this case, a price pullback to the breakout area and the preservation of the swing low as support increase the validity of the entry and make it possible to define a logical stop-loss below this structure.
#3 Set a Stop Loss
Place the stop loss just below this pattern to limit losses in case of unexpected price reversals. This stop-loss placement, in addition to protecting capital, helps optimize the trade’s risk-to-reward ratio and ensures that exiting the trade occurs only if the market structure is genuinely violated.
#4 Set a Take Profit
Place the Take Profit near the next resistance level to capitalize on the upward price movement. Choosing this area as the take-profit level allows profits to be captured before selling pressure increases and helps secure trade results against sudden price reversals.
What are the Applications of Swing Low?
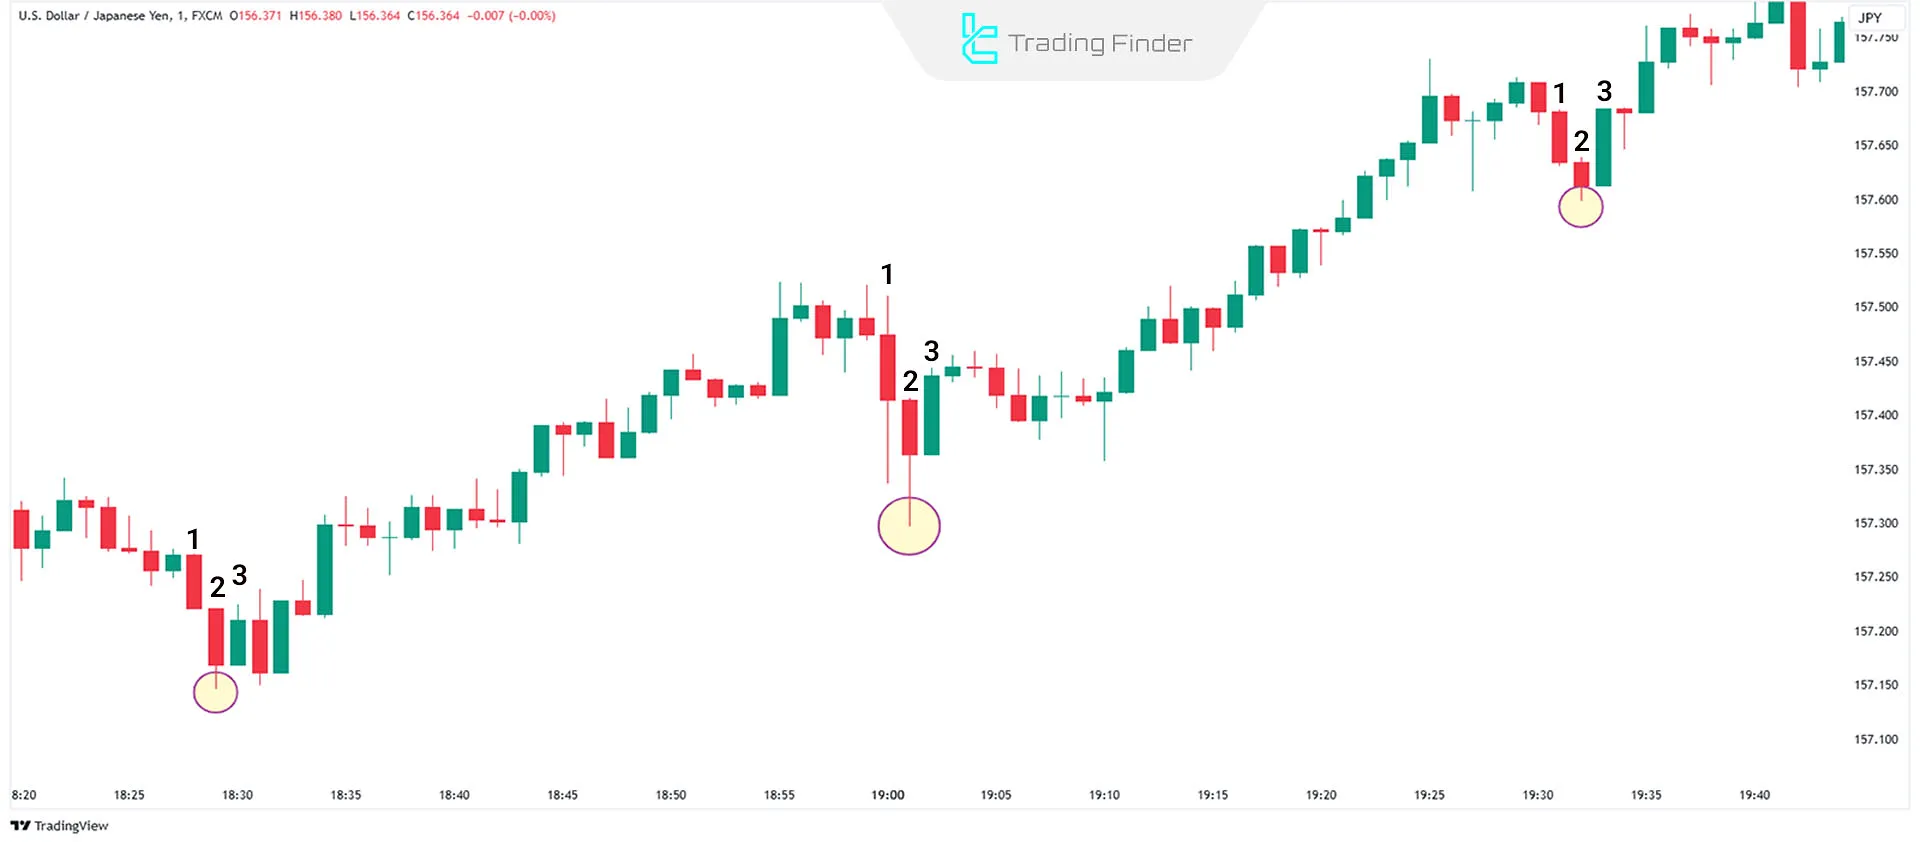
Swing Low is an essential tool for analyzing market trends and their strength. ICT Swing Low applications:
- Formation of this pattern at higher levels indicates an uptrend
- Conversely, lower Swing Lows indicate a downtrend
Additionally, the distance between these patterns provides insights into the intensity and strength of the market trend.
In many cases, this pattern acts as a critical point reflecting changes in the direction or strength of price movements.
Difference Between Swing Low and Swing High
In the ICT style, market structure analysis is based on the sequence of Swing Lows and Swing Highs.
A swing low represents an area of buy-side liquidity accumulation and the beginning of an upward move, whereas a swing high represents an area of sell-side liquidity distribution and the start of a bearish phase.
Differences in price location, volume behavior, and candlestick structure between these two define the direction and strength of order flow. Table of differences between swing low and swing high:
Feature | Swing Low (Valley) | Swing High (Peak) |
Definition | A point where price stops after a decline | A point where price stops after a rise |
Candlestick structure | Three consecutive candles; the middle candle has the lowest low compared to the two adjacent candles | Three consecutive candles; the middle candle has the highest high compared to the two adjacent candles |
Role in market trend | Sign of selling pressure stopping and the start of a buying phase or bullish correction | Sign of buying pressure stopping and the start of a selling phase or bearish correction |
Price location | Forms in support zones or below previous lows | Forms in resistance zones or above previous highs |
Volume behavior | Increased volume near the lows accompanied by small candles | Increased volume near the highs accompanied by weak candles |
Application in ICT style | Area for activating buy orders (Liquidity Grab / Accumulation) | Area for activating sell orders (Liquidity Sweep / Distribution) |
Trend confirmation | Formation of consecutive swing lows at higher levels | Formation of consecutive swing highs at lower levels |
Stop-loss zone | Below the last valid swing low | Above the last valid swing high |
Sign of market phase change | End of selling pressure, start of an upward or corrective move | End of buying pressure, start of a downward or corrective move |
Where Does ICT Swing Low Form?
This pattern in ICT trading style typically form in market support zones, where buying pressure prevents further price decline:
- In a downtrend, this pattern is followed by a short retracement
- In an uptrend, this pattern leads to continued upward movement and higher price levels
Common Mistakes in Using Swing Low
Many traders make repetitive mistakes when analyzing swing lows, which leads to misinterpreting market structure and entering trades prematurely. Understanding these mistakes is essential for the correct application of the Swing Low concept in structural analysis.
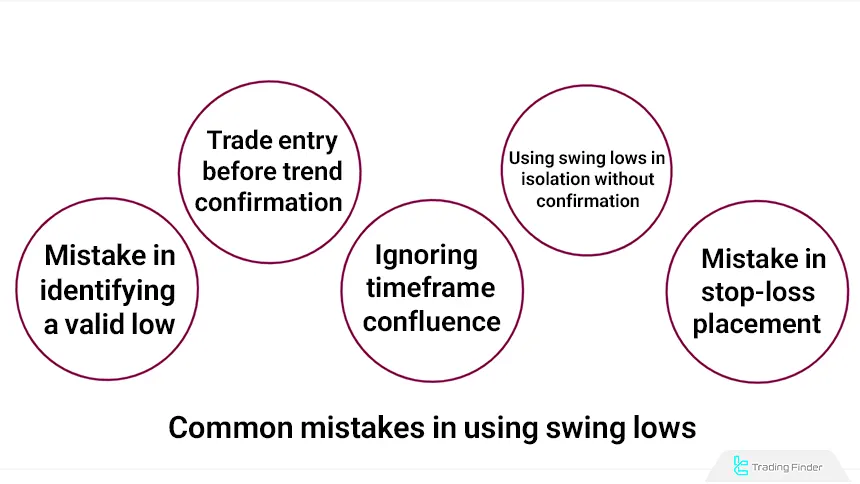
Mistake in Identifying a Valid Low
Some traders consider every minor price pullback as a swing low. However, a valid swing low is formed only when the middle candle creates a lower low compared to the two adjacent candles and is confirmed by subsequent confirmation candles.
Without structural confirmation, such identification is merely price noise.
Entering Trades Before Trend Confirmation
One of the most common mistakes is entering a buy trade immediately after the apparent formation of a valley. Confirmation of a local resistance breakout or the formation of a higher low on a higher timeframe is a necessary condition for the validity of a swing low.
Early entry exposes the trader to redistribution phases or the continuation of a bearish trend.
Ignoring Multi-Timeframe Confluence
Analyzing a single timeframe without simultaneously examining a higher timeframe leads to incorrect identification of the overall market direction.
In the ICT style, the validity of any swing low is confirmed only when it also overlaps with a buy-side liquidity zone or an order block on the higher timeframe.
Using Swing Low in Isolation Without Volume or Liquidity Confirmation
Relying solely on candlestick patterns without analyzing trading volume or smart liquidity flow is another common mistake. A swing low is meaningful only when it is accompanied by an increase in buying volume or the absorption of sell orders in the low area.
Incorrect Stop-Loss Placement
Placing the stop loss too far from the swing low increases trade risk; conversely, placing it too close to the low increases the likelihood of premature exit. The logical stop-loss location is slightly below the confirmed low.
Previous High and Low Indicator in Identifying Swing Lows
The previous high and low indicator is one of the tools in technical analysis that identifies important market price levels based on historical data.
Using raw price data, this indicator detects highs and lows across different time intervals such as daily, weekly, or the most recent candle, and displays them as horizontal lines on the chart.
These levels are considered price reaction zones because the market has previously encountered buying or selling pressure at these points. A renewed interaction of price with these lines may signal a reversal or, in the case of a valid breakout, confirmation of trend continuation.
Educational videos on using the previous high and low indicator:
For this reason, this indicator is categorized among support and resistance tools as well as reversal and breakout indicators.
In an uptrend, price breaking above the previous high is a sign of strengthening buyers and continuation of the bullish move, while in a downtrend, breaking below the previous low confirms the continuation of selling pressure.
In both cases, a price pullback to the broken level and a renewed reaction to it are considered a potential trade entry zone.
This indicator is usually used with settings such as Zigzag Period and History Limit to control the sensitivity of reversal points, and it can generate dynamic or static lines.
The display of pivots, the color of high and low lines, and line thickness are also customizable, allowing the analyst to clearly observe the market’s price structure.
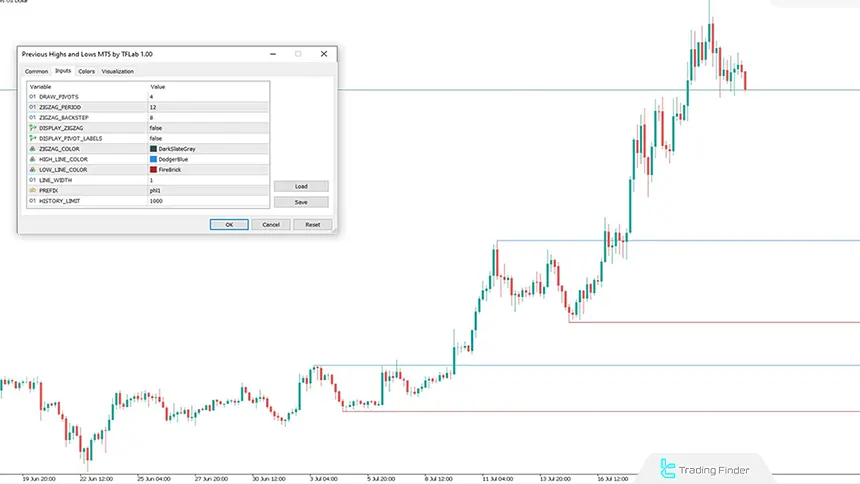
From a structural analysis and ICT perspective, the low lines of this indicator effectively act as swing low points-that is, areas where the market tends to reverse after liquidity absorption and the cessation of selling pressure.
Combining swing low analysis with previous low levels from this indicator enables more precise identification of support zones and high-probability trade entry points.
Download links for the previous high and low indicator:
Conclusion
Swing Low is a simple yet powerful concept in technical analysis that highlights reversal or continuation points in trends. By analyzing price ICT Swing Lows, traders can identify ideal entry points for trades.
In the ICT style, each swing low is considered a sign of liquidity absorption and the beginning of an accumulation phase, forming the foundation of a market structure shift.
The price reaction after this liquidity absorption especially in the form of displacement or a break in structure determines whether the market has entered an expansion phase or is still remaining within accumulation.


