


Market analysis based on ICT style is built upon a multi-timeframe approach; in this method, the trader first examines the Higher Timeframe (HTF) to determine the overall market direction and identify key areas such as daily support and resistance levels or major liquidity points.
This stage acts as a roadmap and sets the general market bias for subsequent decision-making. This process is referred to as multi-timeframe analysis and allows the trader to use ict trading session times and ict timing to locate the best entry zones.
After this, the focus shifts to the Lower Timeframes (LTF) to reveal trade entry details.
At this layer, using tools such asOrder Block , FVG , orLiquidity Grab, the exact entry and exit points are determined, enabling the trader to select the best trading opportunities in alignment with the structure of the higher timeframe.
This synchronization is known as timeframe alignment ict and is introduced in trading ict lessons as a part of the ict trading strategy.
What Is a Timeframe?
A timeframe is the time interval each candlestick represents on the chart. Each timeframe displays price movement over a specific period.
In financial markets, any time span can be used as a timeframe, but generally, certain timeframes are more widely used in markets like the Forex Market, including:
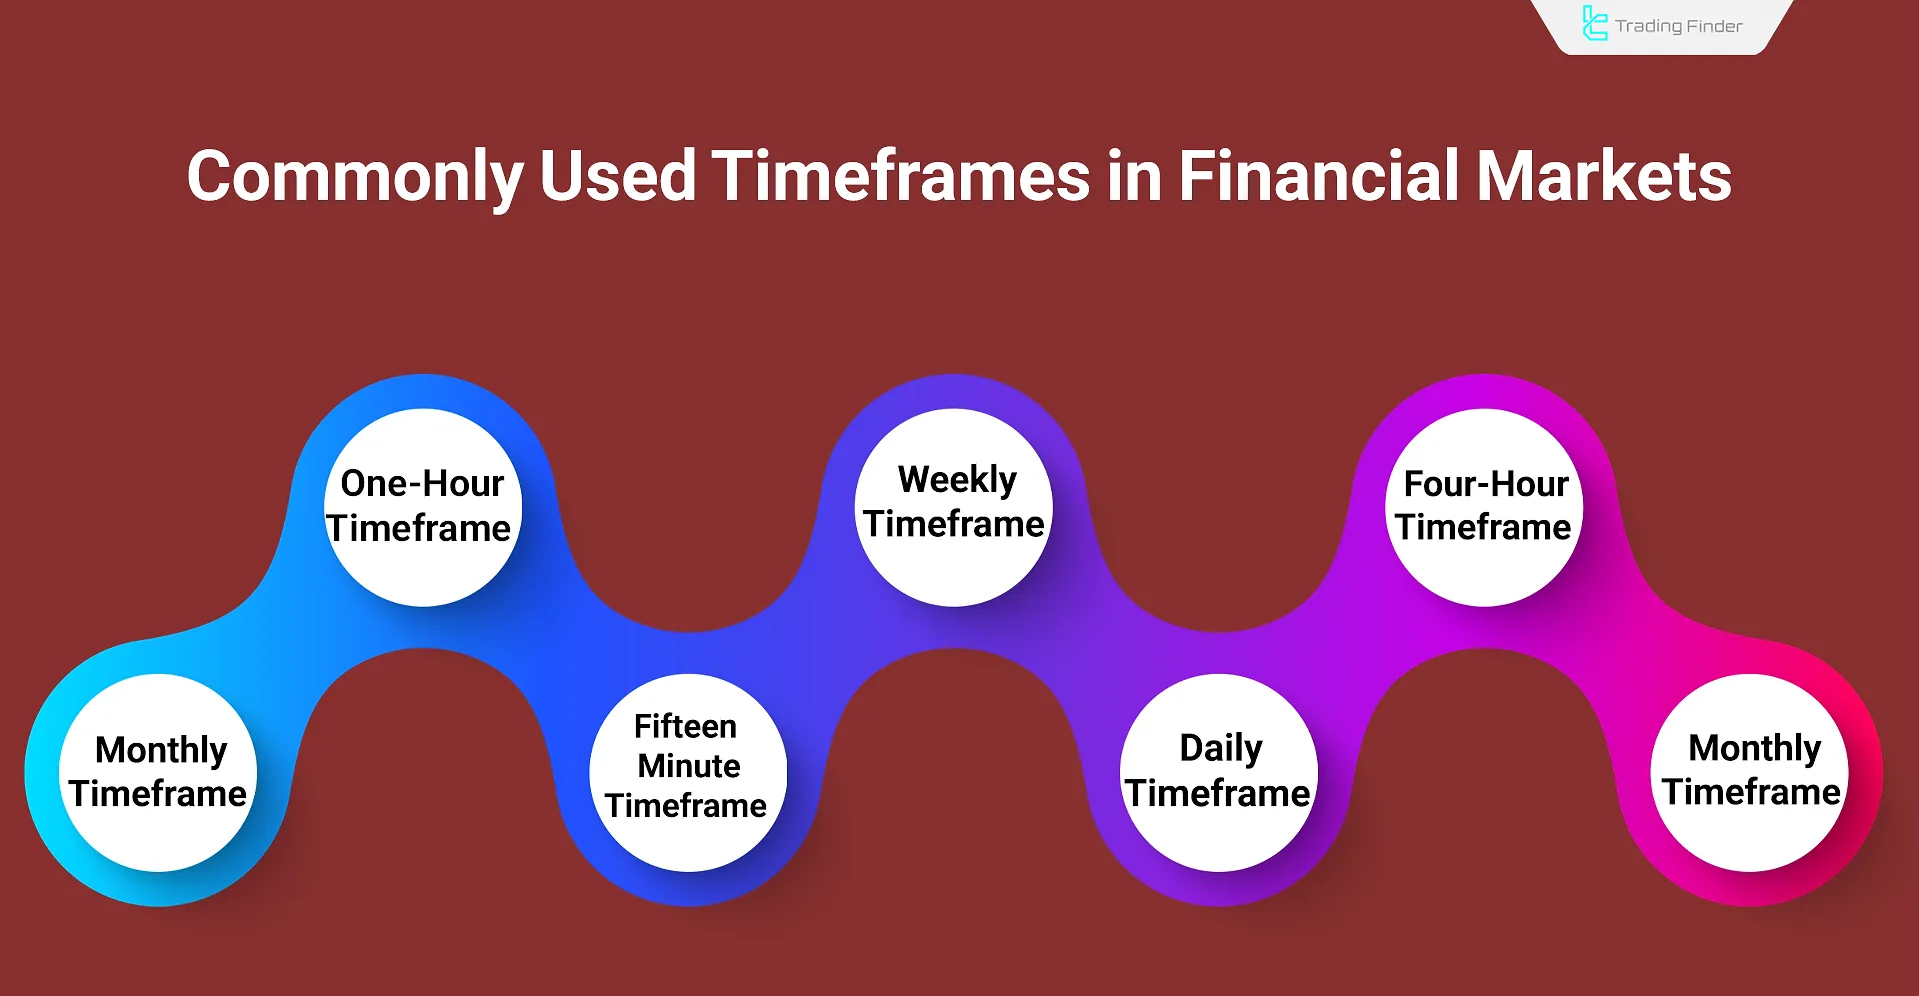
Choosing the Right Timeframe in ICT Style
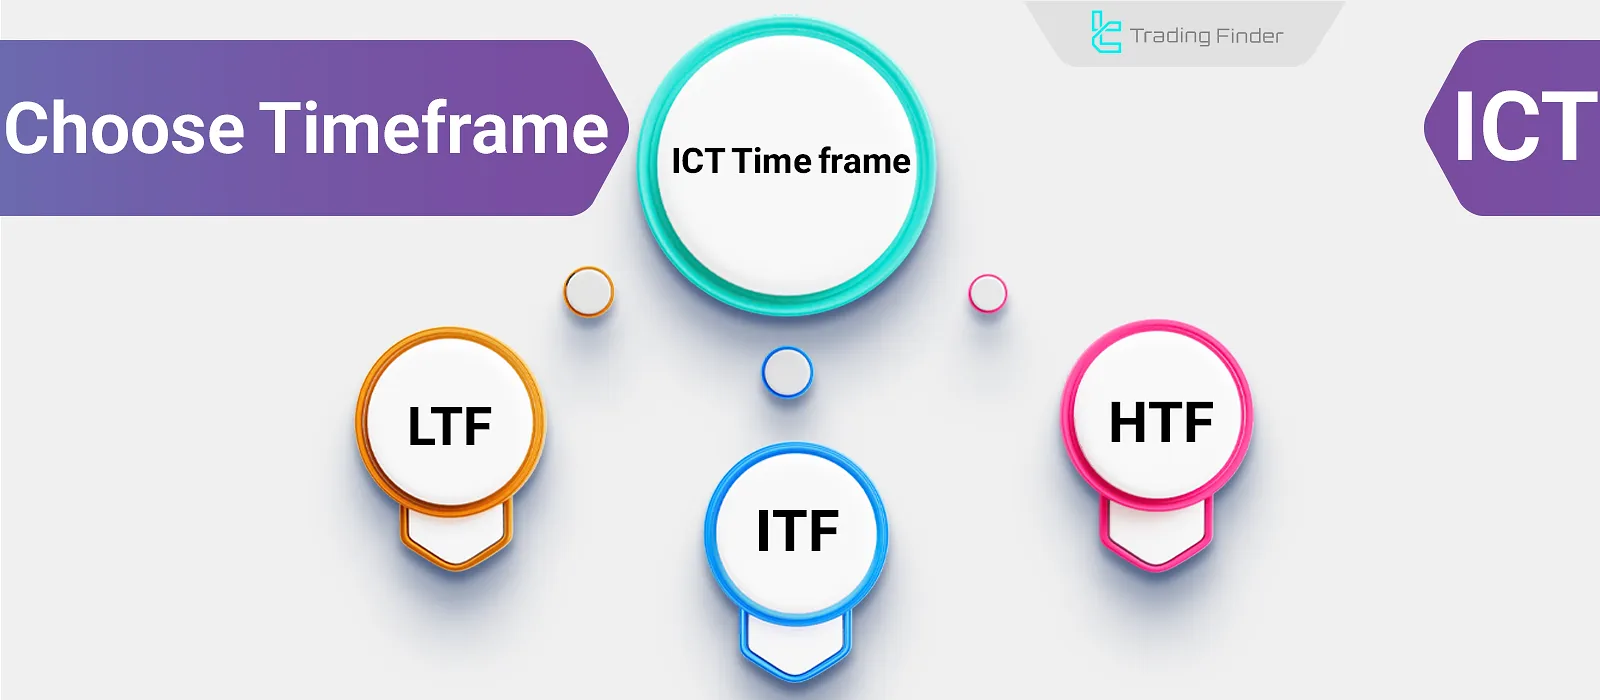
In ICT style, market analysis is conducted using the Top-Down Analysis concept; Based on the information in the ICT Timeframe Training on the Writo-Finance website timeframes in ICT are divided into three distinct categories.
Many traders, by reviewing ict killzone times and ict time sessions, decide in which interval to enter the market.
ICT Timeframe Classification Table:
ICT Timeframe Category | Main Application | Additional Explanation |
Higher Timeframe (HTF) | Determining overall trend direction | Market overview; key for Top-Down analysis; picks best forex timeframes |
Intermediate Timeframe (ITF) | Market structure confirmation | Identifies BOS, MSS, and trend-aligned retracements |
Lower Timeframe (LTF) | Identifying entry points | Helps spot FVG, Order Blocks, Liquidity Grabs for precise LTF entries |
Optimal ICT Timeframe Selection
In ICT, market analysis is conducted using the Top-Down Analysis method. ICT timeframes are categorized into three types:
- Higher Timeframe (HTF): Used to determine the overall trend direction;
- Intermediate Timeframe (ITF): Applied to confirm the market structure;
- Lower Timeframe (LTF): Used to identify precise trade entry points.
The choice of ICT timeframe directly correlates with the trading strategy. For example, the Daily timeframe is the lowest for position trading, whereas the H4 timeframe is the highest used for day trading.
Inside the TTrades YouTube channel, the use of ICT Timeframe Alignment is taught through a video tutorial:
Position Trading
Position trading involves long-term trades that may last for weeks or even months. In the ICT style, it's recommended to use three specific timeframes:
- Monthly as the Higher Timeframe (HTF)
- Weekly as the Intermediate Timeframe (ITF)
- Daily as the Lower Timeframe (LTF)
Monthly Timeframe (Monthly)
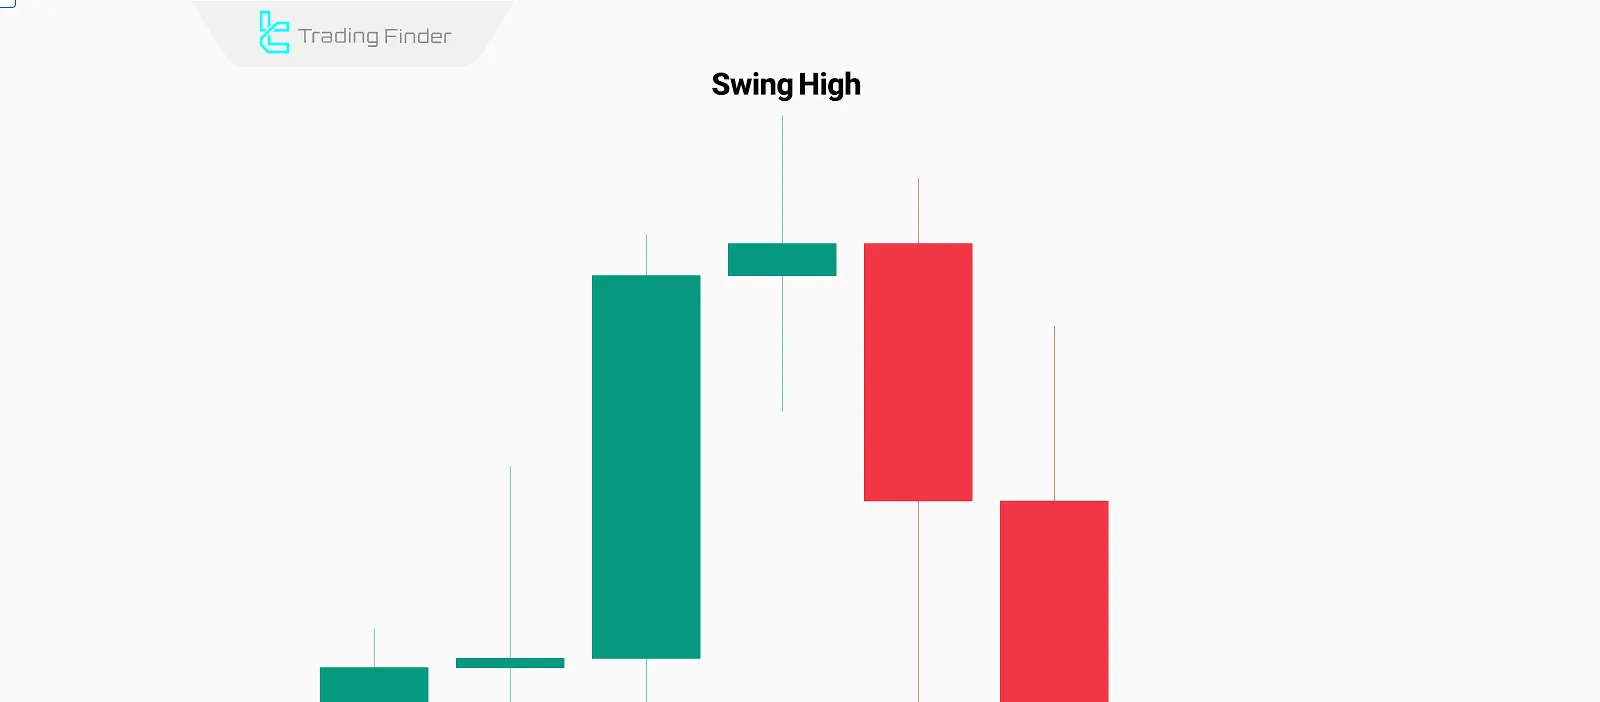
Monthly timeframe is used to identify the overall market trend and detect key levels such as swing highs and swing lows.
Weekly Timeframe (Weekly)
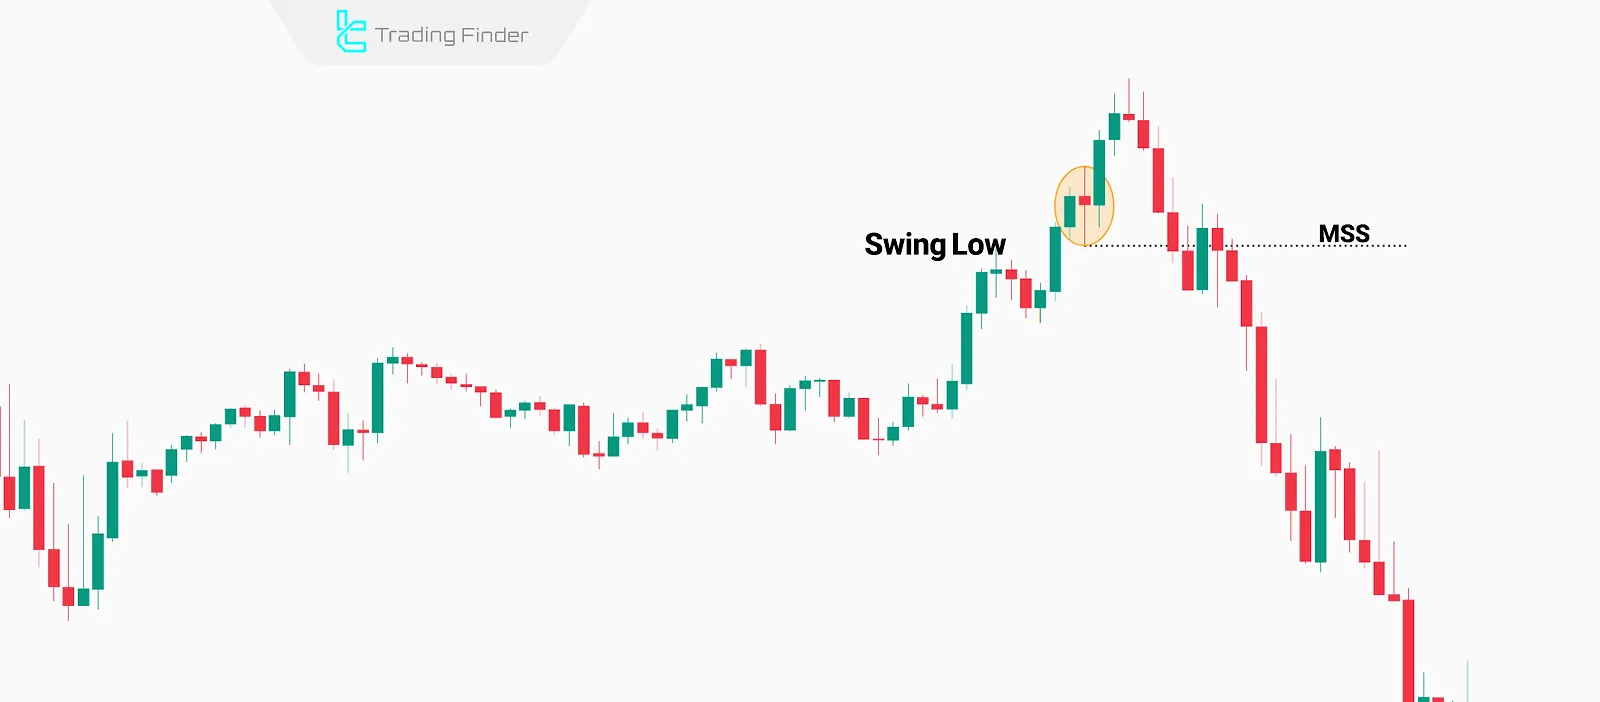
Weekly time frame in Position trading is used to detect directional changes by identifying ICT concepts such as market structure shifts and validating patterns recognized on lower timeframes.
Daily Timeframe (Daily)
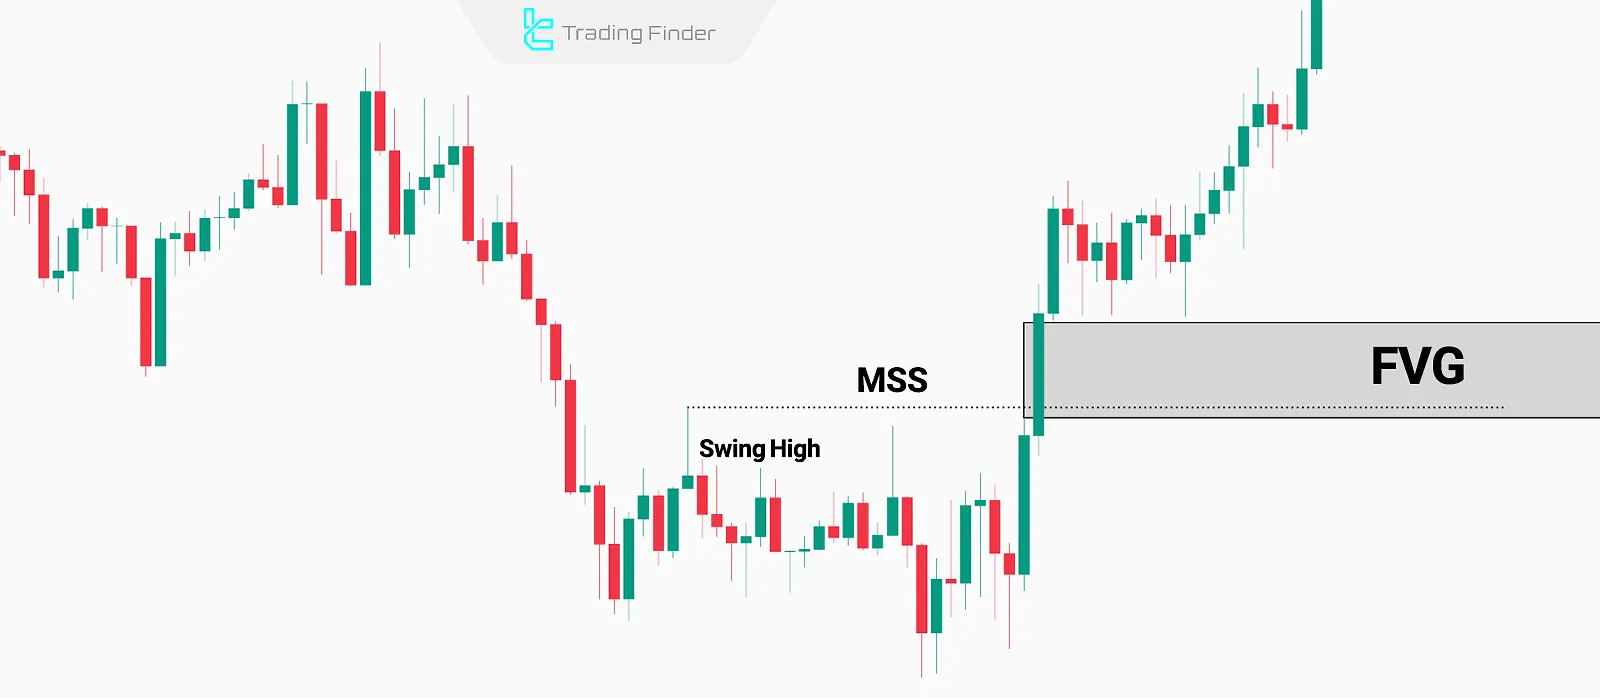
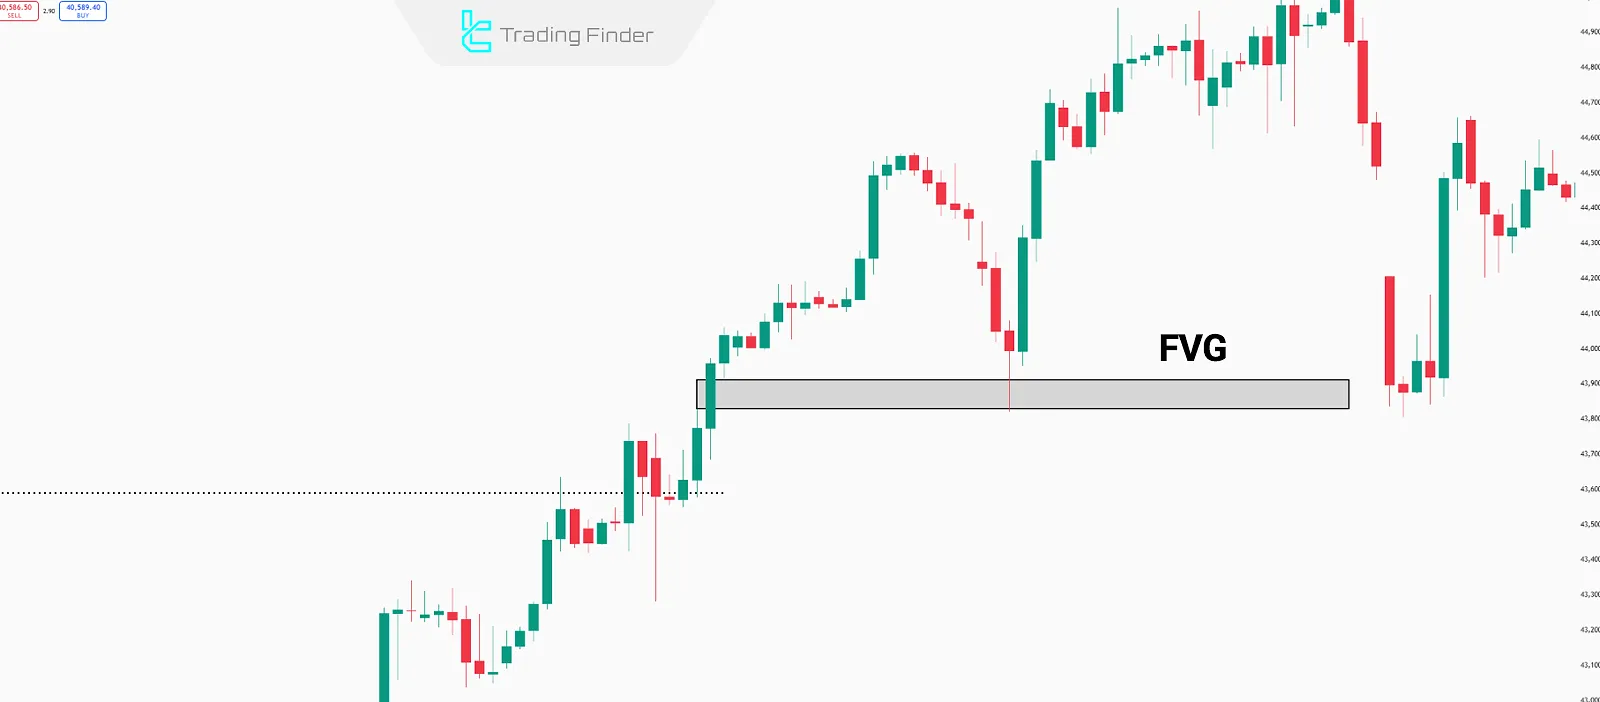
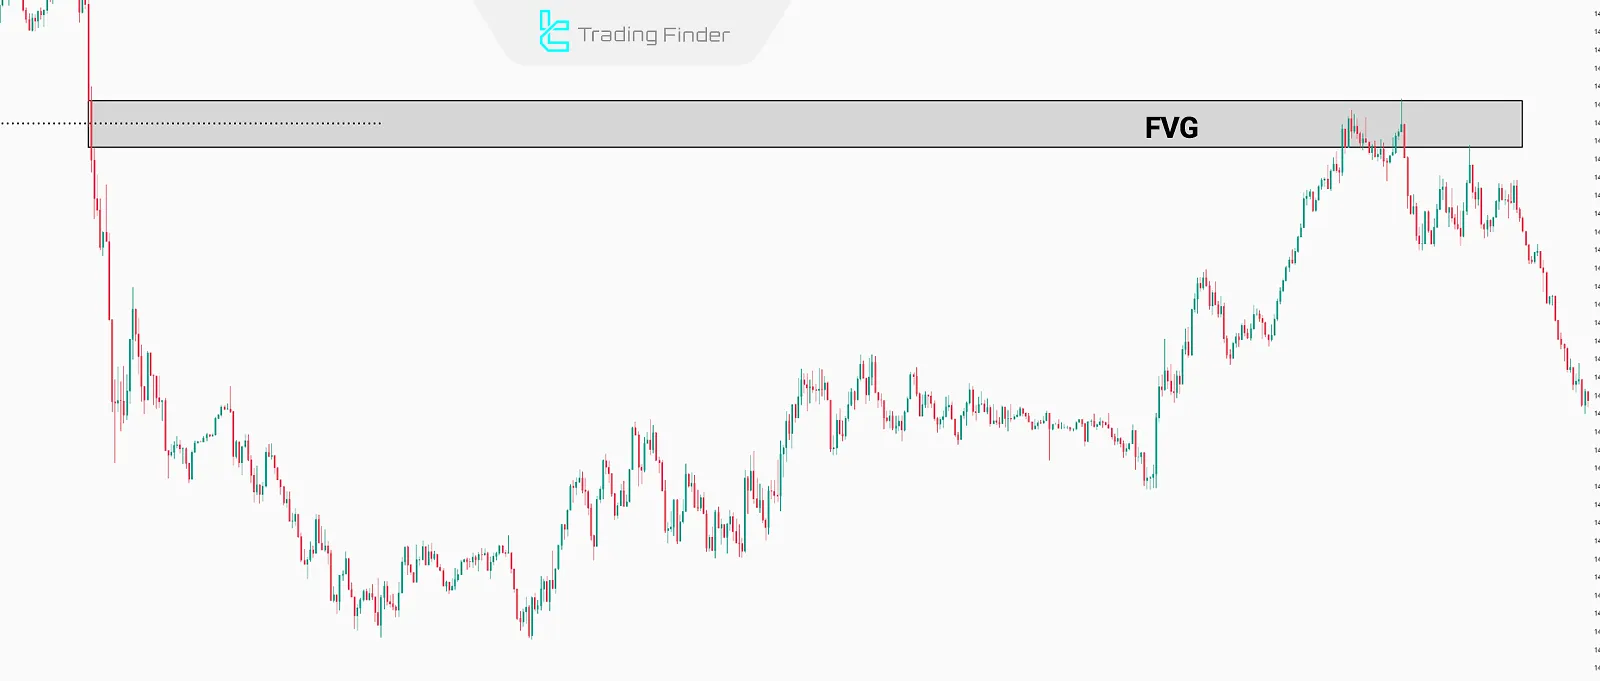
Daily intervals are used to identify entry points using ICT concepts like Fair Value Gap (FVG).
Swing Trading
Swing trading consists of trades that typically last a few days to a few weeks. In the ICT style, the recommended timeframes are:
- Daily as the Higher Timeframe (HTF)
- 4-Hour (H4) as the Intermediate Timeframe (ITF)
- 1-Hour (H1) as the Lower Timeframe (LTF)
Daily Timeframe (Daily)
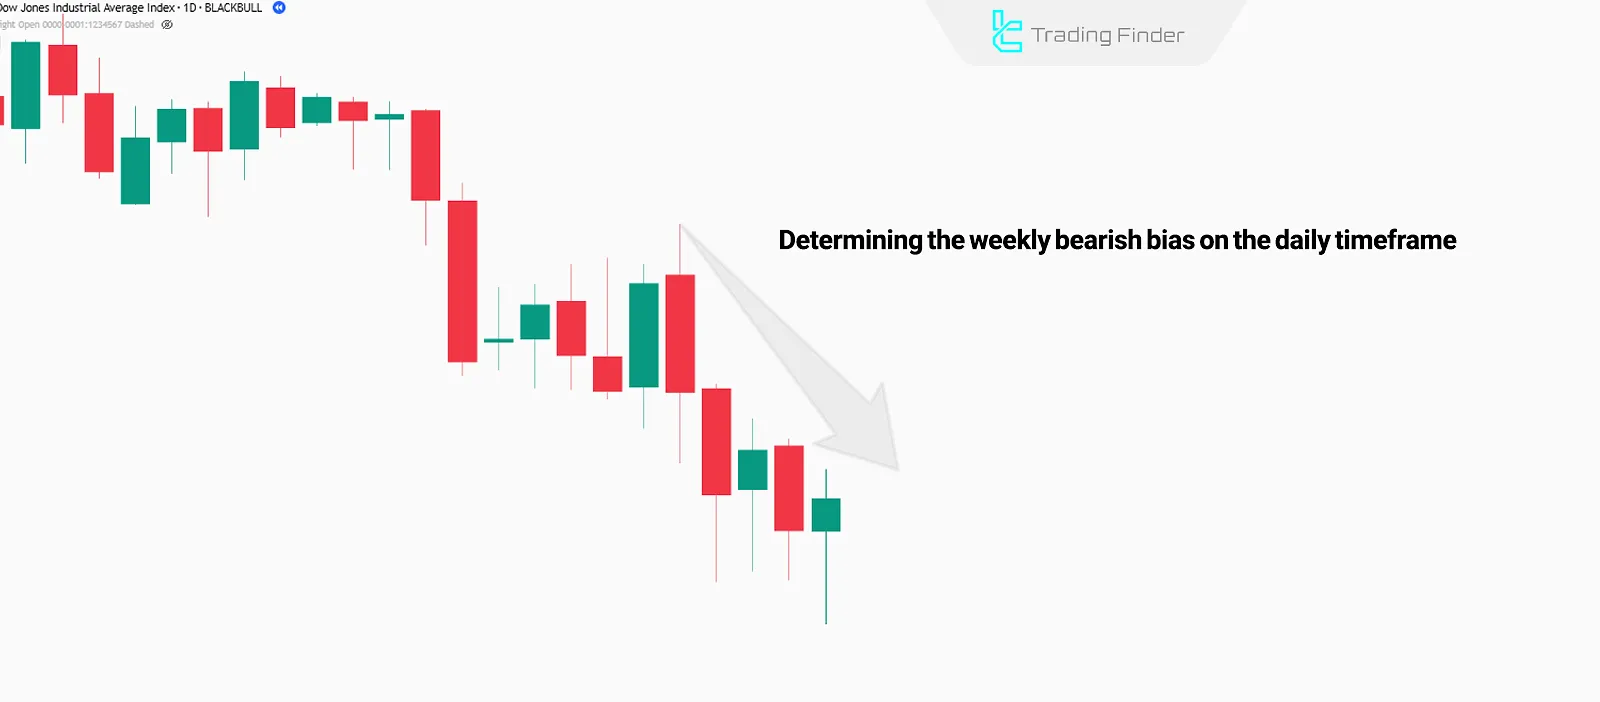
Daily timeframe in Swing trading is used to detect the weekly trend and define key levels such as swing highs and swing lows.
4-Hour Timeframe (H4)
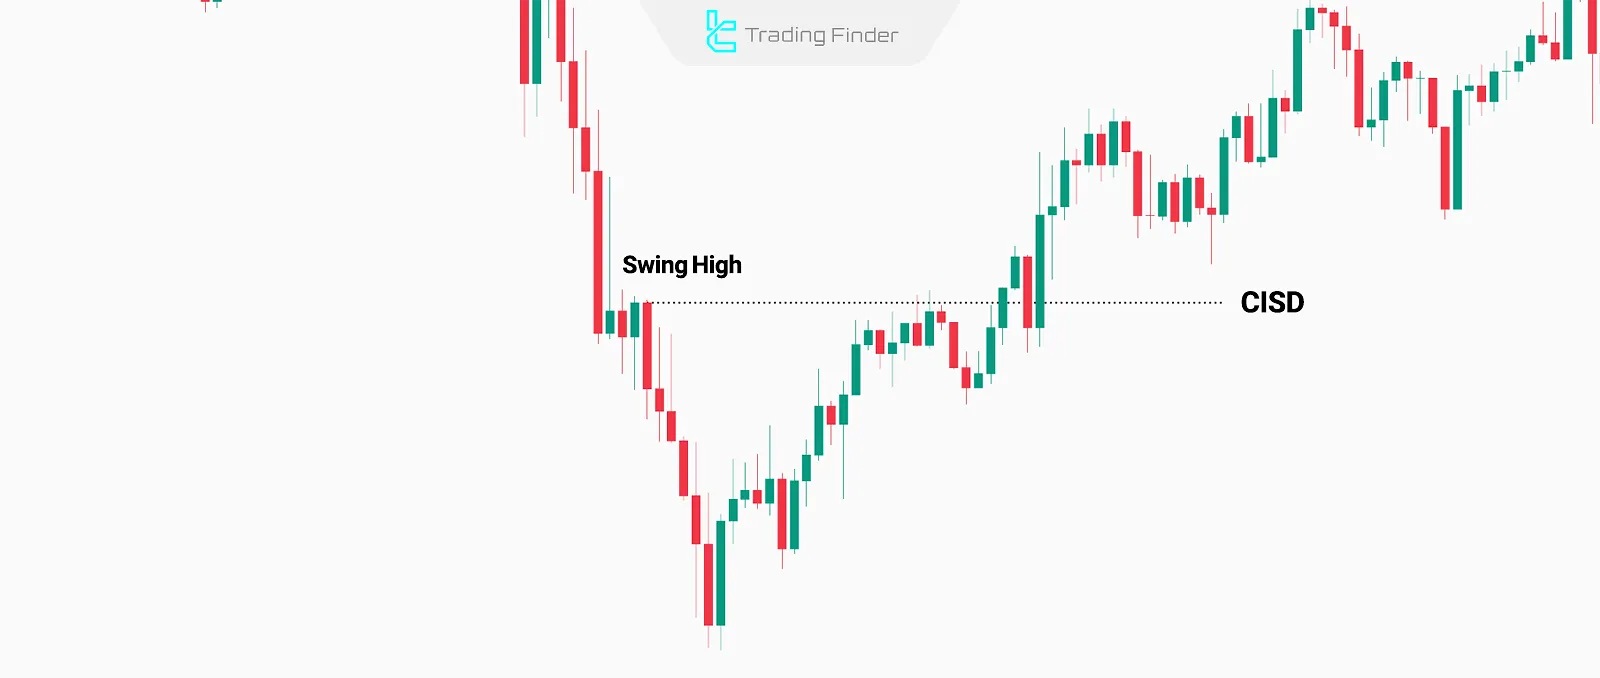
4-hour intervals identify directional shifts or key level breaks using ICT concepts like Change in State Delivery (CISD).
1-Hour Timeframe (H1)
1-hour timeframe is used to detect potential trade entry points based on ICT concepts like Change in State Delivery (CISD) in Swing trading.
Day Trading
Day trades typically last for several hours and are closed by the end of the trading day. In ICT day trading, it's common to use:
- 1-Hour (H1) as the Higher Timeframe (HTF)
- 15-Minute (M15) as the Intermediate Timeframe (ITF)
- 5-Minute (M5) as the Lower Timeframe (LTF)
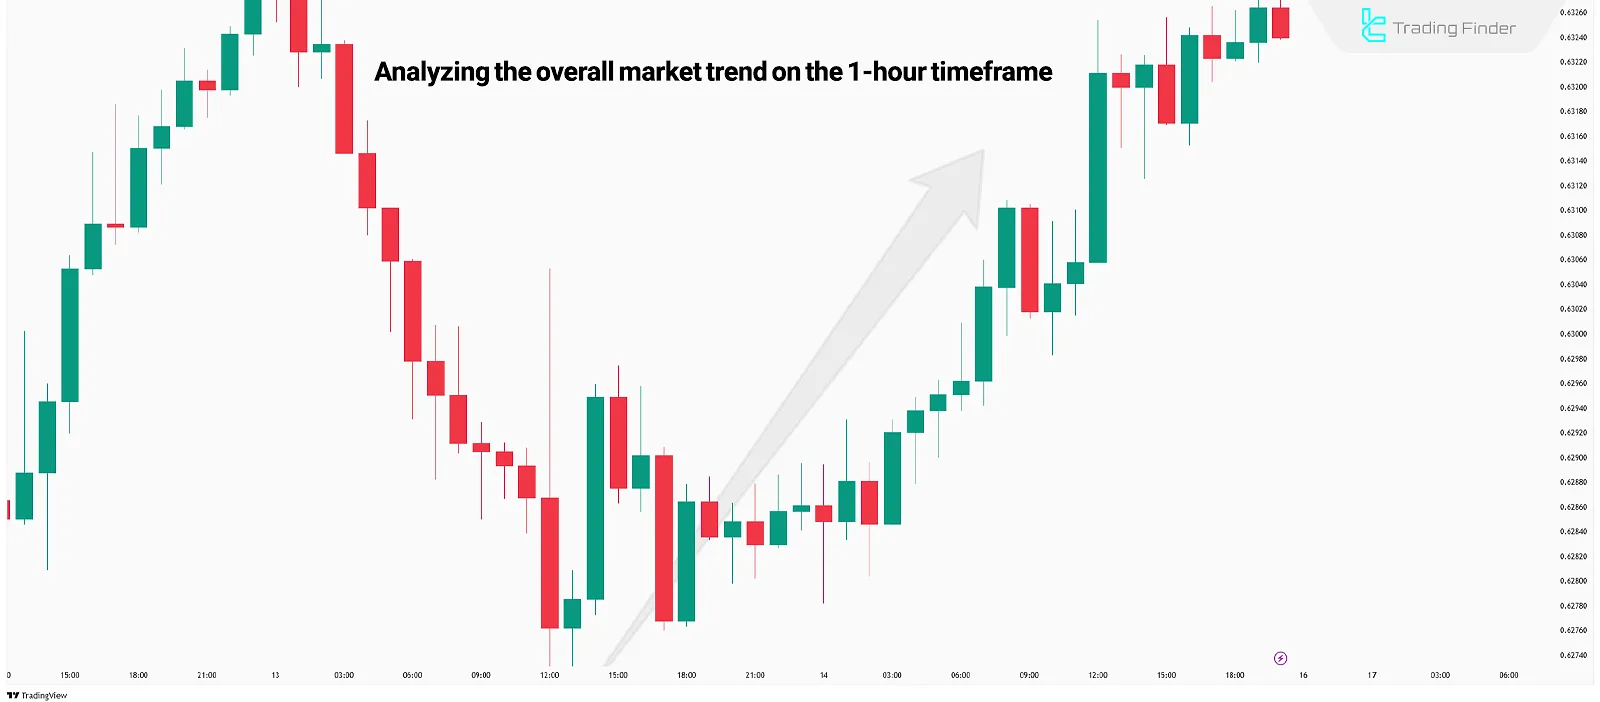
1-Hour Timeframe (H1)
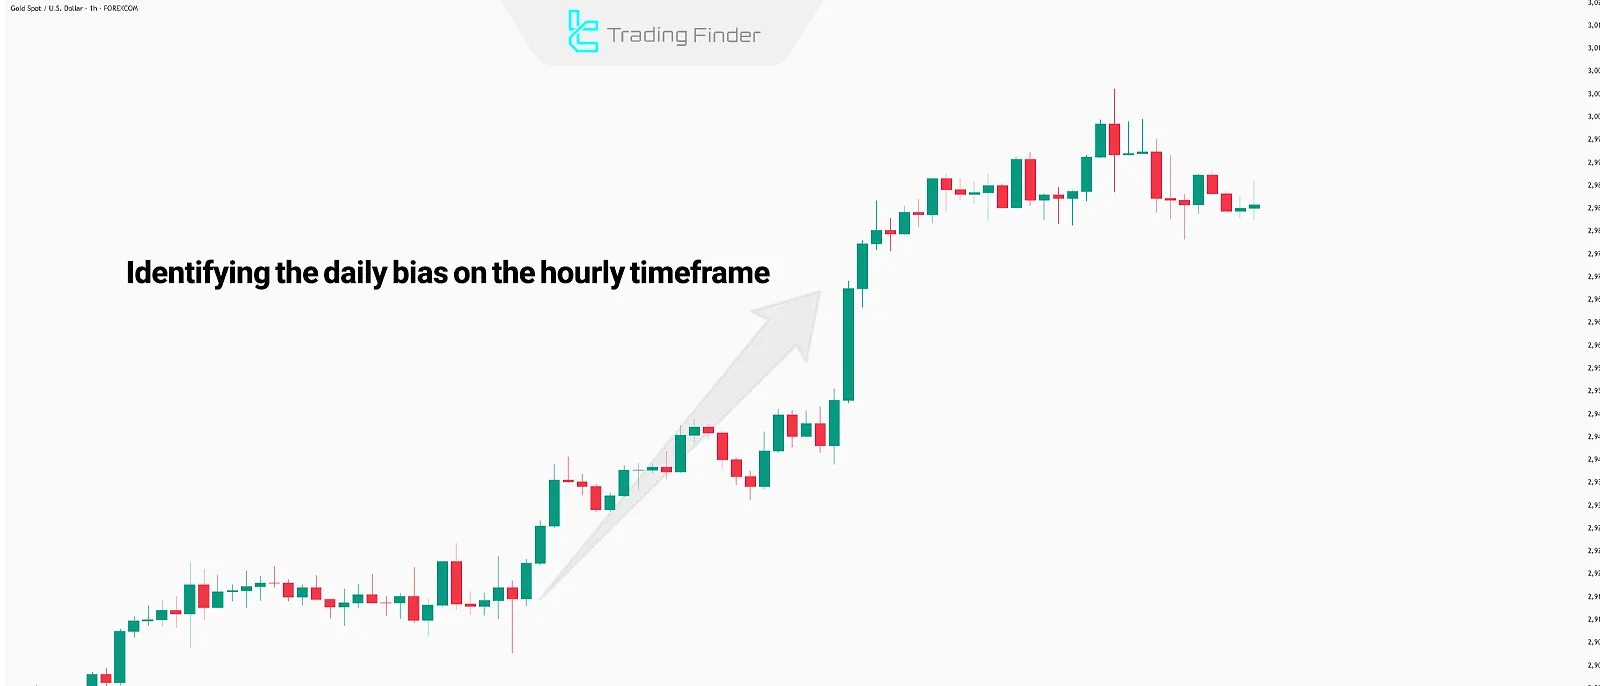
1-hour intervals help to identify the daily bias and major support/resistance levels of the primary trend.
15-Minute Timeframe (M15)
M15 timeframe is used to identify directional shifts or key level breaks using ICT concepts.
5-Minute Timeframe (M5)
A 5-minute timeframe helps to identify entry points, stop-loss levels, and ICT patterns such as liquidity grabs in Day trading.
Scalping
Scalping involves short-term trades that last a few seconds to a few minutes. The goal is to execute numerous trades with small profits.
The recommended ICT timeframes for scalping are:
- 1-Hour (H1) as the Higher Timeframe (HTF)
- 5-Minute (M5) as the Intermediate Timeframe (ITF)
- 1-Minute (M1) as the Lower Timeframe (LTF)
1-Hour Timeframe (H1)
1-hour intervals help to identify the short-term market trend and daily support/resistance levels in scalping style.
5-Minute Timeframe (M5)
5-minute timeframe detects key level breaks and signals for continuation or reversal of price direction.
1-Minute Timeframe (M1)
1-minute intervals allow for quick entries and exits using ICT patterns.
Importance of the Intermediate Timeframe (ITF) in ICT Style
Within the three-layered ICT framework, the Intermediate Timeframe (ITF) acts as the bridge between the broader analysis on HTF and the precise entries on LTF.
This timeframe is mostly used for trade management; for instance, the trader can use ITF to evaluate whether price movement is likely to continue or to identify the proper point for stop-loss adjustment.
This approach is particularly useful in ict kill zone trading and ict asian kill zone time.
Example of EUR/USD Chart Review in ICT Multi-Timeframe Analysis
For example, in the EUR/USD currency pair chart, on the higher timeframe (HTF) such as Daily, a downtrend is identified, and price is approaching the Previous Day High (PDH) zone.
This level can be considered an important liquidity area.
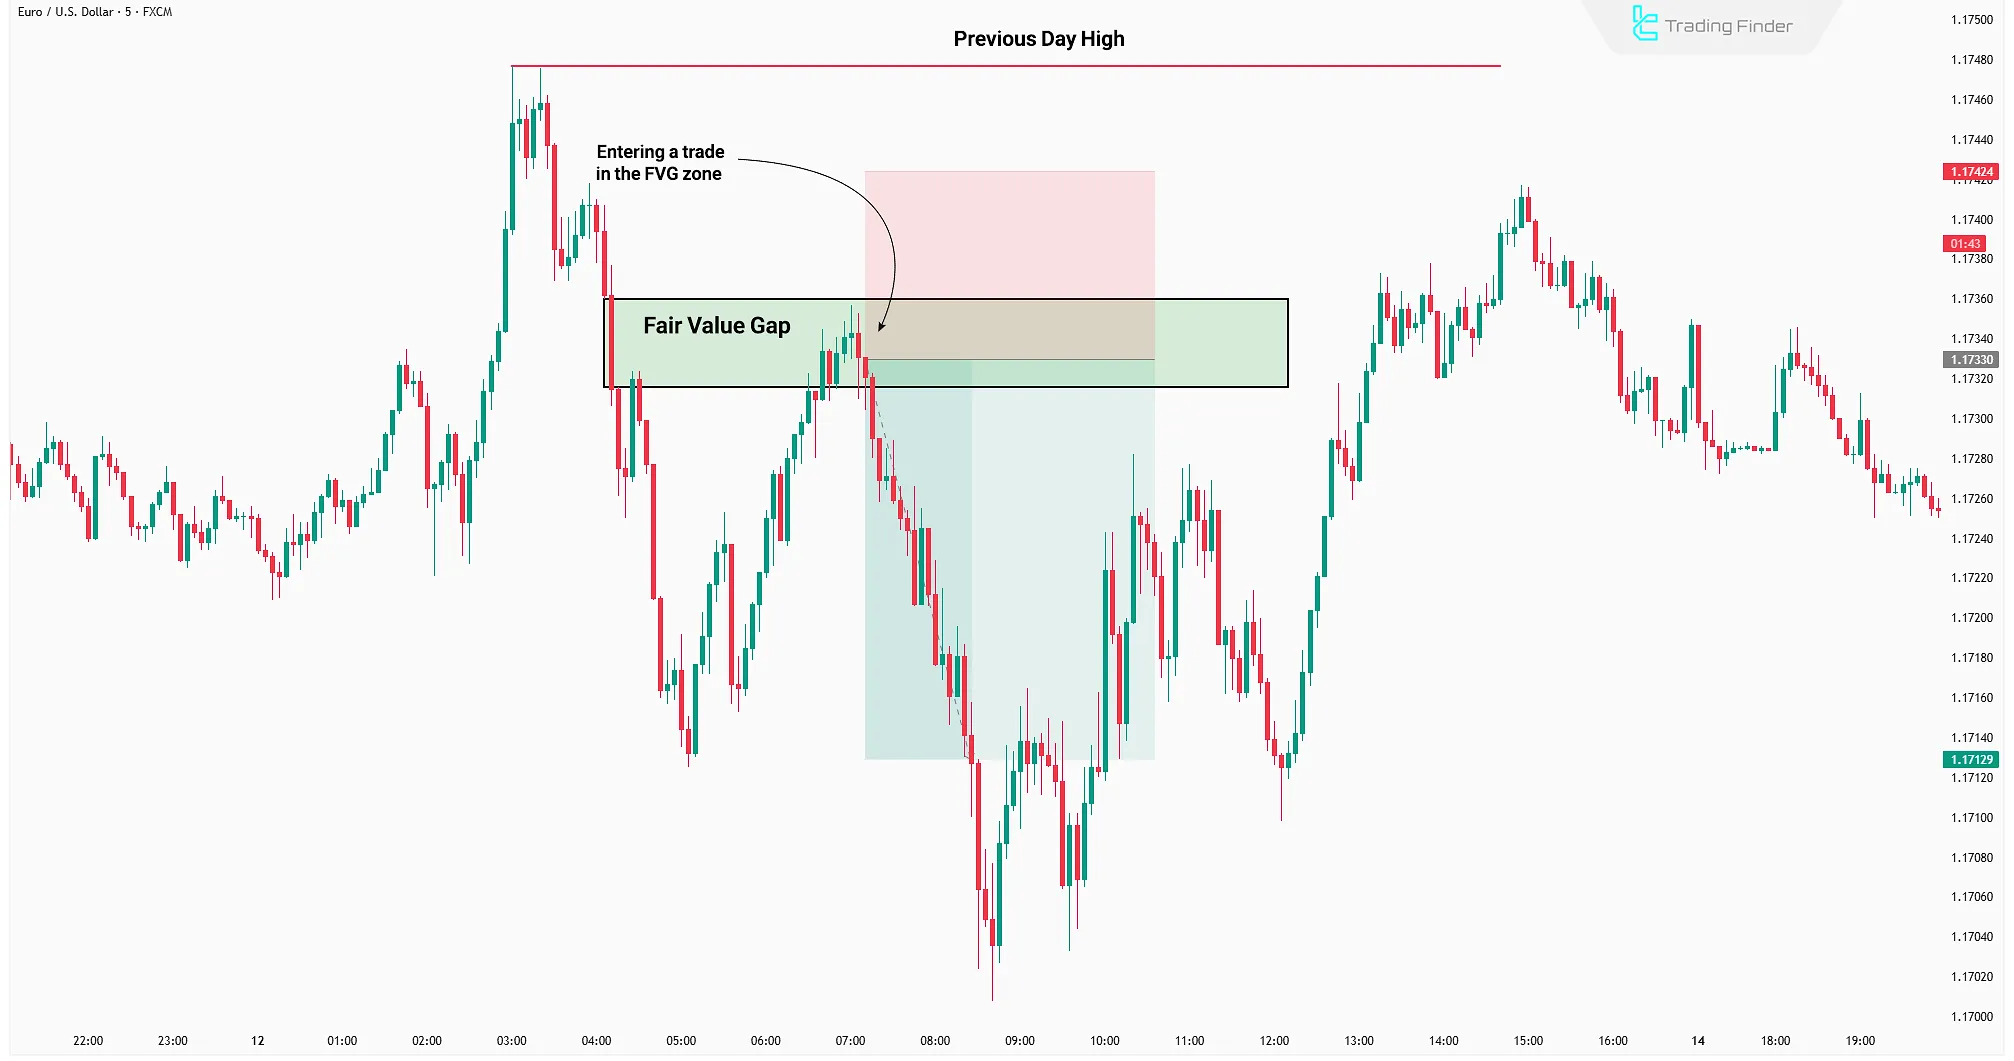
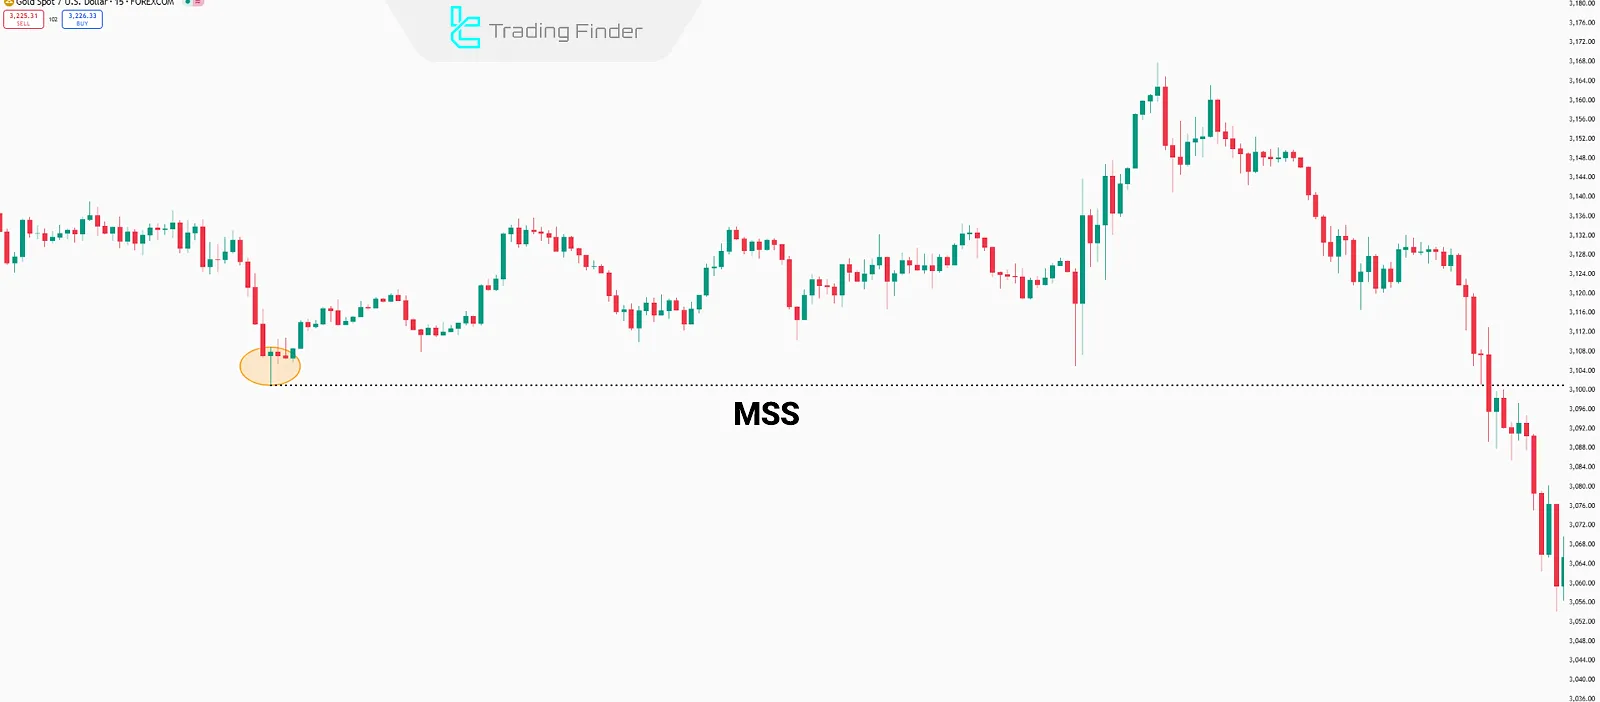
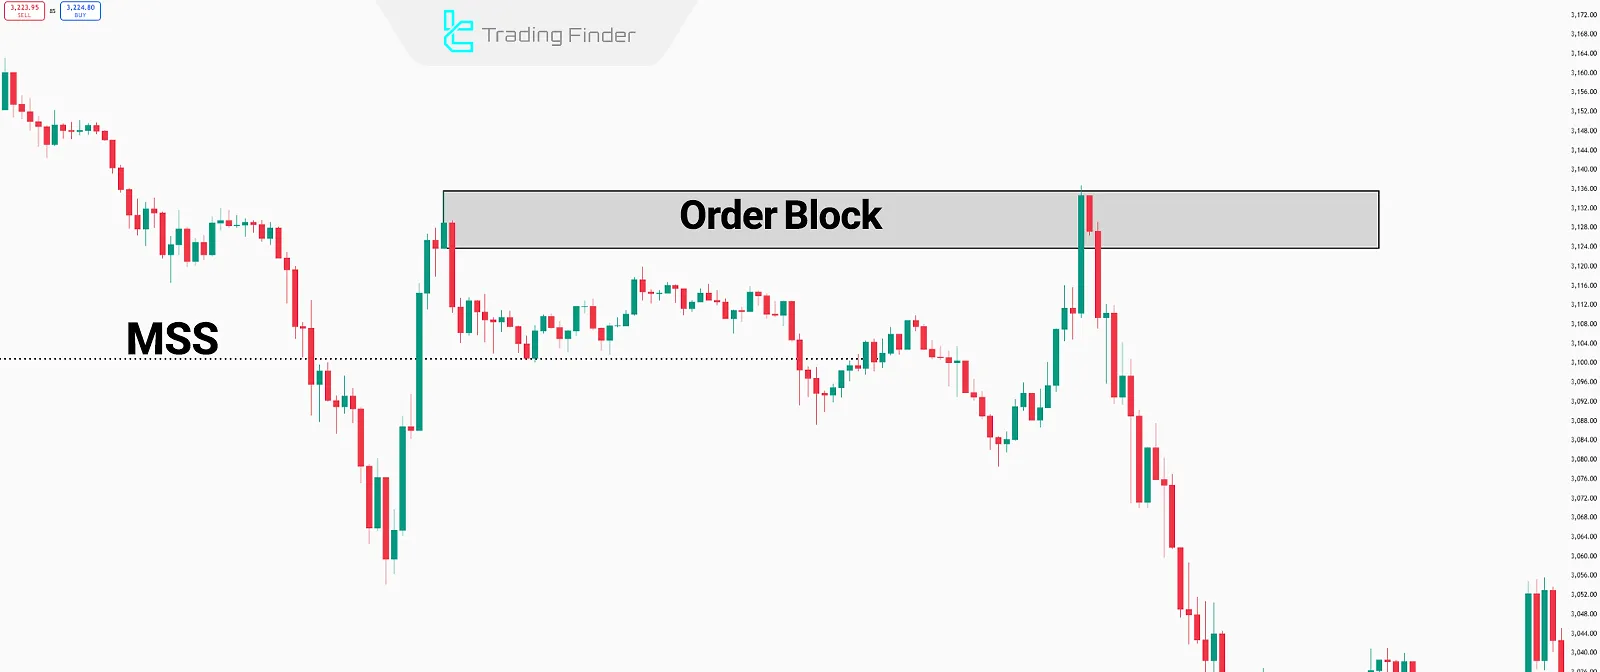
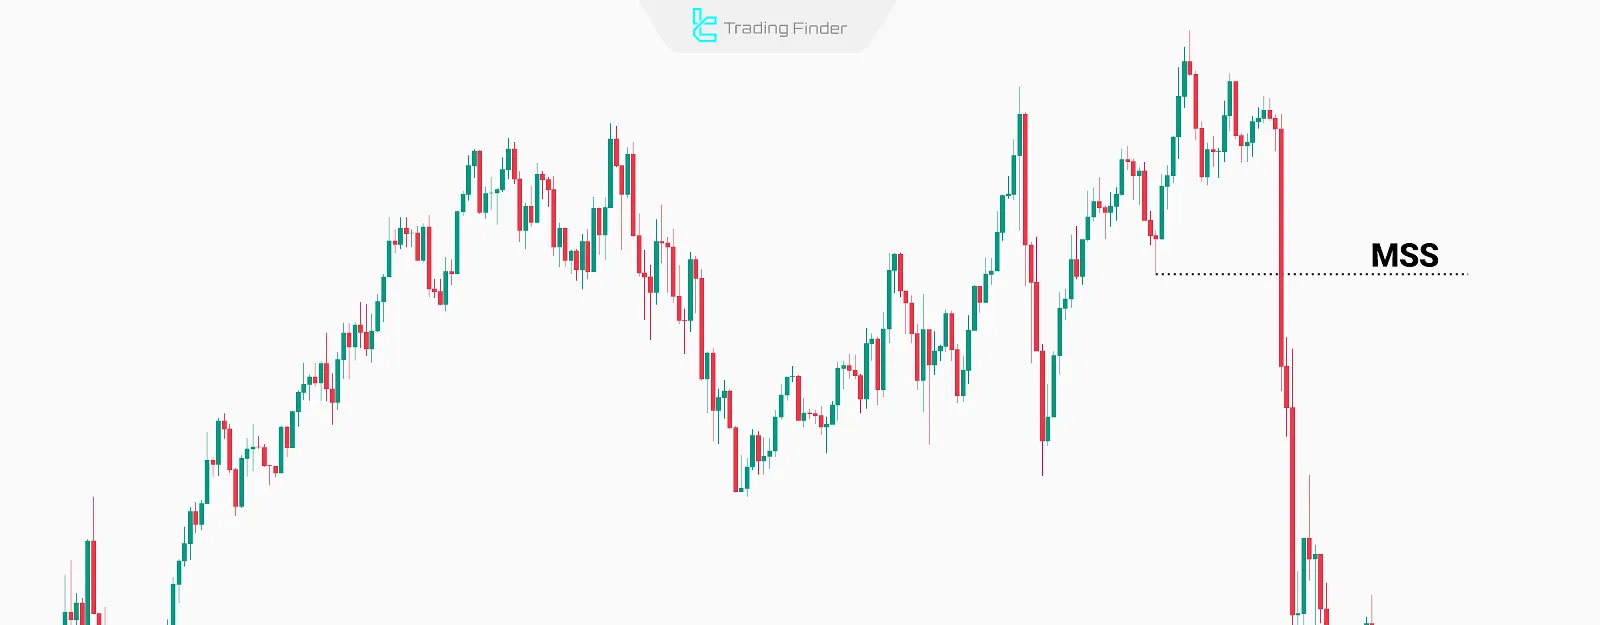
Then, by switching to a lower timeframe (LTF) such as M5, the trader looks for signs of Market Structure Shift (MSS) or the formation of an Order Block (OB).
If an FVG or Liquidity Grab is spotted in this zone, the conditions are set for a more precise buy entry, since the higher timeframe confirms the trend and the lower timeframe shows the optimal entry point.
This is exactly what timeframe trading means and is widely used during ict london session time and ict session time .
Custom Timeframes Chart Expert Advisor
The Custom Timeframes Chart Expert Advisor is a specialized tool for building non-standard charts based on Tick Data.
Unlike MetaTrader’s default timeframes, this EA can generate second-based candles (from 1 to 900 seconds) a feature not natively available on the platform and only possible through such expert advisors.
This capability is ideal for ict trading traders and those seeking to optimize their ict time frame.
This expert advisor creates a Custom Symbol within the Market Watch section, converting collected live market tick data into precise candles with four key prices (Open, High, Low, Close).
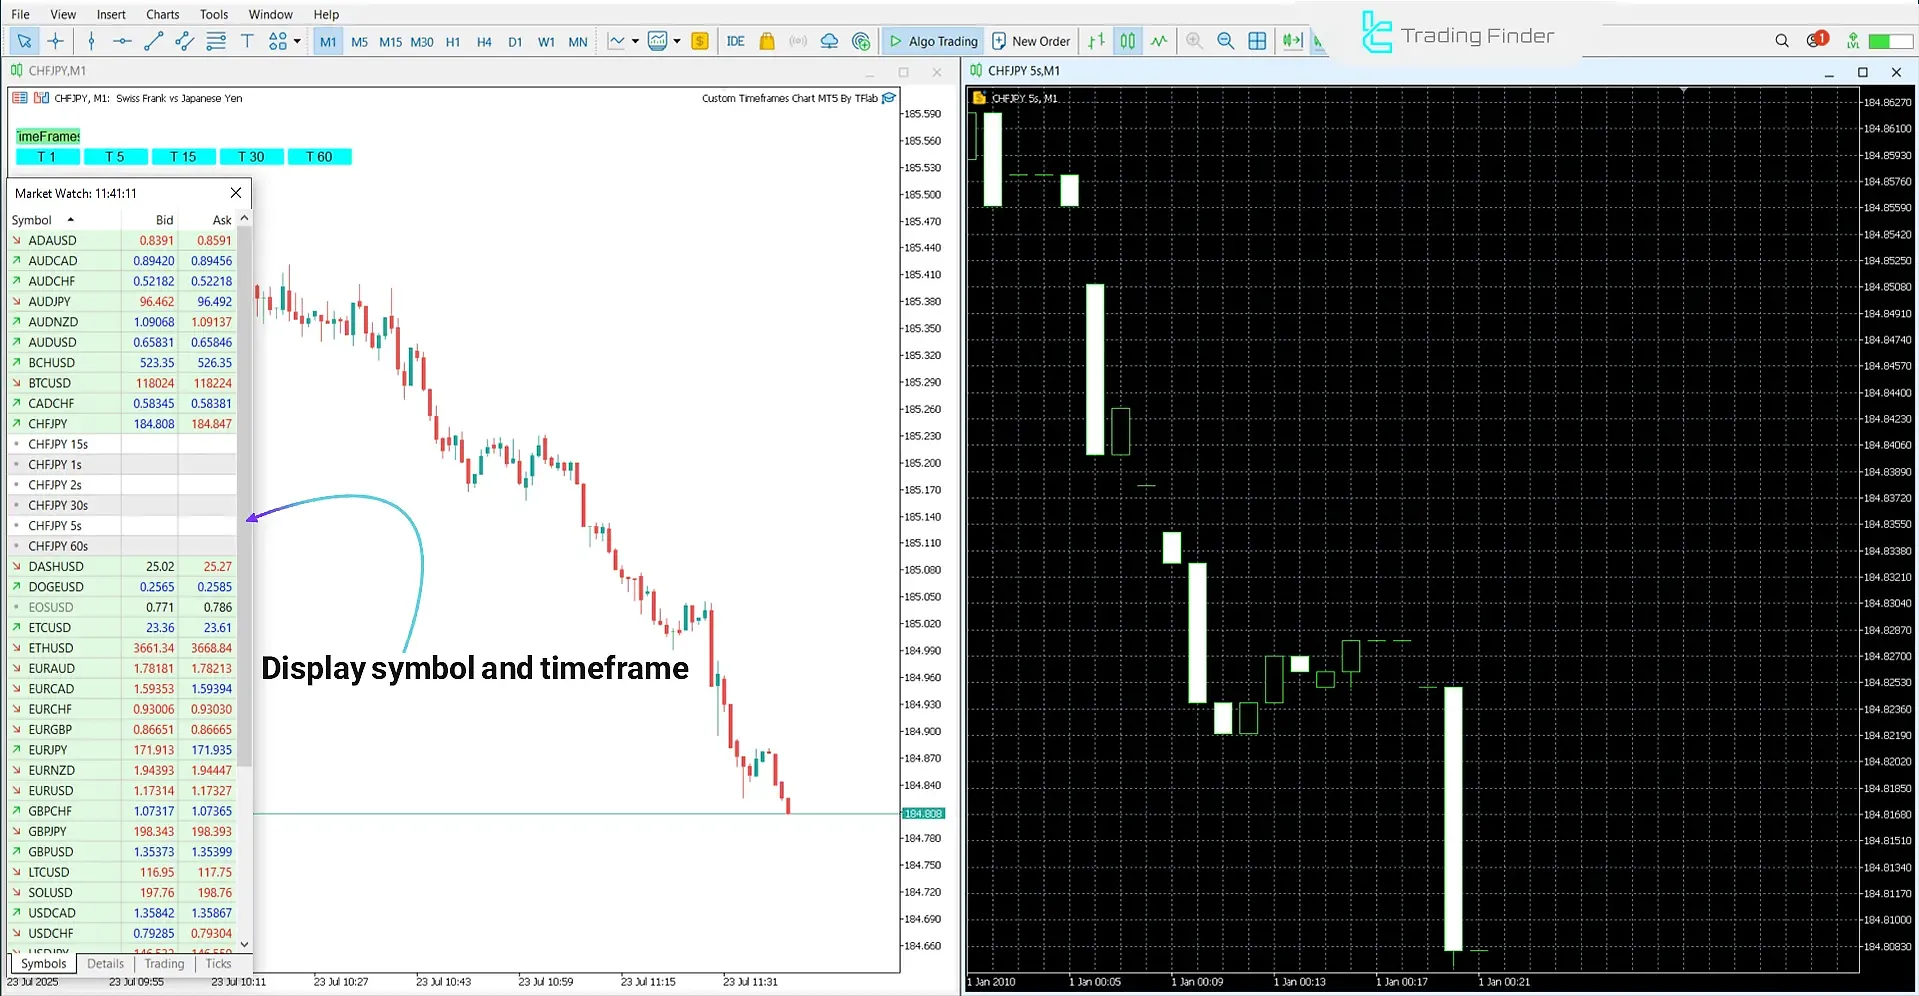
As a result, the final chart is displayed independently on the trading platform and supports simultaneous use of indicators, expert advisors, and other analytical tools.
Functionality:
- Tick Data Collection: The smallest price changes are recorded and processed;
- Custom Candle Creation: The user can define any desired timeframe such as T5 or T15 and receive precise candles;
- Custom Symbol Generation: Data is stored as a separate tradable instrument;
- Independent Chart Display: The generated chart is fully analyzable like a standard MetaTrader chart.
The main feature of this tool is its support for second-based and ultra-short-term analysis.
Therefore, it is an ideal option for strategies such as scalping, modeling price behavior in very small intervals, and performing detailed market structure studies.
It can also be used across different markets, including forex, cryptocurrency, and stocks .
Installation Steps:
- Open the Navigator from the View menu;
- In the Expert Advisors section, select the EA and attach it to a chart;
- Enter the desired custom timeframes.
After running, a control panel with scheduling buttons appears, allowing the user to generate the desired custom chart with just one click.
An important note is that the base chart’s timeframe does not affect performance, as the output is provided as a completely independent chart.
To access this feature, simply download the Custom Timeframes Chart Expert Advisor for MetaTrader 5.
Choosing Timeframe Based on Trading Sessions
In ICT style, trading sessions such as London and New York play a major role in determining timeframes.
Many key setups form within these time windows, and combining timeframes like H1, M15, and M5 during these sessions can provide more precise entry and exit conditions.
This section highlights the importance of ict trading hours and ict time sessions in decision-making.
Using this structure helps traders avoid low-quality trades during low-volatility hours and focus on the periods with the highest liquidity and trading opportunities.
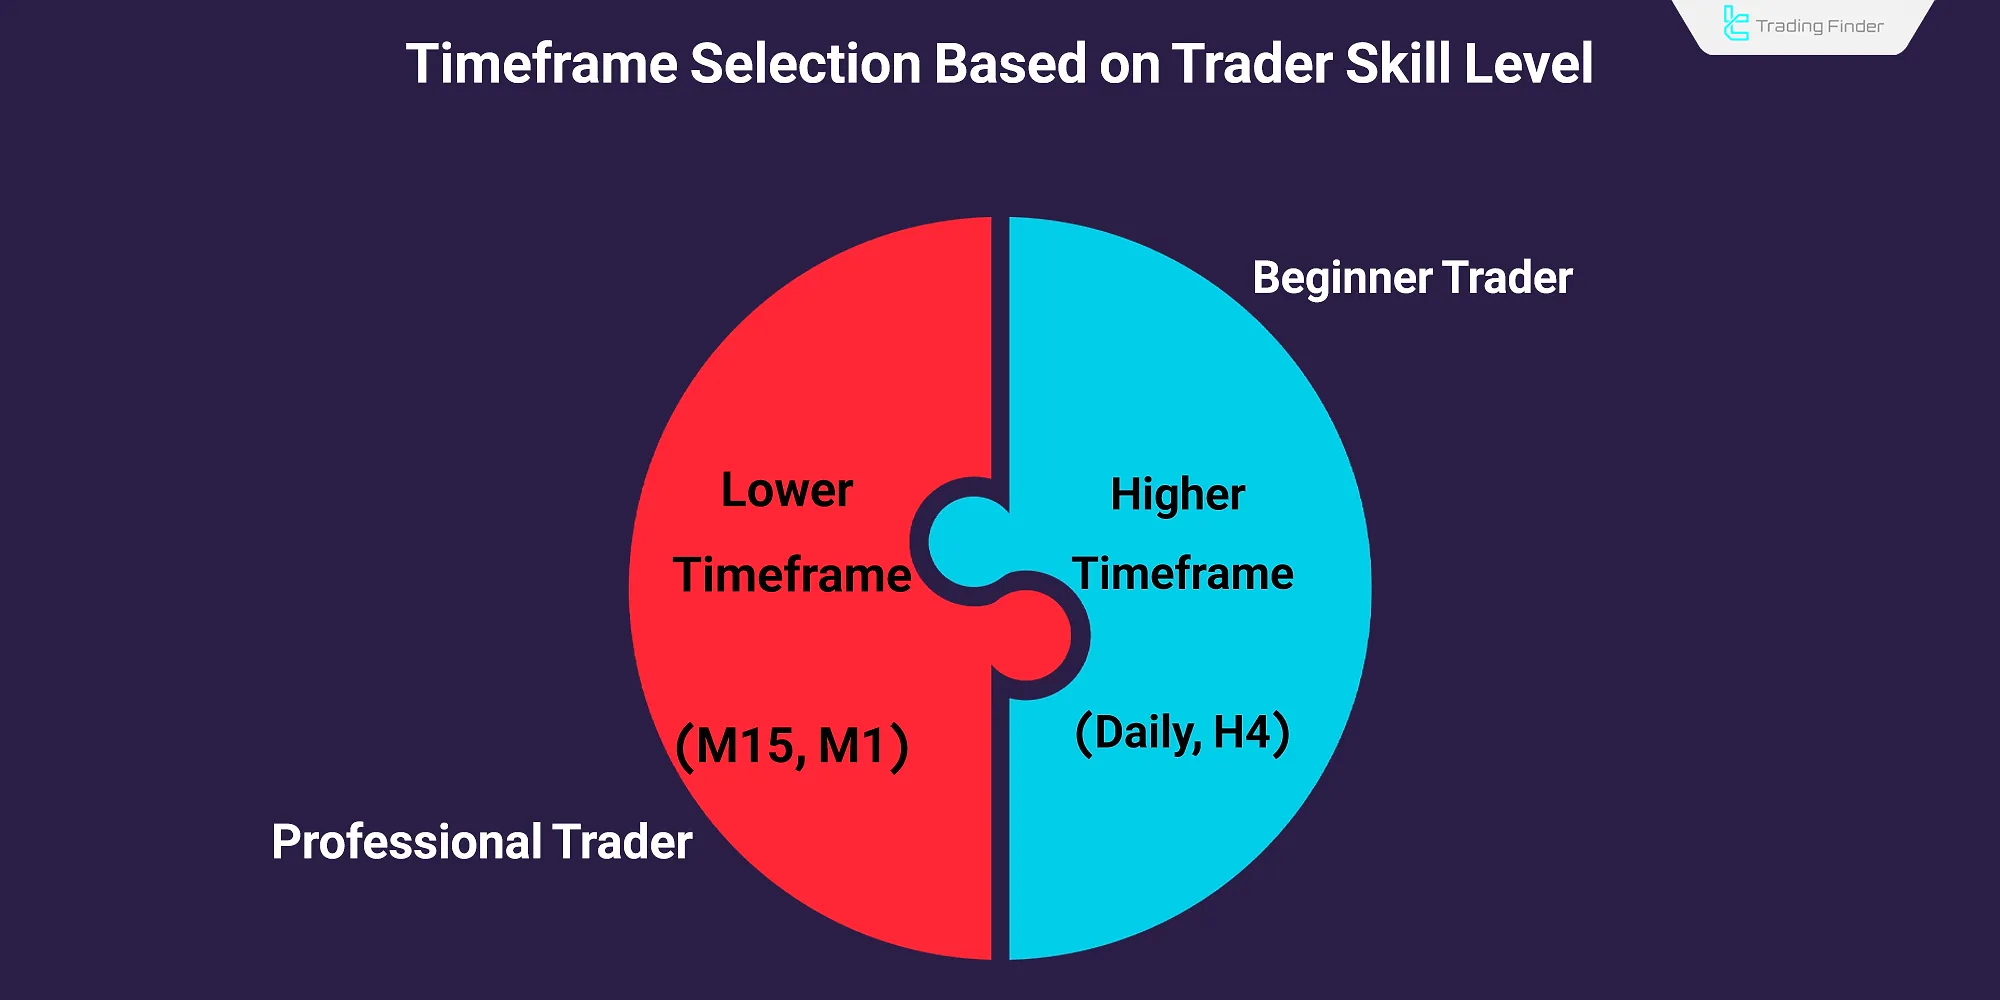
Timeframe Selection Guide for Beginners and Professionals
The trader’s level of experience is a decisive factor in selecting the timeframe. Beginner traders usually perform better on higher timeframes such as Daily (D1) or H4, since these intervals have less noise and display the overall market structure more clearly.
In contrast, professional traders, who are proficient in risk management and fast decision-making, can utilize smaller timeframes such as M5 or even M1 for precise entries and scalping.
Therefore, the trader’s skill level and experience directly impact the selection of the right timeframe, enabling them to incorporate ict killzone times and ict kill zone trading into their strategy.
The Role of Psychology in Timeframe Selection
Timeframe selection is not solely limited to the type of trading strategy the trader’s personal characteristics also play a role in this decision.
In ICT style, traders who prefer patience and holding trades for longer durations usually choose higher timeframes such as Weekly or Monthly.
Conversely, scalpers, who must make rapid decisions in shorter intervals, need strong stress management and quick reaction to market changes.
Thus, psychological factors such as risk tolerance, focus level, and emotional control are decisive in selecting the most suitable timeframe.
Conclusion
The multi-timeframe approach in ICT enables traders to analyze key levels on higher timeframes (HTF) and execute precise entries on lower timeframes (LTF).
This method is built on detecting hidden liquidity in higher timeframes and precise order management in lower ones.


