


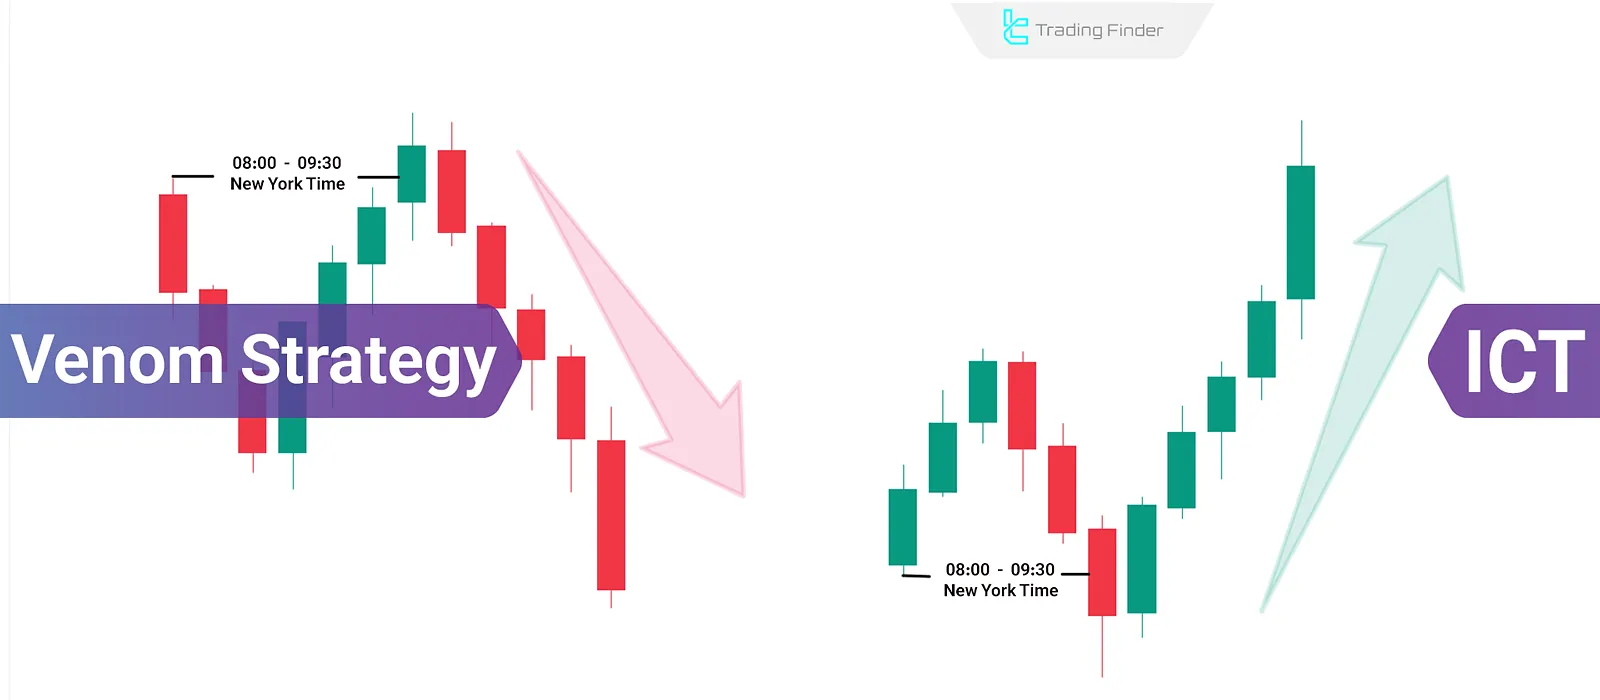
The Venom model (ICT Venom) is an advanced strategy in the ICT style, built upon three critical concepts of Liquidity, Time, and Price.
This model is specifically designed for intraday trading on US stock indices such as US100, US30, and US500 and operates based on the Liquidity Sweep + Reversal pattern.
In other words, after an initial liquidity grab, the price moves back in its original direction.
Venom focuses on identifying Market Structure, Market Shift Signals (MSS/CISD), and Fair Value Gaps (FVG). With this combination, entry and exit points can be identified accurately and timely.
What is the Venom Strategy?
TheVenom model is centered around price action during the New York session and itsinteraction with initial market liquidity.
Venom emphasizes the time window between 08:00 and 09:30 AM New York time, defining the initial range.
After the official market opens, the price typically breaks one side of this range to gatherliquidity.
If the structure is confirmed, a strong reversal in the main market direction occurs. The core ICT-based structures used in the Venom strategy include:
- Liquidity Sweep
- Fair Value Gap (FVG)
- Market Structure Shift (MSS)
- Change in State Delivery (CISD)
Training on how to use the Venom ICT model from the Writo-Finance website:

Time & Structural Logic Behind Venom (ICT)
The ICT Venom model is designed around a 90-minute window before the official New York opens.
This range, known as the Initial Balance Range, captures early price fluctuations and accumulates the market's initial liquidity.
Detecting false breakouts only allows trade entries when the price is within a valid liquidity zone and aligns with the market structure.
Venom strategy tutorial video from the FX Replay YouTube channel:
The concept of Stop Hunt in the Venom Strategy
In the ICT Venom model, stop hunts are one of the most important techniques for identifying where smart money intends to enter the market. This concept refers to price movements designed to capture the liquidity accumulated behind the stop-loss orders of retail traders.
Before the market makes its main move, it intentionally reaches into areas where many stop orders are clustered. This penetration may appear to be a break of support or resistance, but in reality, it is a phase of liquidity clearance.
In the Venom strategy, a stop hunt typically occurs at one of the two ends of the Initial Balance Range of the New York session. For example, if price consolidates within a range between 08:00 and 09:30 New York time, it may temporarily break above that range after the market opens.
This move signals liquidity collection on the buy side and often marks the beginning of the Reversal Phase.
Detecting a stop hunt in the Venom model requires the alignment of three factors:
- Time: Occurring during the liquidity window of the New York session, either just before or at the official market open;
- Market Structure: The presence of an MSS or CISD immediately after the false break;
- Key Price Levels: Occurring around FVG zones or confirmed order blocks.

Suitable Timeframes and How to Choose Them in the ICT Venom Strategy
In the ICT Venom strategy, choosing the right timeframe is crucial because the model is built on aligning time and market structure. An incorrect timeframe leads to confusion in identifying MSS, FVGs, and liquidity ranges, causing stop-hunt or reversal signals to lose reliability.
Multi-Timeframe Structure in the Venom Model
The Venom model uses a hierarchical structure in which each timeframe has a specific function:
- 1-hour and 4-hour timeframes: Used to identify the main liquidity direction and determine the daily bias. In these timeframes, valid supply and demand zones, trusted FVGs, and confirmed order blocks are identified;
- 15-minute timeframe: Used to analyze intraday market structure. This timeframe is where MSS, structure shifts, and entry triggers form;
- 5-minute and 1-minute timeframes: Used for precise entries and stop-loss placement. At this micro scale, price reactions to PD Arrays and reversal confirmations are evaluated.
Types of Venom Model in ICT
The Venom model is executed in two primary structures, both based on the initial liquidity range break and swift price reversal. However, the movement direction and entry structure vary.
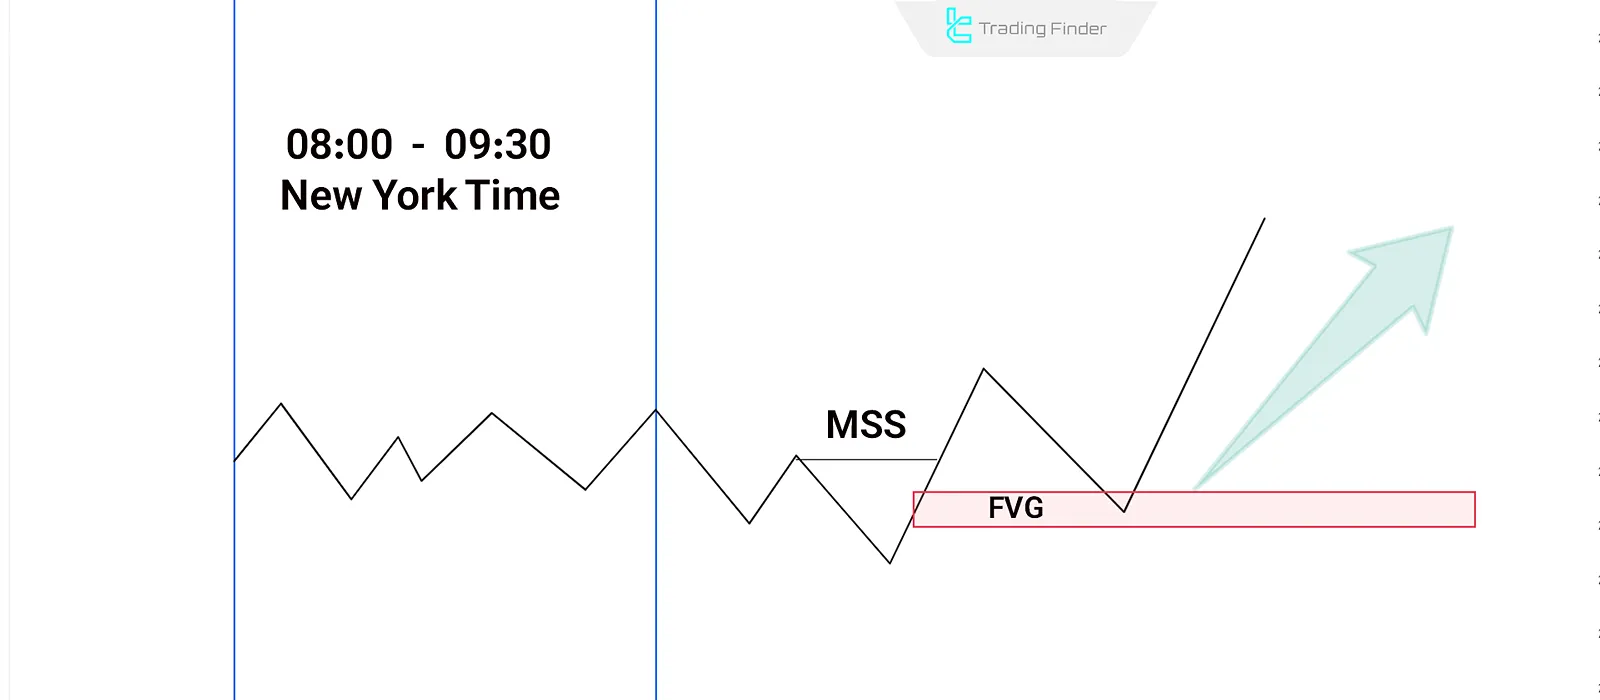
ICT Venom Bullish Model
In the bullish Venom model, the initial price range between 08:00 and 09:30 AM New York time is defined, marking the session's high and low.
After the market opens officially, if the price falsely breaks the lower boundary, it's a sign of liquidity collection on the sell side.
If followed by a market structure shift with patterns like MSS or CISD, a reversal is likely.
A suitable entry point occurs when the price returns to a demand zone or PD array. For risk management, the stop-loss is placed slightly below the false break low, with targets first at the top of the initial range and then at the day/week high.
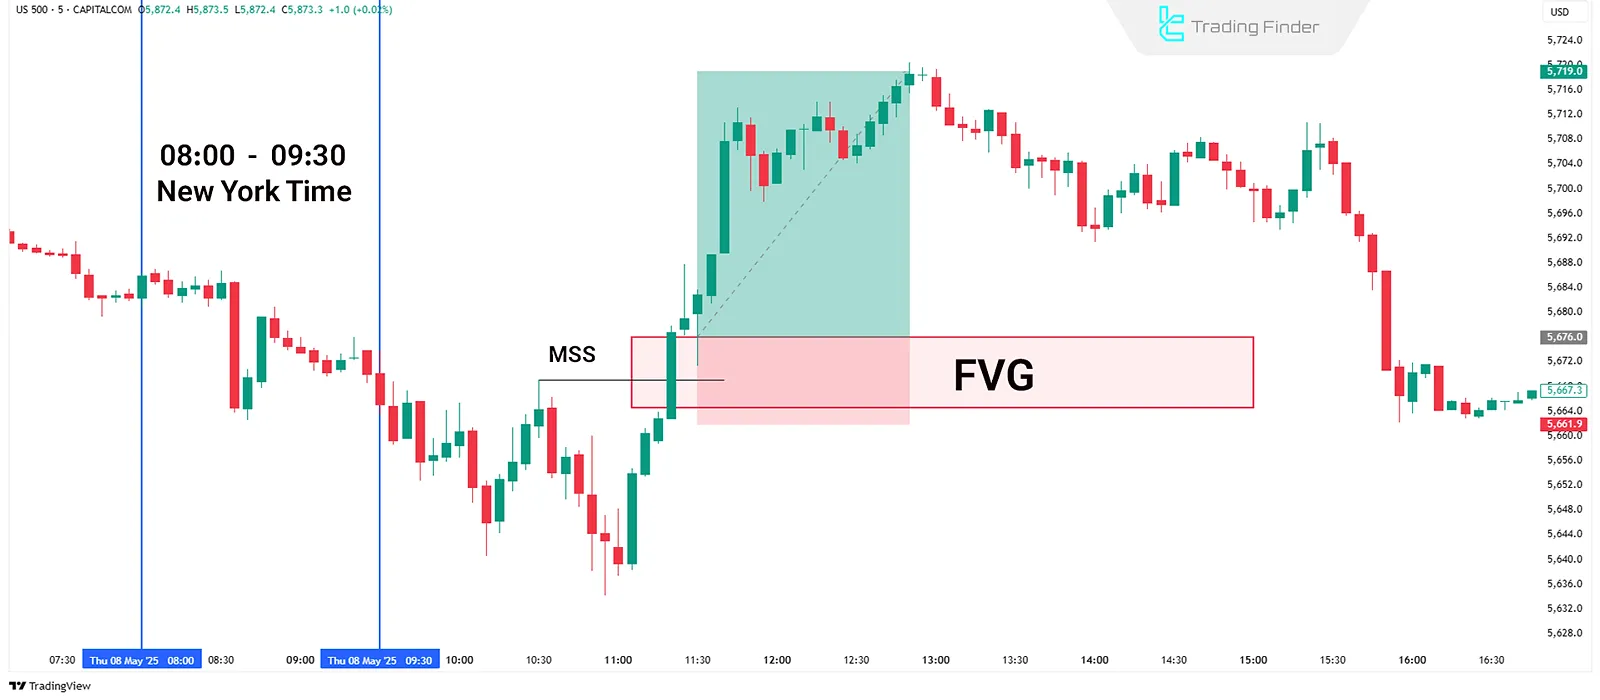
Venom Strategy Example in a Bullish Market
Based on the US500 price chart, the initial price range between 08:00 and 09:30 AM New York time is marked.
After the market opens at 09:30, the price falsely dips below the range low, indicating liquidity absorption on the sell side.
Then, with the appearance of MSS and Change in the State of Delivery, a trade entry is planned.
As seen on the chart, once the price hits the FVG zone, a long position is taken. The stop-loss is slightly below the false low, and the take-profit is set at the daily high.
ICT Venom Bearish Model
Inbearish Venom strategy, the 90-minute range between 08:00 and 09:30 AM New York time is defined, setting the high and low of that window.
After the official New York opens at 09:30, if the price moves above this range and then quickly reverses, it signals liquidity collection on the buy side.
If MSS or CISD signals appear, a bearish move is likely. An entry point forms when the price retraces to a supply zone or higher PD arrays.
In this case, stop-loss should be placed just above the liquidity range high, with targets at the range low and lower support levels.
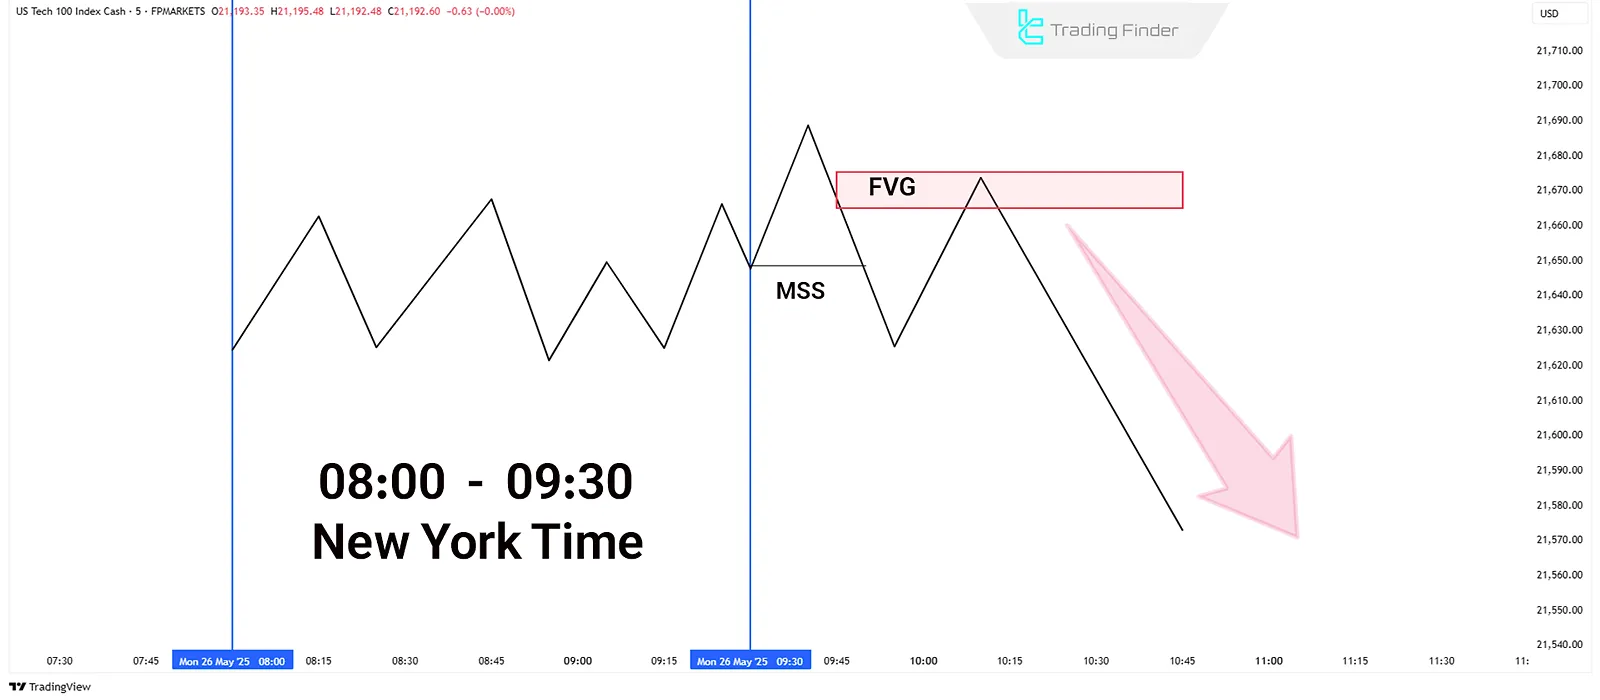
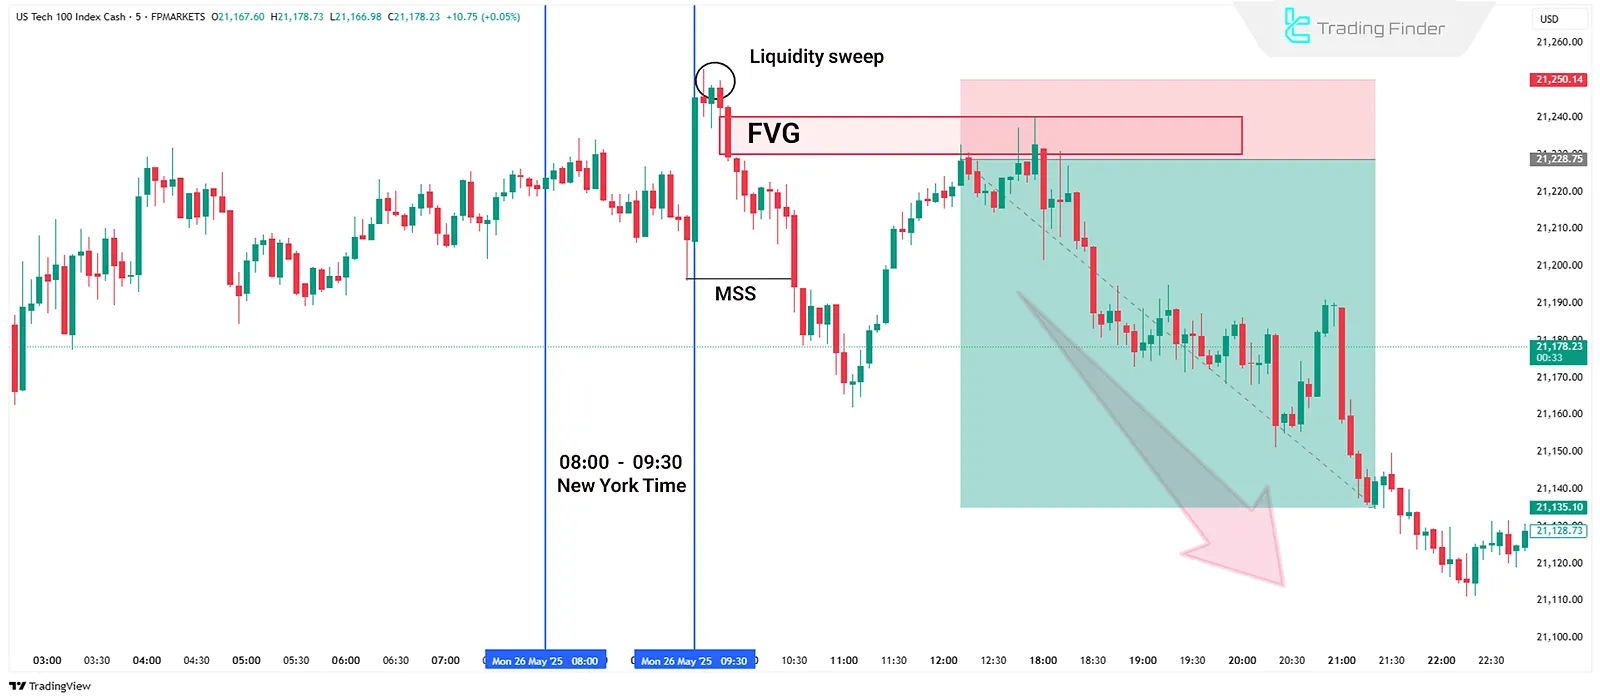
Venom Strategy Example in a Bearish Market
Based on the US100 (NASDAQ) price chart, the range from 08:00 to 09:30 AM New York time is defined as the initial price range.
After the official session opens at 09:30, the price temporarily exceeds the range high, signaling liquidity collection on the buy side.
Upon detecting MSS and reversal confirmations, a short entry is considered. Once the price corrects into the FVG zone, the trade is executed.
Stop-loss is set slightly above the high, and targets are placed at the daily low or lower support levels.
ICT Venom Strategy Indicator
The Venom indicator is built on the three core ICT components: Liquidity, Time, and Price. The purpose of this tool is to identify the Initial Balance Range of the New York market and determine precise intraday entry and exit points.
By analyzing the 08:00–09:30 New York time window, the indicator marks a zone called the Initial Balance Range with a red box. After the official market opens at 09:30, if the price breaks one of the boundaries of this range, the liquidity-grab signal becomes active.
Tutorial videos for using the Venom indicator:
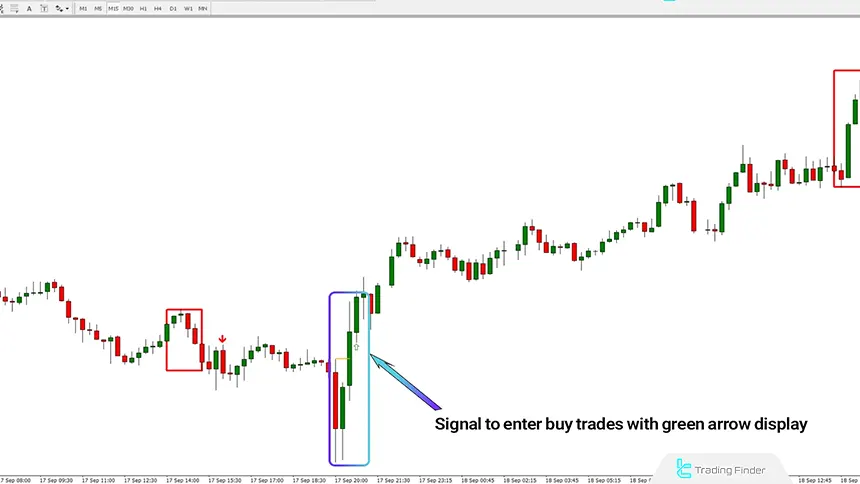
Next, the indicator combines concepts such as Market Structure Shift (MSS), Change in State of Delivery (CISD), and Fair Value Gaps (FVG) to detect a valid reversal path and display entry signals using green arrows (buy) and red arrows (sell).
This tool is specifically designed for professional traders and advanced users, and falls under the category of reversal and false-breakout indicators.
It can be used in forex, indices, commodities, stocks, and cryptocurrencies, and maintains stable analytical performance across multiple timeframes.
In an uptrend, the indicator detects the false penetration of price below the liquidity zone as a Liquidity Sweep and issues a buy signal once reversal confirmation appears.
In a downtrend, a temporary break above the range and liquidity absorption on the buy side signals entry into a bearish phase. In both cases, price reaction at FVG or Order Block zones forms the basis for the entry decision.
The Venom indicator is a precise tool for identifying false breakouts and structural market movements. By focusing on New York session timing and liquidity flow, it identifies entry and exit points with high accuracy.
Download links for the Venom indicator:
Advantages and Limitations of the Venom Strategy
Evaluating the strengths and weaknesses of Venom helps clarify its practical constraints and analytical capabilities. On one hand, its multi-layer structure provides highly accurate entries and enables controlled-risk trades with impressive risk-to-reward ratios.
On the other hand, its analytical complexity and sensitivity to timing make it challenging for beginners or low-volatility markets.Table of Advantages and Limitations:
Advantages | Limitations |
High accuracy in entry and exit points | Requires strong analytical skill and advanced experience |
Alignment with institutional liquidity | Strong dependency on the New York session |
Low risk and high reward-to-risk ratio | Few signals in low-volatility markets |
Effective multi-timeframe analysis | Risk of misidentifying stop hunts |
Can be combined with other ICT models | Requires adjustment for crypto markets |
Suitable for backtesting and quantitative modeling | Long learning curve and requires extensive practice |
Conclusion
The Venom model (ICT Venom) is a strategy based on institutional liquidity, aligning smart money entry timing with market structure to identify fake breakouts and capture valid moves.
Its focus lies in filtering true trends from false moves and analyzing key market players' behavior. Effective implementation requires technical analysis of key levels like equal highs/lows and order blocks, paired with precise timing.
This strategy serves not just as an entry method but also as a market liquidity flow analysis model during the New York session.


