


Weekly Profiles are patterns that represent typical price behavior throughout a trading week. These profiles are composed of bullish, bearish, or range-bound movements and can be used to anticipate potential market moves.
What Are Weekly Profiles? Exploring ICT Weekly Profiles
ICT (Inner Circle Trader) Weekly Profiles refer to recurring price behavior patterns observed during the trading week.
While these profiles do not provide precise predictions, they offer a framework to better understand overall market trends.
To use this model, you need to be proficient in Premium and Discount concepts.
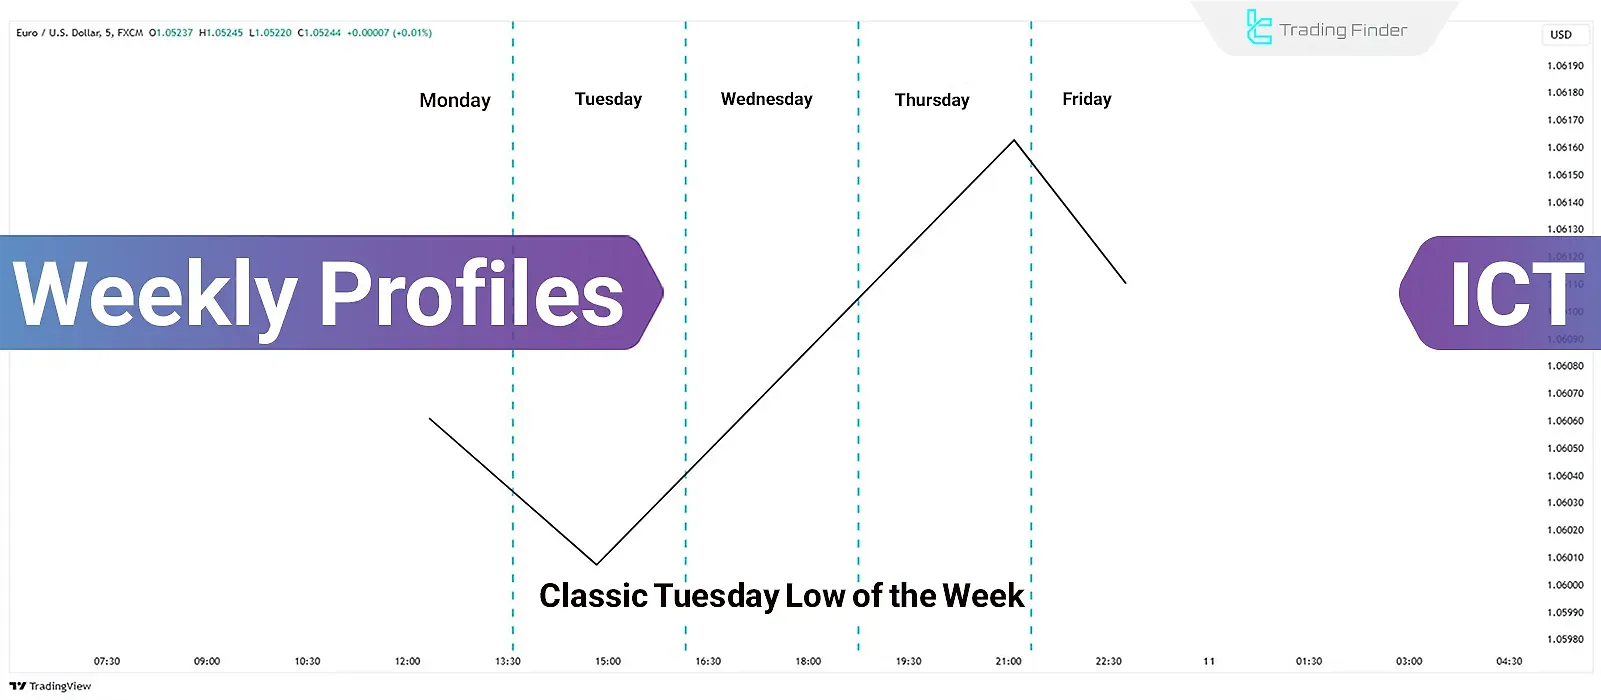
Classic Tuesday Low of the Week
In bullish trends, prices may experience manipulation on Monday and remain above the discount level on higher timeframes. This is often followed by a price drop on Tuesday, forming the weekly low.
If this drop does not occur on Monday and fails to reach the discount level, the move typically happens on Tuesday during the London or New York sessions.
Classic Tuesday High of the Week
In bearish trends, prices are subject to volatility on Monday, staying below the premium level on higher timeframes. On Tuesday, prices often move toward the premium level, forming the weekly high.
If no upward movement occurs on Monday, the weekly high usually forms on Tuesday during the London or New York sessions.

Wednesday Low of the Week
In bullish conditions, prices typically fluctuate on Monday and Tuesday, staying above the discount level on higher timeframes. Prices drop to the discount level by Wednesday, forming the weekly low.
If this drop doesn’t happen on Monday or Tuesday, the low might be set on Wednesday during the London or New York sessions.

Wednesday High of the Week
In bearish conditions, prices on Monday and Tuesday may be manipulated to fluctuate below the premium level on higher timeframes.
Prices rise to the premium level by Wednesday, forming the weekly high. If this upward movement doesn’t occur on Monday or Tuesday, the high will likely to form on Wednesday during the London or New York sessions.

Consolidation Thursday Bullish Reversal
In bullish trends, prices might consolidate from Monday to Wednesday. After forming the weekly low, prices rebound upward.
To understand this pattern, identify discount levels on higher timeframes.
If prices fail to reach these levels earlier, a potential drop may occur on Thursday, coinciding with economic news or interest rate announcements near the end of the New York session.

Consolidation Thursday Bearish Reversal
In bearish trends, prices might consolidate from Monday to Wednesday within a defined range; After breaching the weekly high, price will turn into downward.
To detect this, focus on premium levels on higher timeframes. If these levels aren’t reached earlier, a possible price increase on Thursday might precede a drop, typically triggered by news events or interest rate decisions in the late New York session.

Consolidation Midweek Rally
In bullish markets, prices consolidate from Monday to Wednesday, then breach the weekly high and continue upward until Friday.
If prices fail to reach the premium level or break past the discount level, they are likely poised to rise toward the premium level and continue their rally.

Consolidation Midweek Decline
In bearish markets, prices consolidate from Monday to Wednesday, followed by further declines until Friday after reaching the weekly low.
If prices drop from the premium level without hitting the discount level and lack signs of a bullish reversal, this indicates continued downward momentum toward the discount level on higher timeframes.

Seek and Destroy Bullish Friday
The market may consolidate from Monday to Thursday in bullish trends, activating small stops above and below the weekly highs.
Prices then breach the weekly high and continue rising until Friday.
This pattern often occurs when the market awaits interest rate announcements or employment reports, typically during summer months.

Neutral-Low Probability Profile
The price will likely remain neutral from Monday to Thursday in range markets, activating small stops above and below weekly highs.
Then, price will move toward the weekly low andcontinue declining until Friday.
This behavior often happens when the market awaits key events like interest rate announcements or employment reports.

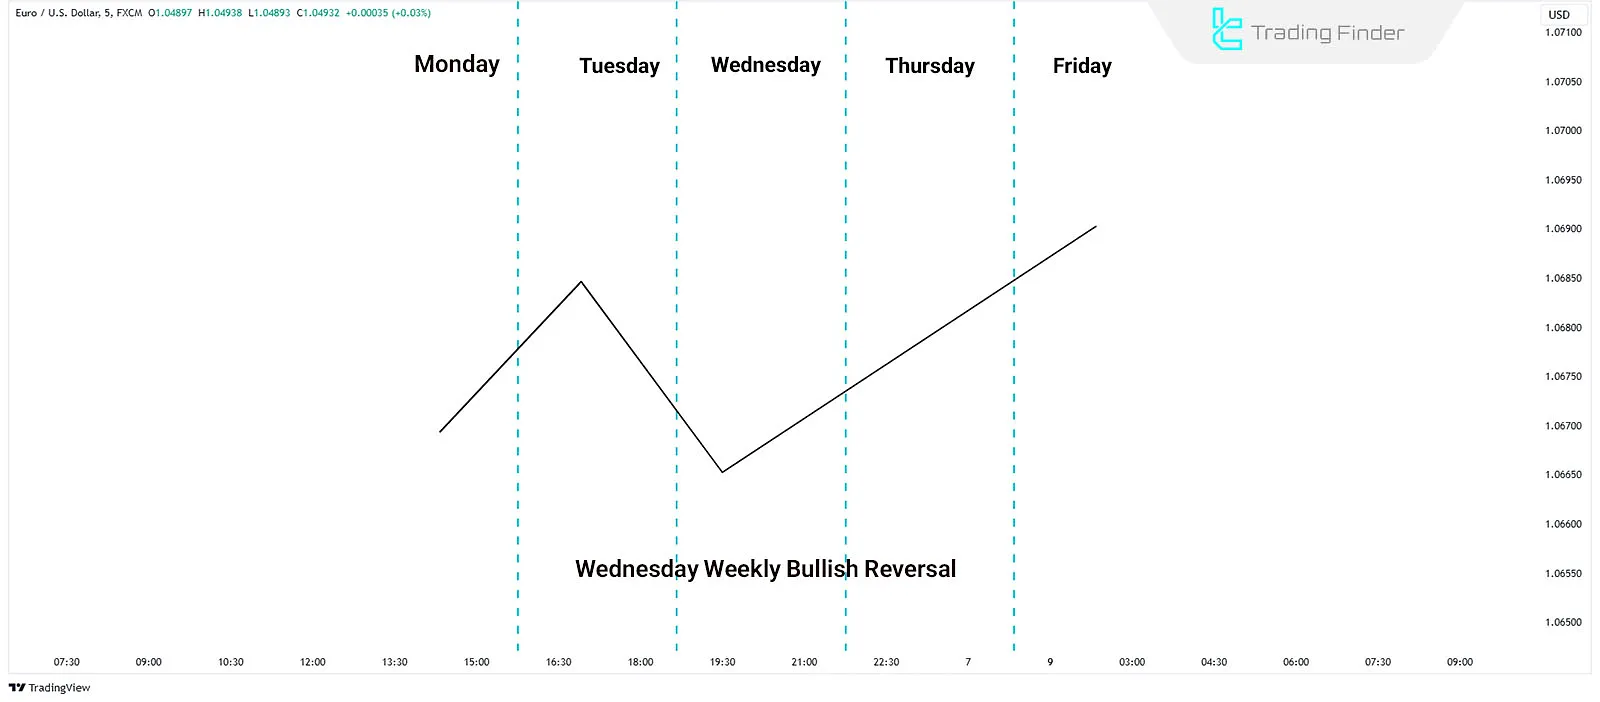
Wednesday Weekly Bullish Reversal
In this pattern, the market consolidates from Monday to Tuesday. By Wednesday, price will drop to the discount level, activating sell stops before quickly rebounding and initiating a strong bullish move.
This scenario occurs when the market approaches significant long-term or mid-term lows, where institutional buying combines with selling liquidity to trigger upward momentum.
Wednesday Weekly Bearish Reversal
In bearish trends, prices may consolidate from Monday to Tuesday. On Wednesday, they rise toward the premium level on higher timeframes to activate buy stops.
This rise creates an opportunity for institutional selling, leading to a strong bearish reversal.

Conclusion
Weekly Profiles (Master ICT Weekly Profiles) are frameworks for identifying price movement patterns throughout a trading week.
These profiles include scenarios like bullish and bearish trends, midweek reversals, and consolidations.
By analyzing these profiles, traders can predict weekly highs and lows based on price behavior during specific days (e.g., Monday to Wednesday).


