


Impulse Wave Elliott (also called Elliott impulse waves) represent the basic structure of price movement in the market and act as a powerful tool for predicting future price trends. Using these waves as part of a trading strategy in technical analysis enables traders to identify entry and exit points with greater accuracy.
These waves, by depicting the market’s energy and momentum of movement, provide a more precise analysis of the phases of trend development and correction.
Distinguishing between regular impulse waves and terminal or diagonal impulse waves enables the analyst to identify the end of a trend or the beginning of a corrective phase with greater accuracy and confidence.
What are Impulse Waves?
impulse wave elliott illustrate the main structure of price movement in the direction of the dominant market trend. These waves play a key role in identifying phases of price increase or decrease and form the foundation of many traders’ analysis.
The five-wave impulse structures follow specific rules. By recognizing them correctly and combining with support and resistance or Fibonacci levels, traders can capture high risk-to-reward opportunities.
Types of Impulse Waves
Elliott wave impulse patterns consist of 5 sub-waves and are divided into two main types:
- Terminal Impulse Wave
- Standard (Trending) Impulse Wave
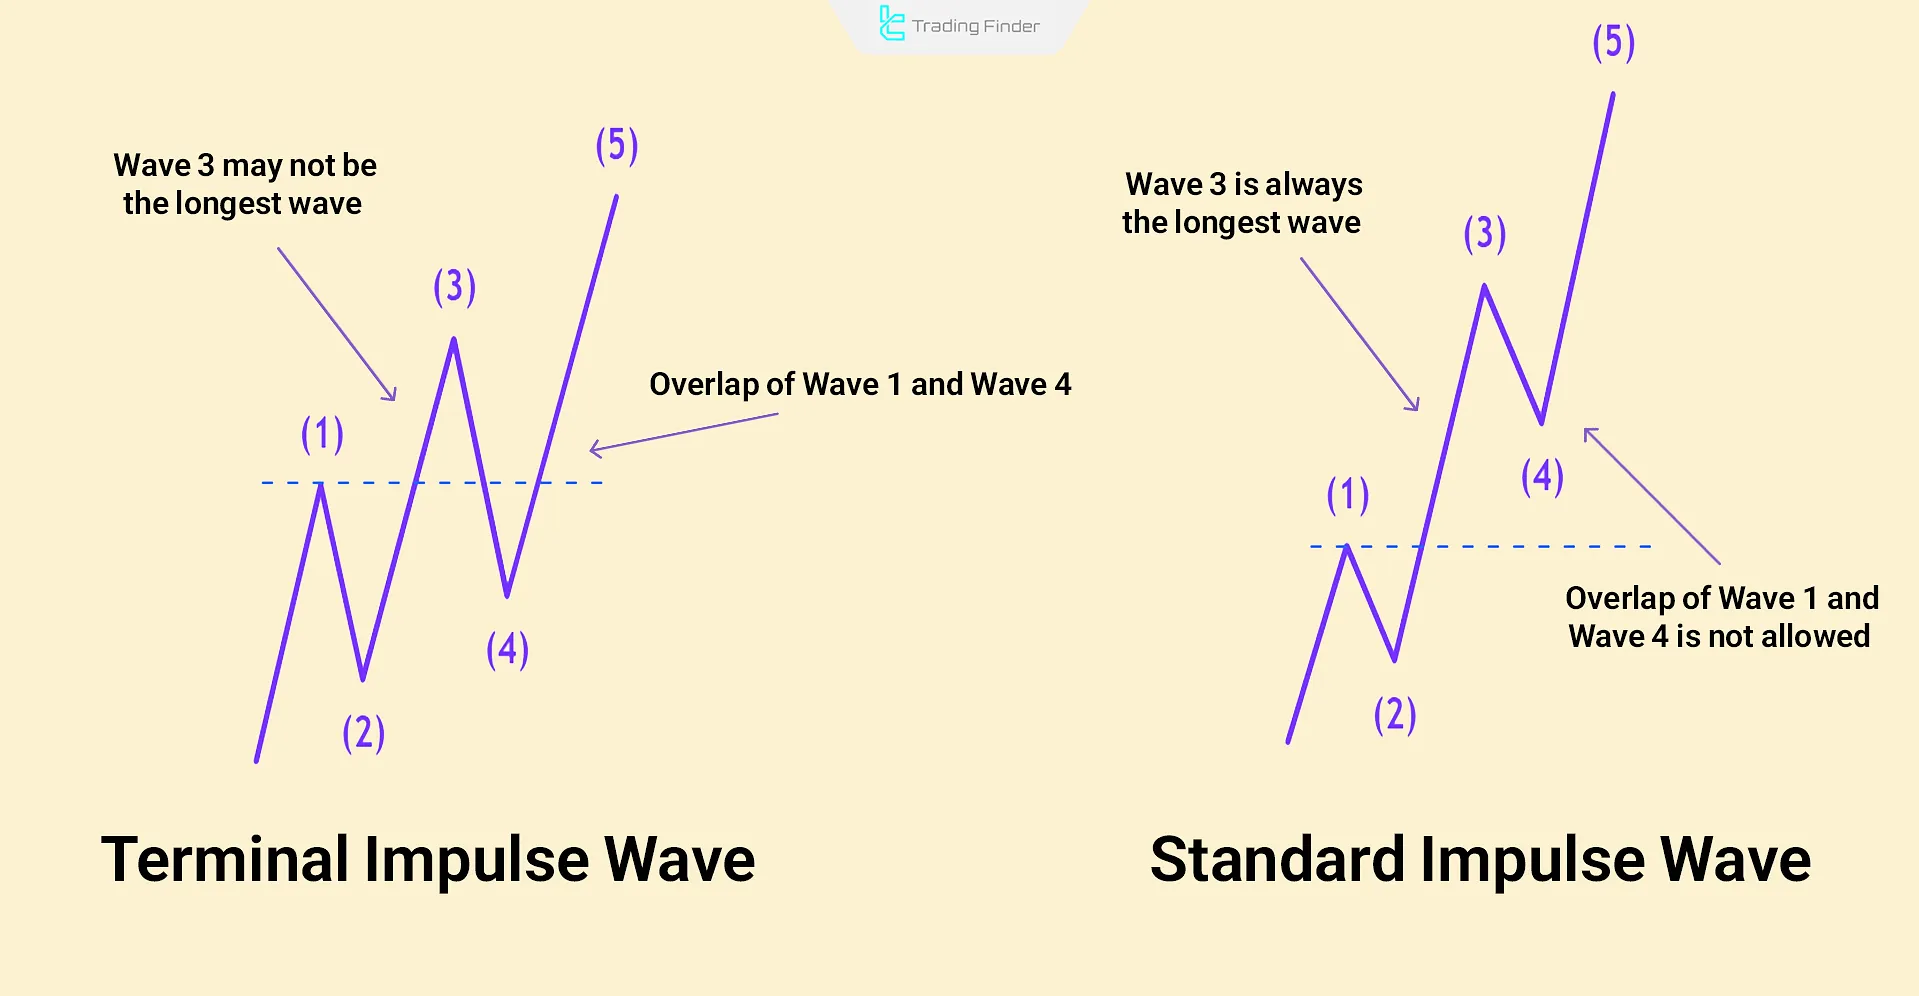
Differences Between Terminal and Standard Impulse Waves
Both terminal and standard impulse wave elliott belong to the category of leading or driving waves. However, the most notable difference lies in the behavior of wave 4.
If wave 4 does not enter the territory of wave 2 and begins before wave 5 is reached, the impulse wave in question is classified as terminal; Otherwise, it is considered standard.
In the following, we will examine the differences between terminal and standard elliott wave impulse patterns.
Differences Between Terminal Impulse Waves and Standard Impulse Waves:
Feature | Terminal Impulse | Standard Impulse |
Structure | May appear as zigzag (5-3-5 substructure) | Usually one flat/sideways and the other zigzag |
Corrective Waves (2 & 4) | With overlap | Without overlap |
Wave 1 & 4 Overlap | Possible overlapping | No overlap |
Wave 3 | Can be the shortest | Never the shortest |
Location in Trend | Appears at the end of main wave or corrective wave C | Appears in waves 1, 3, or 5 of the main trend |
Market Behavior | End of a strong trend; often with divergence and weakening momentum | Continuation of main trend; strong with higher volume |
Chart Appearance | Dense, diagonal, with slower progression | Strong, clear, directional without overlaps |
Method for Identifying Terminal and Trending Waves on the Chart
To distinguish between terminal impulse waves and standard impulse waves in Elliott Wave Analysis, a set of precise structural rules must be observed.
These principles allow the analyst to identify the type of movement with high accuracy and prevent errors in pattern interpretation.
The rules for differentiating these two types of impulse are as follows:
- If the extension of the connecting line between the peaks of waves 1 and 3 intersects with the end of wave 5, the structure falls into the category of terminal waves;
- If these lines do not intersect with wave 5, the pattern is considered a standard impulse (Standard Impulse);
- In terminal waves, waves 1, 3, and 5 usually have a diagonal structure, whereas in the standard type, these waves are of a standard motive nature;
- Overlap between waves 1 and 4 is permitted in a terminal impulse; however, in a standard structure, such an overlap invalidates the pattern.
Observing these rules creates a clear analytical boundary between terminal and standard structures and serves as a foundation for identifying terminal or continuation phases of a trend in wave analysis.
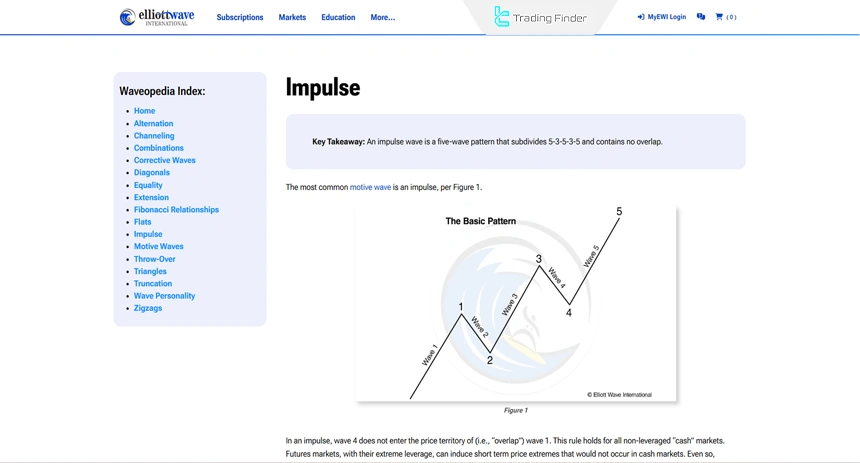
For further review and more detailed information on impulse waves, one may refer to the Elliott impulse waves educational article on the elliottwave.com website.
Applications of Impulse Waves in Trading Strategies
The application of impulse waves in trading strategies involves, in a specialized manner, a set of analytical principles used to determine trend direction, entry and exit points, and risk management.
These structures play a key role in trading decision-making as the core pillar of Elliott Wave Analysis.
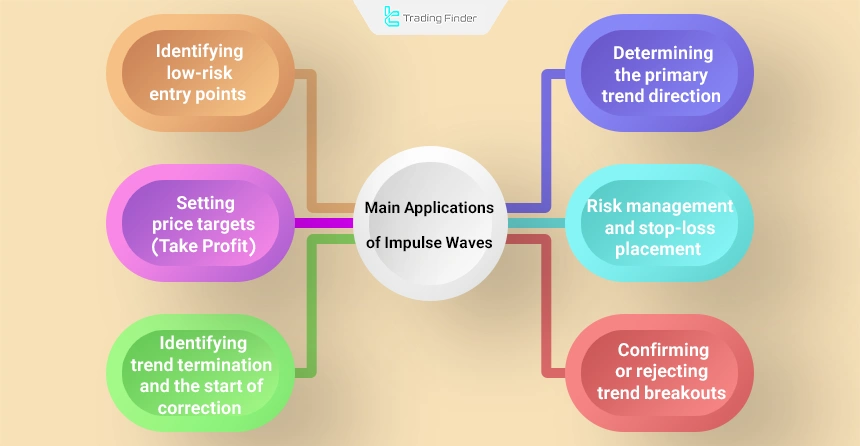
The main applications of impulse waves include:
- Determining the primary trend direction: An impulse wave represents the dominant market path and serves as the basis for entering trades in the direction of the main price movement;
- Identifying low-risk entry points: After the completion of wave 2 or wave 4, the beginning of wave 3 or wave 5 represents the optimal entry zone, as these waves usually exhibit the strongest price momentum;
- Setting price targets (Take Profit): Fibonacci ratios are used within the wave structure to estimate the termination of wave 3 or wave 5;
- Risk management and stop-loss placement: The low of wave 1 or the end of the previous wave is considered the invalidation level;
- Trend breakout validation: The formation of an impulse wave in the direction of the breakout strengthens the credibility of the new trend and helps prevent false breakouts;
- Identifying trend termination and the start of correction: The coincidence of the end of wave 5 with divergence in momentum indicators is considered a signal for the initiation of the ABC corrective pattern.
Rules of Impulse Waves in Elliott Theory
To identify and confirm a structure as an impulse wave in Elliott Wave Theory, adherence to a set of structural rules is essential.
These rules form the basis for distinguishing between motive and corrective patterns, and any deviation from them results in the invalidation of the pattern.
The main rules of an impulse wave are as follows:
- Wave 1: Start of price movement in a new trend direction;
- Wave 2: Partial retracement of wave 1;
- Wave 3: The strongest and longest wave with the highest volume and momentum;
- Wave 4: Correction of wave 3;
- Wave 5: Final movement in the main trend, sometimes accompanied by divergence.
Identifying Elliott Impulse Waves on Price Charts
Identifying elliott impulse wave on charts is a key skill in technical analysis. The first step is to determine the main trend, usually by looking at higher time frames.
Then, look for price patterns with 5 waves in the trend direction and 3 waves against it. Correct recognition and interpretation require deep understanding of price dynamics and precise chart analysis.
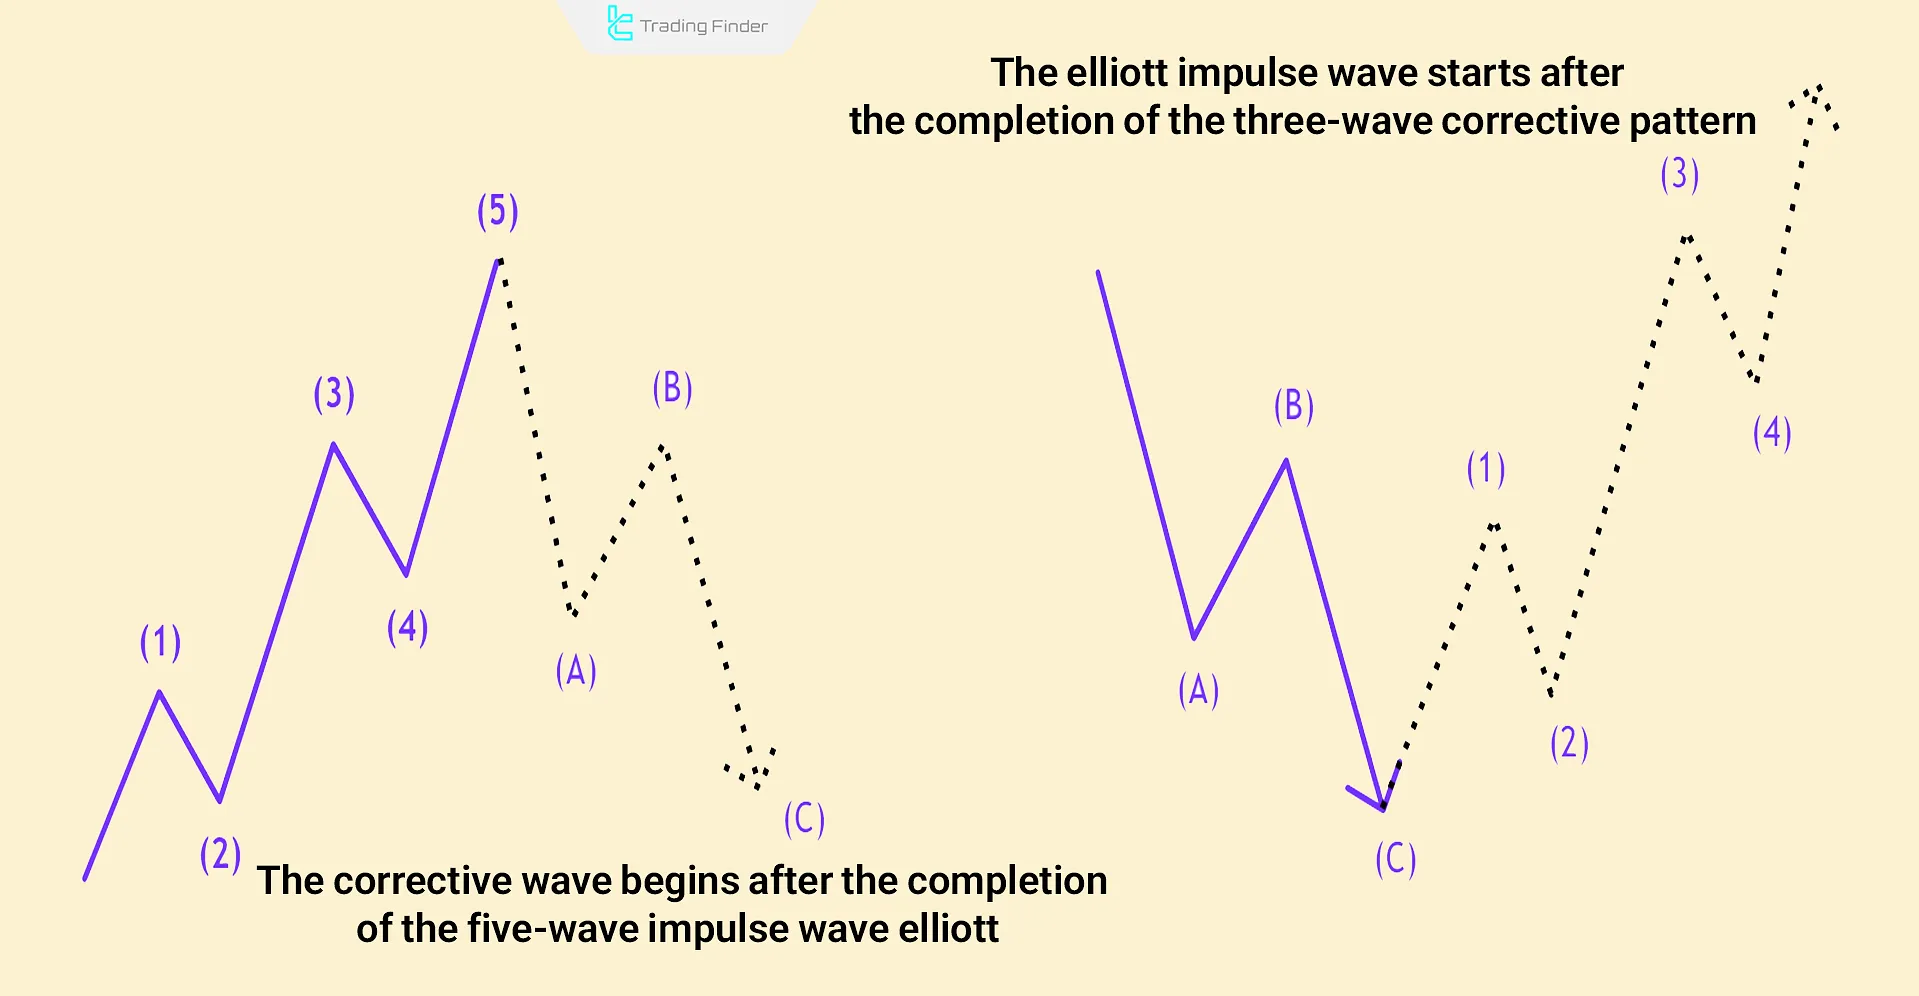
Note: To anticipate future price moves, recognize the completed impulse waves and corrective waves. For example, after the end of corrective waves, a five-wave impulse sequence begins.
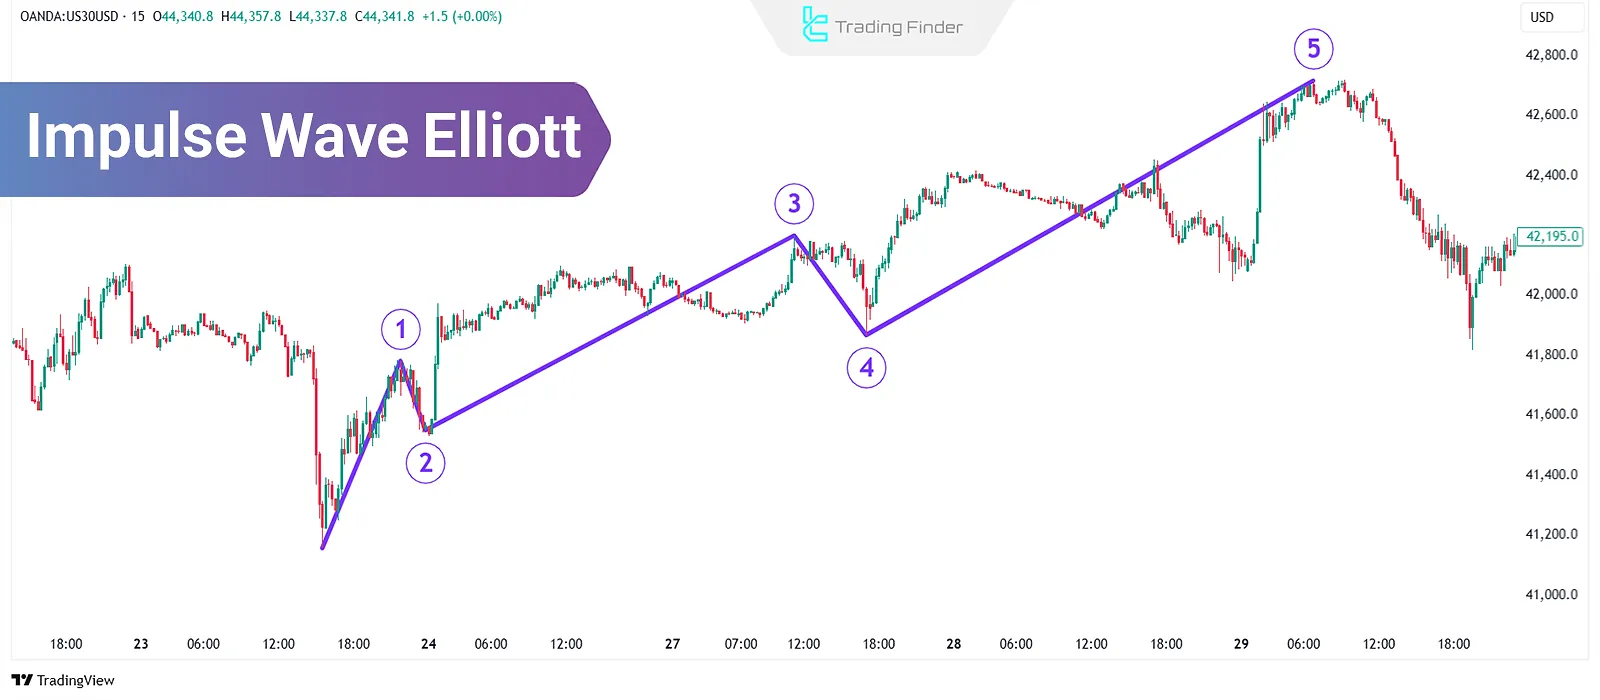
Example of Identifying Impulse Waves
On the gold chart (XAU/USD), from early to mid-October 2025, a bullish five-wave impulse structure formed.
Wave 1 began with a breakout above the previous high and a new peak around $3,960 on October 6, 2025, followed by a brief corrective move in wave 2 and a strong surge in wave 3 toward the $4,380 level in mid-October.
Wave 4 then unfolded as a sideways correction, and wave 5 completed the final upward movement before the broader correction began.
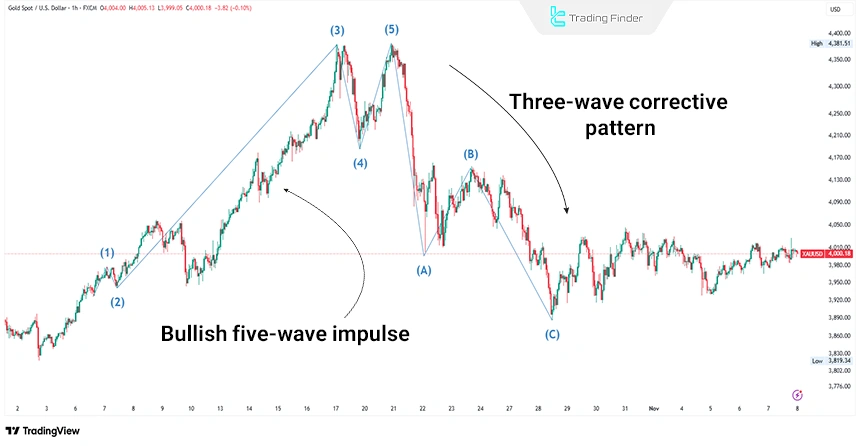
After the completion of this structure, the market entered a three-wave correction (A-B-C Correction) and on November 6, 2025, it even traded below the $4,000 level.
This example shows that by analyzing the trend on a higher time frame and identifying the end of corrective phases, the starting point of subsequent impulse waves can be identified with greater accuracy.
Advantages and Disadvantages of Using Elliott Impulse Waves
In the following, we will address the advantages and disadvantages of using Elliott impulse waves or leading waves:
Advantages | Disadvantages |
Identifies the main market trend | Wave counting is complex and requires expertise |
Provides understanding of core Elliott structure | Potential for multiple interpretations among analysts |
Enables Fibonacci ratio targeting | High dependence on technical confirmations |
Can be combined with indicators to enhance accuracy | High risk if wave endings are misidentified |
Applicable across multiple time frames | Possibility of incomplete fifth wave |
Common Errors in Counting Impulse Waves
In Elliott Wave Analysis, recurring errors can invalidate the entire analysis. The most common mistakes in counting impulse waves include:
- Misinterpreting corrective waves as an impulse wave; while sharp corrective movements such as a zigzag are sometimes mistaken for wave 3;
- Ignoring overlap between waves 1 and 4, which represents clear signs of an error in structure identification;
- Neglecting the principle of alternation, as waves 2 and 4 within an impulse usually differ in terms of structure and complexity;
- Analyzing solely on lower time frames without confirmation from higher time frames, which leads to misinterpretation of the primary market path;
- Lacking a recount plan after rule violations, whereas in such conditions the wave count must be immediately reviewed.
In an educational video on the Elliott Wave International YouTube channel, further details regarding impulse waves are discussed, which interested readers can refer to.
Confirmation of Impulse Waves Using Indicators and Trading Volume
Combining wave analysis with technical indicators is a method for increasing accuracy in identifying impulse waves.
Each indicator, by providing specific signals, confirms the wave structure and highlights key trend areas. The indicators used to confirm impulse waves are listed in the table below:
Indicator | Wave 3 | Wave 5 | Key signal | Interpretation |
Volume | Significant volume increase; smart money inflow | Relative volume decrease | Volume decline in wave 5 = trend weakness | High volume in wave 3 confirms the trend; low volume in wave 5 signals a potential reversal |
RSI | Higher than wave 1; buyer strength | Lower peak; negative divergence | RSI divergence signals reversal | Rising RSI = strong trend, divergence = trend weakness |
MACD | Strong first peak; high momentum | Lower second peak; bearish divergence | Negative divergence = structural weakness | Wave 3 is impulsive, wave 5 has lower momentum |
Moving average (MA) | Break and hold above MA50; start of acceleration phase | Possible return to MA; reduced momentum | Positive cross in wave 3, negative in wave 5 | Confirms entry and exit from waves |
Elliott Wave Indicator in MetaTrader
The Elliott Wave Indicator is one of the advanced analytical tools in the MetaTrader platform that enables professional traders to examine the structure of market price movements based on Elliott Wave Theory.
This indicator, through automatic wave counting, identifies market movement patterns in the form of motive and corrective waves and displays them graphically on the chart.
In technical analysis, Elliott waves are considered one of the most accurate methods for forecasting future market behavior.
By identifying waves 1 to 5 and corrective patterns such as ABC or combined ABCDE, this indicator allows the trader to more clearly recognize reversal points and probable trend directions.
It is also possible to adjust parameters such as Depth, Shift, Show Lines, and wave color schemes (ABC, ABCDE, 12345) within the MetaTrader environment, enabling the analyst to filter and observe structures according to their trading style.
The specialized features of the Elliott wave indicator include:
- Automatic identification of motive and corrective waves based on the principles of Elliott theory;
- Support for multi-timeframe analysis to align wave degrees across different time frames;
- The ability to adjust analysis depth, wave shifting, and connecting lines to enhance visual and analytical accuracy;
- Full compatibility with Forex, stocks, indices, and cryptocurrencies;
- Classification within the group of price action indicators and reversal indicators in MetaTrader.
In a practical example, on a 30-minute chart of a currency pair, the indicator identifies an ABCDE corrective pattern and issues a buy entry signal after the completion of wave E.
In contrast, on a 15-minute chart of another currency pair, the identification of an ABC corrective pattern signals the beginning of a bearish trend.
This level of accuracy in identifying wave structures has made the Elliott wave indicator a widely used tool among scalpers and day traders.
Overall, the Elliott wave indicator is considered one of the most intelligent analytical tools for understanding the market’s price structure.
Combining it with tools such as a Fibonacci calculator or an economic calendar increases decision-making accuracy and the efficiency of trading strategies. Using this indicator in MetaTrader enables traders to base their decisions on precise wave counting and actual price behavior.
Combining Impulse Waves With Multi-Timeframe Structures
Combining impulse waves with multi-timeframe structures in Elliott Wave Theory refers to aligning wave degrees across time frames in order to achieve a more accurate understanding of the trend.
- Each impulse on a higher time frame is composed of five impulsive sub-waves on a lower time frame;
- Each corrective wave on a lower time frame appears in the form of an ABC or WXY pattern;
- Alignment of a higher-timeframe impulse wave with wave 3 on a lower time frame is a strong signal of trend continuation;
- In multi-timeframe analysis, the wave position on the higher time frame is identified first, and then lower-timeframe sub-waves are examined for entry or exit;
- The simultaneous completion of wave 5 on a lower time frame with a larger-degree wave usually indicates trend termination.
This approach, by illustrating the continuity of waves across different degrees, provides a clearer understanding of market structure and the zones where acceleration phases begin.
Conclusion
Impulse Wave Elliott (elliott wave impulse patterns) are five-wave price structures that follow strict rules. They are divided into Standard Impulse and Terminal Impulse, with the main difference lying in the correction behavior of wave 4.
By recognizing the cycle of impulse and corrective waves, traders can forecast future market movements. Once a five-wave impulse sequence completes, a three-wave corrective structure typically follows.


