


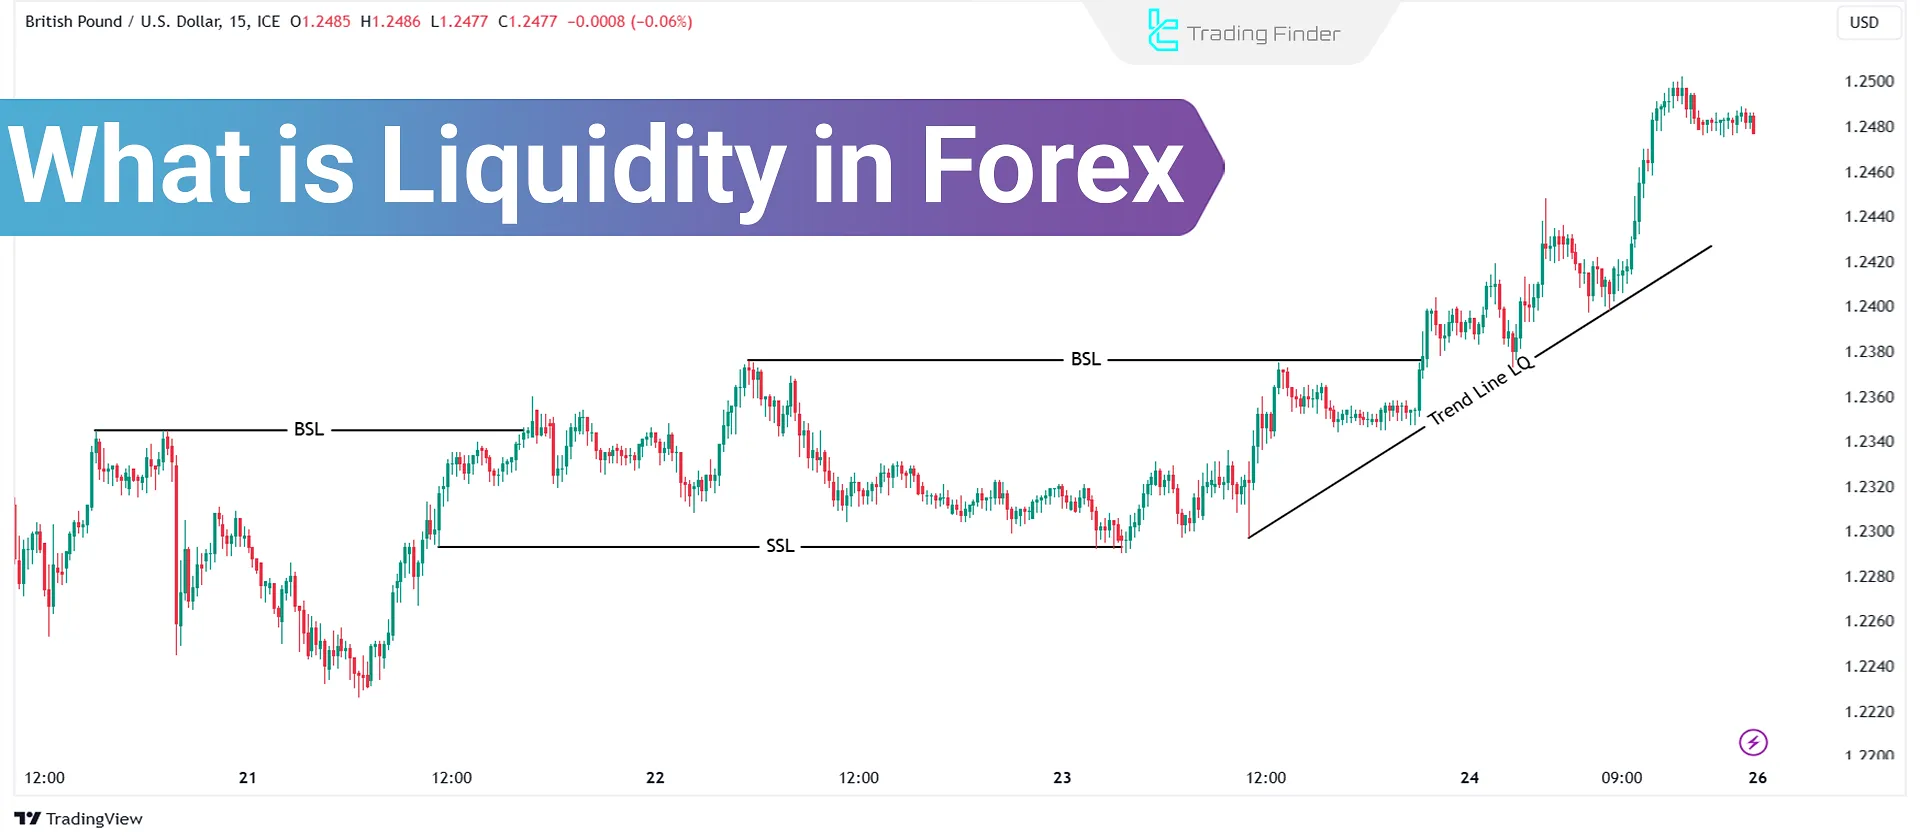
Liquidity in forex refers to stop loss activation zones triggered by market algorithms and Smart Money. These areas often accumulate buy-stop and sell-stop orders, acting as liquidity sources in forex and driving significant bullish and bearish price movements.
For this reason, price is usually driven toward these areas with the aim of hunting these stops in order to provide the necessary liquidity for the entry of large players.
Understanding this behavior helps traders better identify deceptive market moves so that, instead of entering emotionally, they make decisions in alignment with the flow of smart money.
What is Liquidity in Forex?
Liquidity in forex refers to the volume of available buy and sell orders in the market, which allows for smooth and quick trade execution. It is defined by the market's ability to absorb large orders without significant price changes.
These zones accumulate buy-stop and sell-stop orders and are classified into four main categories.
Liquidity in Forex is critically important for three main reasons:
- Fast trade execution: In highly liquid markets, orders are executed without delay and with very low slippage;
- Reduction of irrational volatility: High liquidity causes prices to behave more naturally and prevents sharp and unpredictable movements;
- Lower spreads and trading costs: The higher the liquidity, the greater the competition between buyers and sellers, which leads to tighter spreads.
What is a Liquidity Provider in Forex?
A liquidity provider in Forex is an entity that continuously offers bid and ask prices in the market and enables fast order execution. These entities include major banks, international financial institutions, hedge funds, and large brokers.
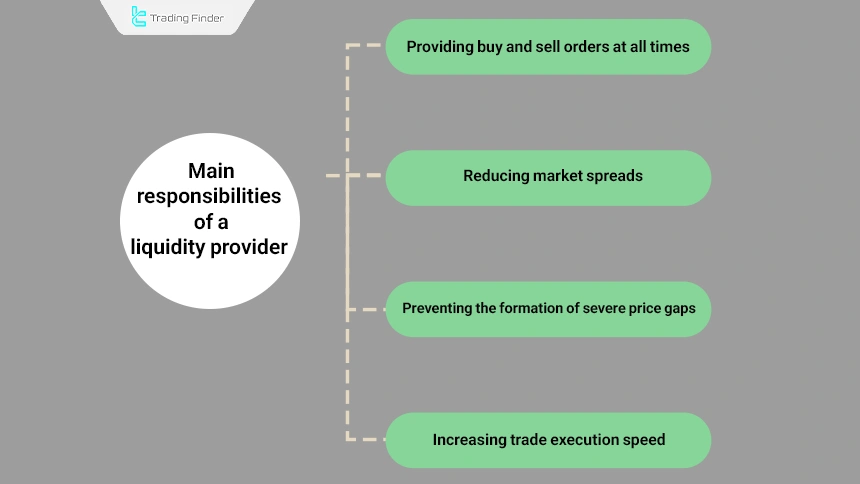
The main responsibilities of a liquidity provider include the following:
- Providing buy and sell orders at all times;
- Reducing market spreads;
- Preventing the formation of severe price gaps;
- Increasing trade execution speed.
What Are the Types of Liquidity in Forex?
Liquidity in the forex market has various forms, which are utilized explicitly in Smart Money and ICT trading strategies. Types of liquidity in the Forex market:
- Buy-Side Liquidity
- Sell-Side Liquidity
- Internal Liquidity
- External Liquidity
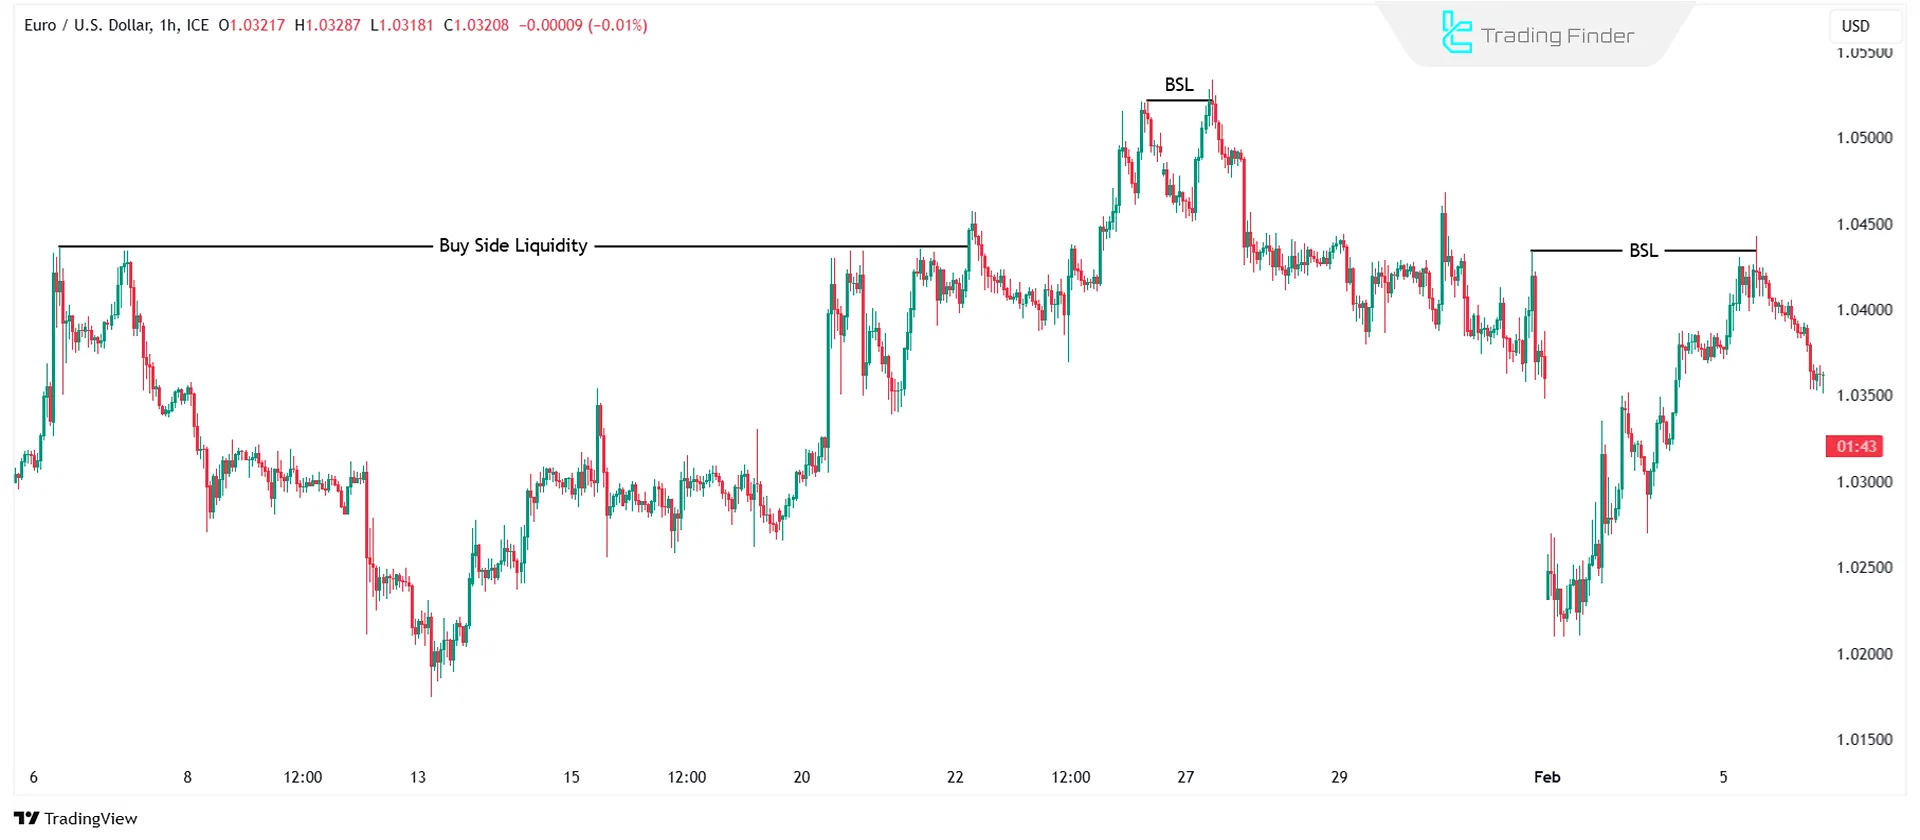
Buy-Side Liquidity (BSL)
Buy-side liquidity (BSL) refers to areas of the market where there is a high concentration of pending buy orders. When the market reaches these areas, it can activate a large volume of pending orders and provide the necessary momentum to continue the move or change direction. The
characteristics of this type of liquidity include the following:
- This type of liquidity in the Forex market is formed from the volume of pending Buy Stop orders; retail traders place these levels to protect their sell positions;
- In smart money and ICT concepts, this type of liquidity is usually accumulated at previous highs, equal highs (EQH), and key resistance levels.
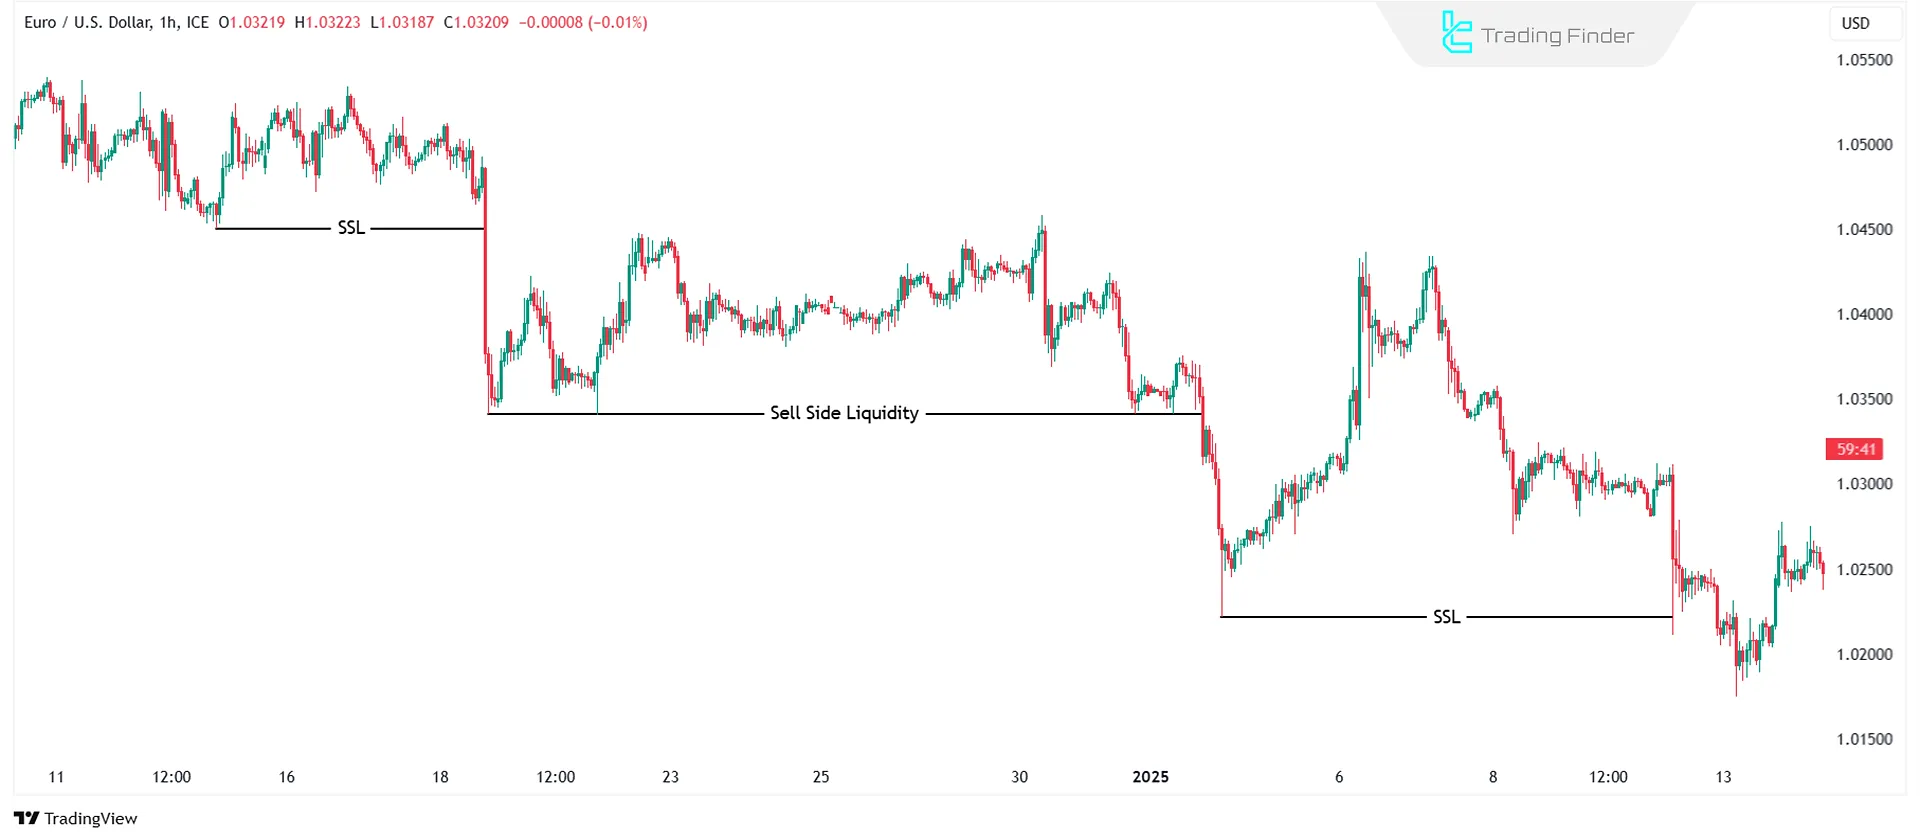
Sell-Side Liquidity (SSL)
Sell-side liquidity (SSL) refers to specific areas of the market where the highest concentration of pending sell orders is accumulated; these orders usually take the following forms:
- In Forex, this type of liquidity consists of pending Sell Stop orders that are placed to protect buy positions and are located near key lows;
- Sell-side liquidity is commonly found at previous lows, equal lows (EQL), and key support levels.
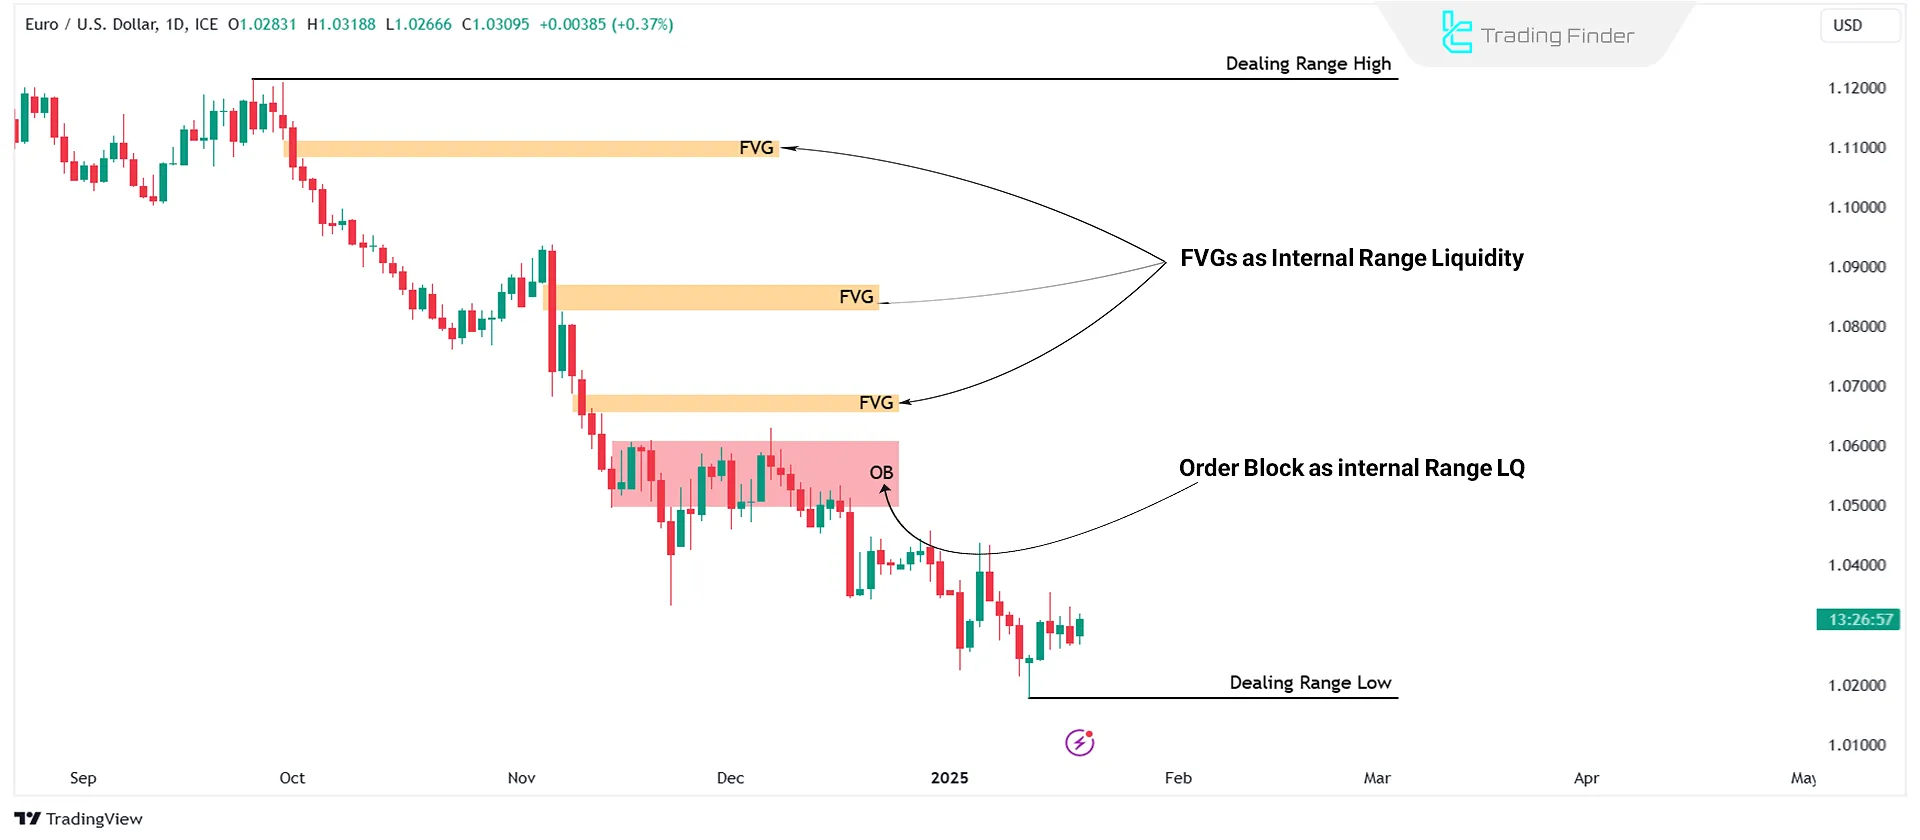
Internal Liquidity
Internal liquidity refers to sections of a price move where the market enters a phase of re-accumulation and order adjustment, and it includes the following:
- It is formed from Fair Value Gaps (FVG) and Order Blocks (OB);
- These areas represent zones of temporary price balance before the market moves toward external liquidity.
In these zones, after a strong impulsive move, the market enters a corrective phase to compensate for part of the order imbalance and collect the liquidity required to continue the move.
Example of Internal Liquidity on a Price Chart
An example of internal liquidity can be observed on the daily chart of the EUR/USD currency pair, where the return of price to these zones provided the necessary liquidity for the continuation of the move.
In this example, the price retracement into FVG and order block (OB) areas activated pending orders and completed previous imbalances, after which the market continued its movement more strongly in the direction of the main trend.
This behavior shows that internal liquidity plays a key role in fueling subsequent price movements and preparing the market to reach external liquidity.
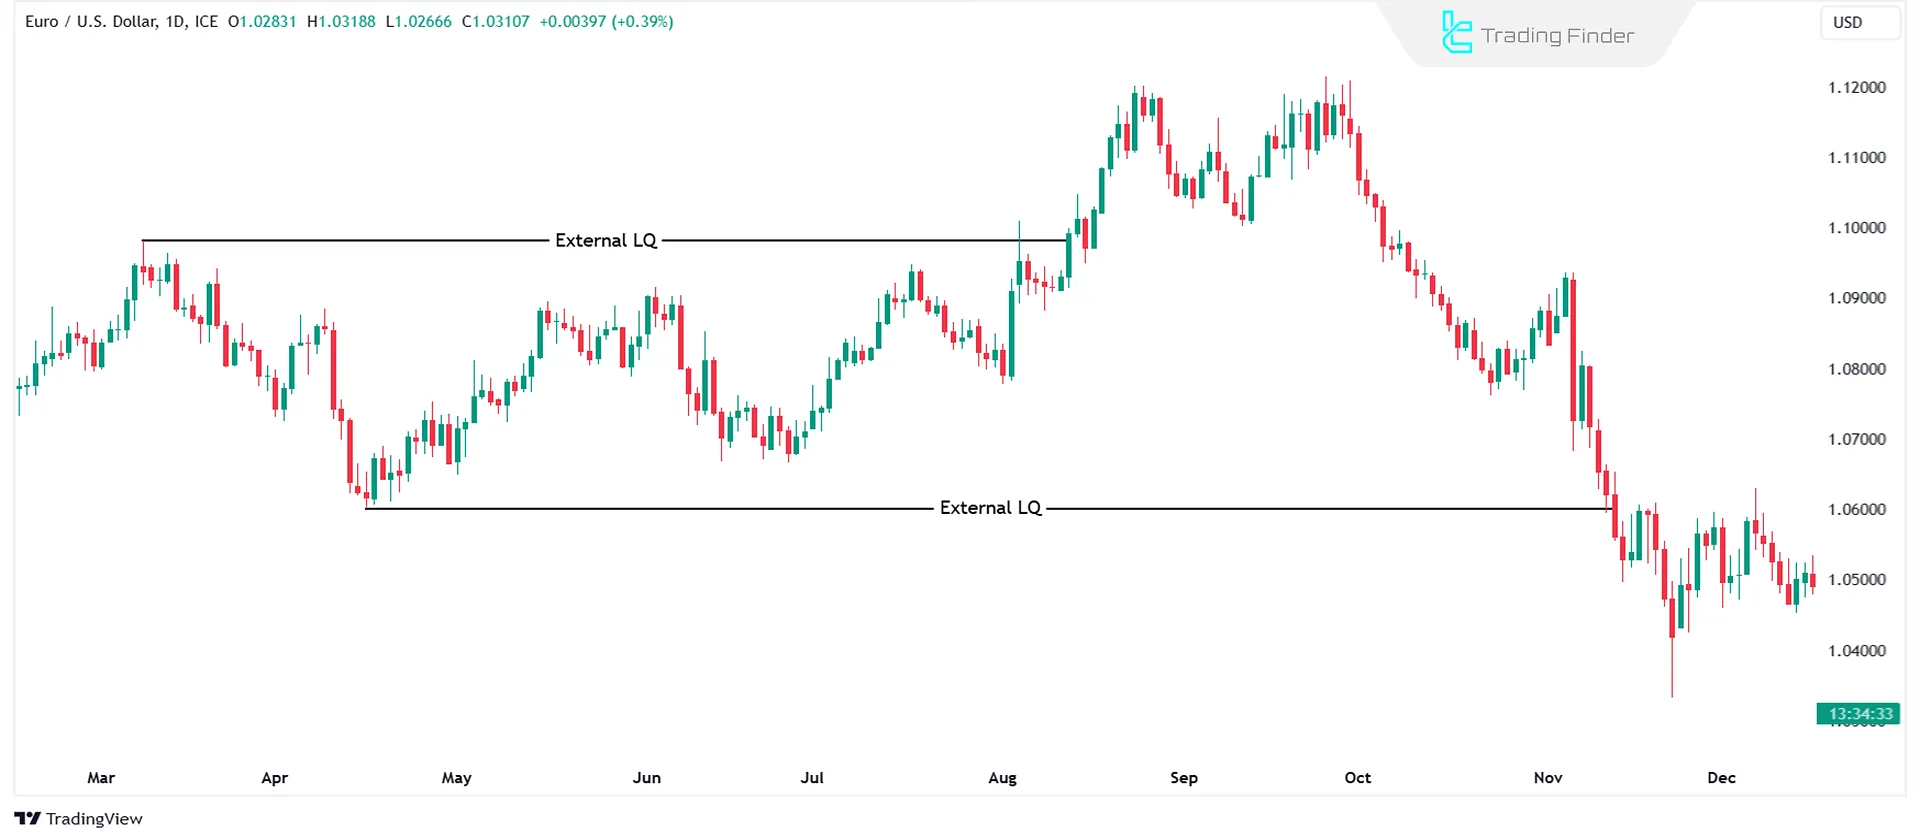
External Liquidity
External liquidity consists of major highs and lows, which the market moves toward to absorb liquidity. These highs and lows are often visible on higher timeframes and act as primary price targets for large market participants.
A breakout above or a reaction at these areas is usually accompanied by the collection of stop-loss orders and the activation of pending trades, and it can initiate a powerful move or a meaningful trend reversal.
Example of External Liquidity on a Price Chart
On the daily timeframe chart of the EUR/USD currency pair, it can be observed that price moved toward external liquidity targets.
After price reached these targets, the activation of stop losses and the entry of new orders led to sharp reactions and, in some cases, trend reversals, clearly demonstrating the role of external liquidity in guiding market movements.
What is a Liquidity Pool?
A liquidity pool refers to an area where a large volume of traders’ stop-loss orders is accumulated. These areas usually include:
- Above price highs (BSL Pool)
- Below price lows (SSL Pool)
Banks and large institutions provide the liquidity required for entering their heavy positions by driving price toward these pools.
Why do Banks Seek to Hunt Traders’ Liquidity?
Due to the very large size of their orders, banks cannot enter the market all at once, because the sudden execution of such volume would push price rapidly away from the desired area; therefore:
- They first encourage retail traders to enter incorrect positions;
- Stop losses are triggered;
- The required liquidity is collected;
- Then the main market move begins.
This process is what is known in the ICT style as a liquidity grab.
The liquidity education article on the itbfx.com website provides additional explanations about different types of Forex liquidity, which can be used as a reference.
Which Liquidity Levels Are Most Important in Forex?
In the Forex market, levels such as highs and lows are of great importance. Below, the most important market levels in Forex are outlined:
- Previous Month's High and Low (PMH/PML): Key levels that the market tends to move toward; these levels act as reversal points or price targets;
- Previous Week's High and Low (PWH/PWL): Provides insights from mid-term trends and helps to set entry and exit points;
- The Previous Day's High and Low (PDH/PDL): Helps forecast short-term price movements and identify entry points;
- Trading Session Highs and Lows: Each trading session (Asia, London, New York) has its liquidity dynamics. The highs and lows of each session act as key price targets.
Liquidity in Forex Trading Sessions (Asia, London, New York)
Each trading session has a completely different liquidity behavior, and an ICT trader must know what type of liquidity to look for in each session. In the table below, Forex market liquidity across different sessions is compared and analyzed:
Trading session | Overall market structure | Liquidity behavior | Role in daily market structure | Analytical application for an ICT trader |
Asian session | Mostly range-bound and low volatility | Formation of the initial liquidity pool including Asia High & Asia Low | Creating a reference range for liquidity manipulation in later sessions | Identifying liquidity accumulation range, defining initial bias, and preparing for the London liquidity sweep |
London session | Strong, directional, and high volatility | Highest volume of daily liquidity grabs | Main area for break of structure (BOS) and the start of the day’s primary trend | Golden entry point based on Asia liquidity hunt, confirmation of structure shift, and trend formation |
New York session | Strong trend continuation or reversal phase | Hunting remaining liquidity above highs and below lows | Completion of the London main move or market phase shift | Trend continuation setups or reversal trades with liquidity confirmation |
What is the Draw on Liquidity (DOL)?
Draw on Liquidity (DOL) refers to the market's tendency toward internal and external liquidity zones.
Steps to Identify Draw on Liquidity (DOL)
- Identify External Liquidity: Locatemajor highs, lows, or equal levels in higher timeframes (daily or weekly);
- Identify Internal Liquidity: Find Fair Value Gaps (FVG) and Order Blocks in lower timeframes (1-hour or 15-minute charts);
- Observe the Movement Between Internal and External Liquidity: Price generally moves from internal liquidity toward external liquidity and vice versa;
- Monitor Market Structure Shift (MSS): If the price breaks through an internal liquidity zone and moves toward external liquidity, the market structure changes to form a new trend;
- Confirm with Lower Timeframes: Use lower timeframes (5-minute or 1-minute) to accurately time entry and exit points.
High-Resistance Vs Low-Resistance Liquidity
Premium and discount liquidity are key liquidity concepts in the ICT style that focus on analyzing market behavior when interacting with liquidity absorption zones. Liquidity behavior in an uptrend follows these stages:
- Price first collects sell-side liquidity (below lows);
- Then it moves toward buy-side liquidity (highs);
- Each retracement is often for collecting sell-side liquidity.
In a downtrend, liquidity behavior follows these stages:
- Buy-side liquidity (above highs) is cleared first;
- Then price moves toward sell-side liquidity;
- Each pullback is a liquidity trap for buyers.
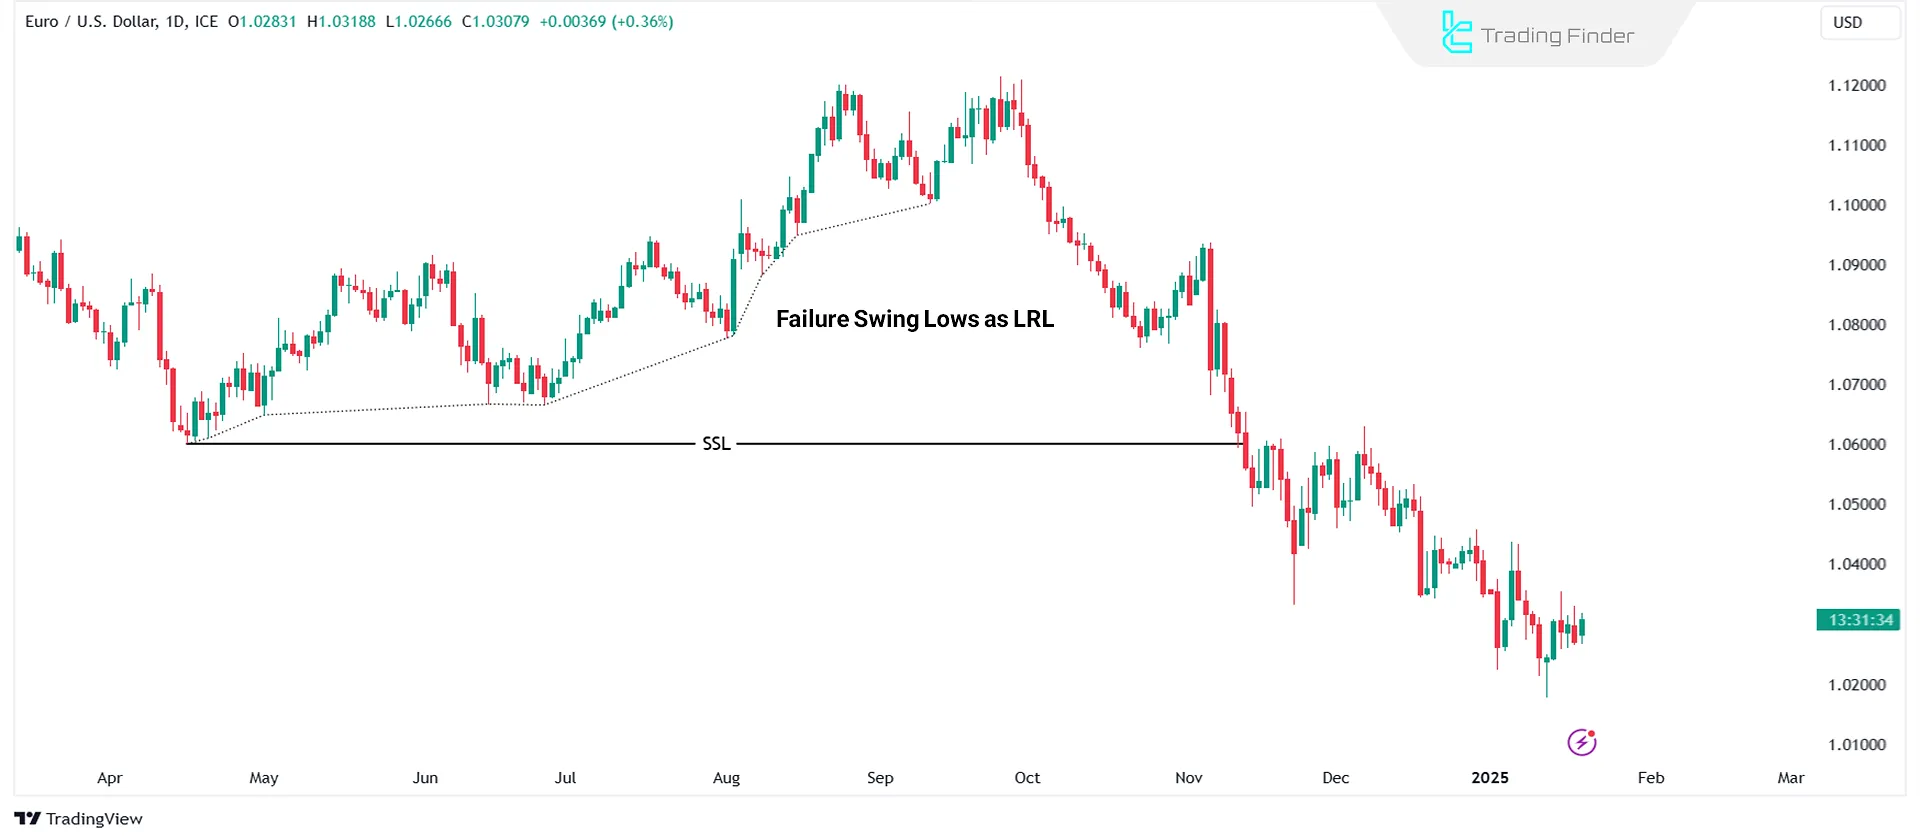
Low-Resistance Liquidity (LRL)
Low-resistance liquidity occurs when the market reverses quickly without absorbing liquidity. This phenomenon is also known as a Failure Swing.
Examples of LRL
- Failure Swing at Highs: If the price fails to break a previous high in a downtrend, a failed swing high;
- Failure Swing at Lows: In an uptrend, if the price fails to break a previous low, a failed swing low.
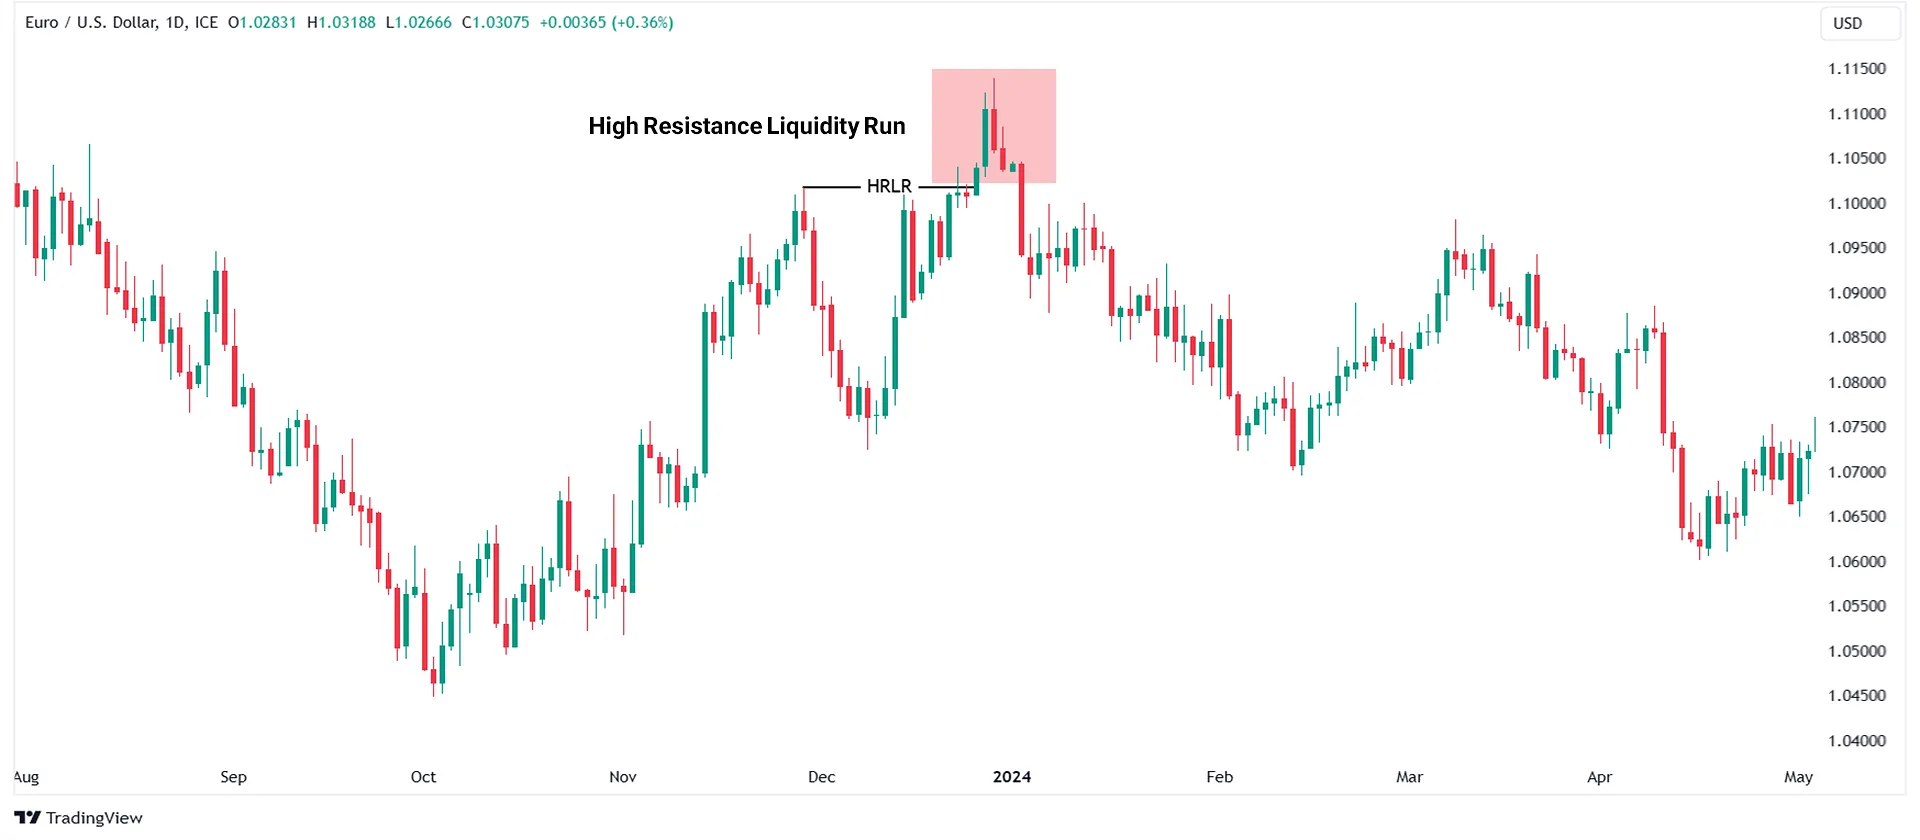
High-Resistance Liquidity (HRL)
High-resistance liquidity occurs when the market absorbs liquidity before reversing. This often happens when the price breaks a high in an uptrend or breaks a low in a downtrend before reversing.
Examples of HRL
- Break and Reversal at Highs: The market absorbs buy-stop orders above a high, then quickly reverses downward;
- Break and Reversal at Lows: The market absorbs sell-stop orders below a low, then moves upward.
Common Mistakes Traders Make in Liquidity Analysis
Common mistakes in liquidity analysis often stem from an incorrect understanding of market structure. Below are some of the most frequent errors traders make when analyzing liquidity.
- Entering a trade before liquidity is hunted;
- Mistaking internal liquidity for external liquidity;
- Trading in the middle of a range without a liquidity target;
- Ignoring trading sessions;
- Entering without confirmation of a Market Structure Shift.
In an educational video, the The Moving Average channel provides further explanations on more accurate liquidity identification and how to trade liquidity on the chart, which interested traders can use.
Buy-Side and Sell-Side Liquidity Indicator in MetaTrader
The buy-side and sell-side liquidity indicator in MetaTrader was designed as a specialized tool for analyzing liquidity flow and displayed buy-side and sell-side zones with high precision, making smart money behavior transparent for traders.
This tool played a central role in identifying sensitive market areas for traders who operate based on ICT and smart money concepts.
The indicator’s operating logic was based on tracking Buy Stop and Sell Stop orders, and these levels were recognized as liquidity accumulation zones of large market participants.
When price touched these areas and a liquidity sweep occurred, the tool evaluated price reversal conditions and, upon confirmation, issued an entry signal.
This process defined a clear path for traders to enter trades in alignment with the liquidity flow of financial institutions.
This indicator found application in Forex, cryptocurrency, stocks, and indices, and maintained its operational accuracy across different timeframes.
For example, on a 30-minute chart of a currency pair, after sell-side liquidity collection and a price return above the defined level, buy positions were identified with higher accuracy.
In a different structure, after buy-side liquidity was hunted and the level was broken to the downside, conditions for entering sell trades were formed.
In the settings section, parameters such as Swing Period, Breaker Maximum Duration, and color configurations for bullish and bearish structures, including Bullish MS, Bullish Breaker, Bearish MS, and Bearish Breaker, were made available to the user.
Overall, the buy-side and sell-side liquidity indicator, as an advanced analytical tool, creates a deeper understanding of price behavior, liquidity flow direction, and precise entry and exit points based on ICT and smart money concepts.
It also transforms the trader’s decision-making process from a probabilistic approach into a systematic process grounded in liquidity logic.
Conclusion
Understanding buy-side liquidity, sell-side liquidity, internal liquidity, and external liquidity is crucial for order flow analysis and predicting price movements. Key liquidity areas such as daily, weekly, and monthly highs and lows help identify reversal points, price targets, and ideal trade entries.
Moreover, when price interacts with these levels, it is usually accompanied by increased trading volume and rapid market reactions, as large players step in to collect liquidity or reposition their holdings.
Combining these zones with market structure and higher timeframes can enhance analytical accuracy and help prevent emotional and high-risk entries.


