


The moving average in technical analysis, calculates the average price over a specified time period, enabling trend identification and filtering out fluctuations. These are also referred to as MA.
Traders use this tool to identify price fluctuations, recognize market trends, and determine optimal entry and exit points.
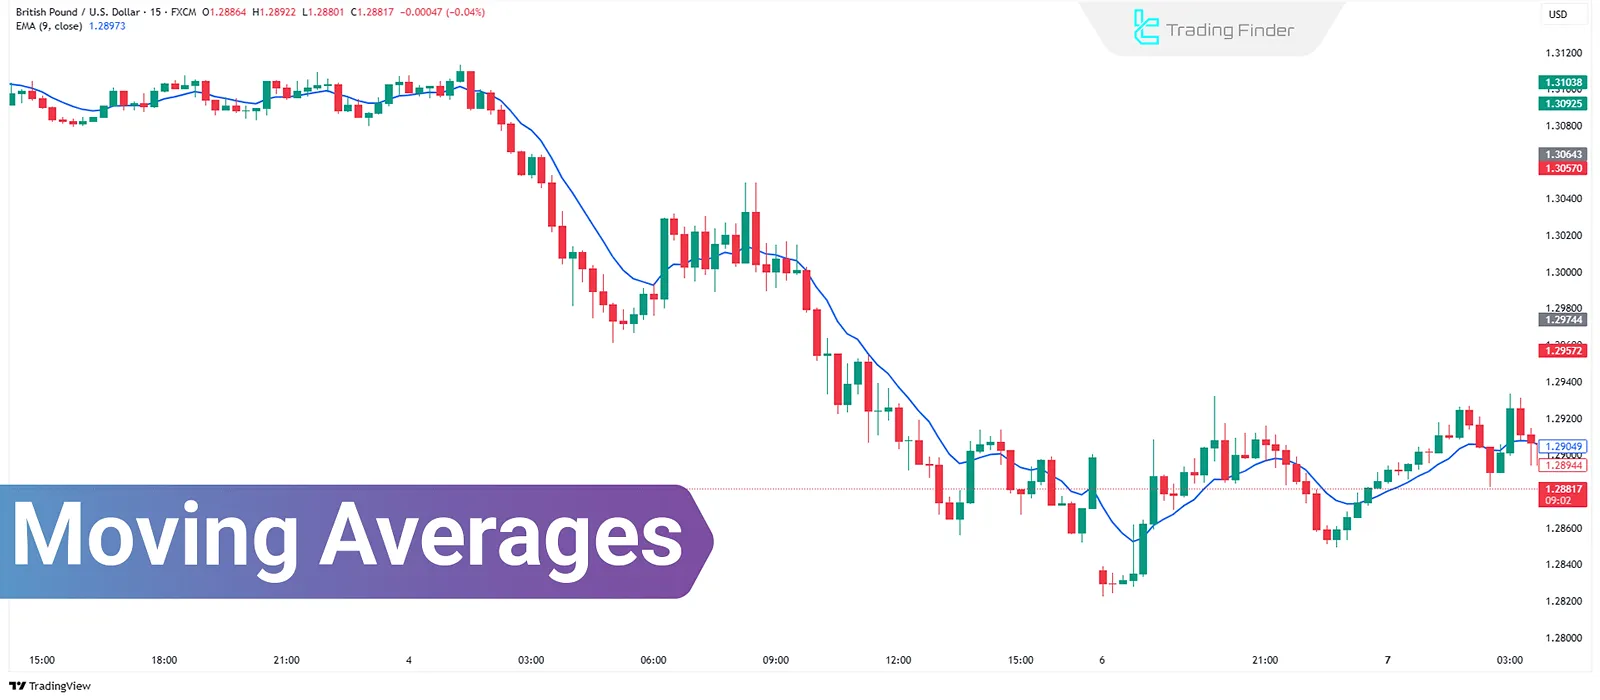
What is a Moving Average?
A Moving Average (MA) is a statistical indicator that calculates the average price of an asset over a specified time period and displays it as a curved (either smooth or sharp) line on a candlestick chart.
Its purpose is to reduce the noise caused by short-term price fluctuations and help identify larger market trends. This method is applicable in the Forex Market, stock, and cryptocurrency markets.
Advantages and Disadvantages of Moving Averages
The table below illustrates the advantages and disadvantages of using moving averages:
Advantages | Disadvantages |
Simple and easy to understand | Provides false signals in range-bound markets |
Reduces noise and short-term volatility | Fails to identify market turning points |
Can be used in different timeframes for more accurate analysis | Delayed response in performance |
Types of Moving Averages
This tool is divided into two main types of moving averages:
- Simple Moving Average (SMA)
- Exponential Moving Average (EMA)
Simple Moving Average (SMA)
In SMA, the average of closing prices of an asset over a specific period is calculated. For example, an SMA-50 is the sum of the closing prices over the past 50 days, divided by 50.
Exponential Moving Average (EMA)
In EMA, more weight is given to recent prices. Therefore, this moving average reacts more quickly to price changes and is commonly used by short-term traders.
Differences Between Simple and Exponential Moving Averages (SMA & EMA)
The differences between SMA and EMA are as follows:
Feature | SMA | EMA |
Sensitivity to new prices | Less | More |
Signal delay | More | Less |
Time frame | Long-term analysis | Short-term and scalping |
Appropriate Time Frames for Moving Averages
One of the critical factors in effectively using moving averages is choosing the appropriate period length. The period refers to the number of candles over which the average is calculated.
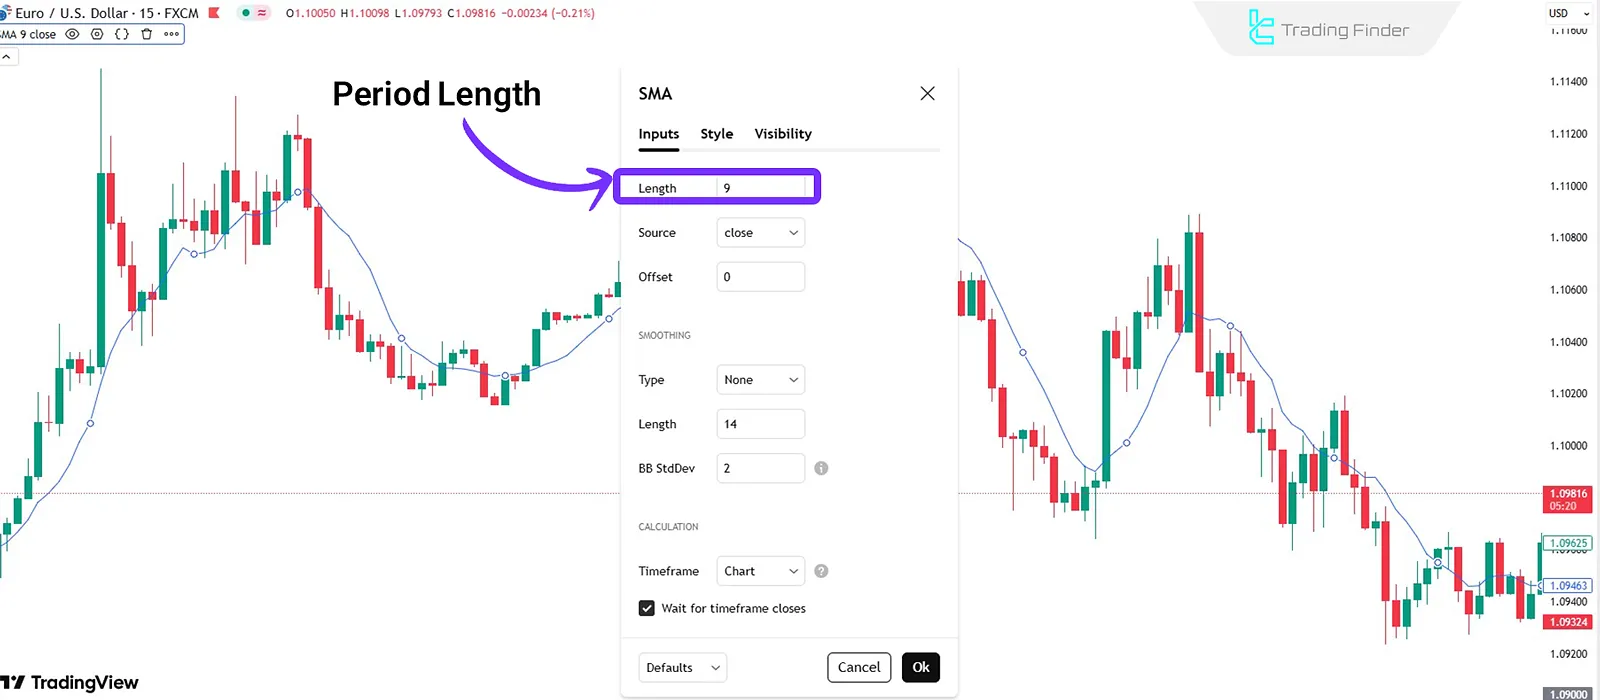
- Short-term moving averages (e.g., 10 or 20 periods) react more quickly to price movements;
- Long-term moving averages (e.g., 50 or 200 periods) are smoother and better represent long-term trends.
Choosing the right time frame should match your trading style. Short-term traders find faster moving averages more useful, while long-term investors benefit from slower averages.
Applications of Moving Averages
Traders use Moving Averages (MA) for various purposes:
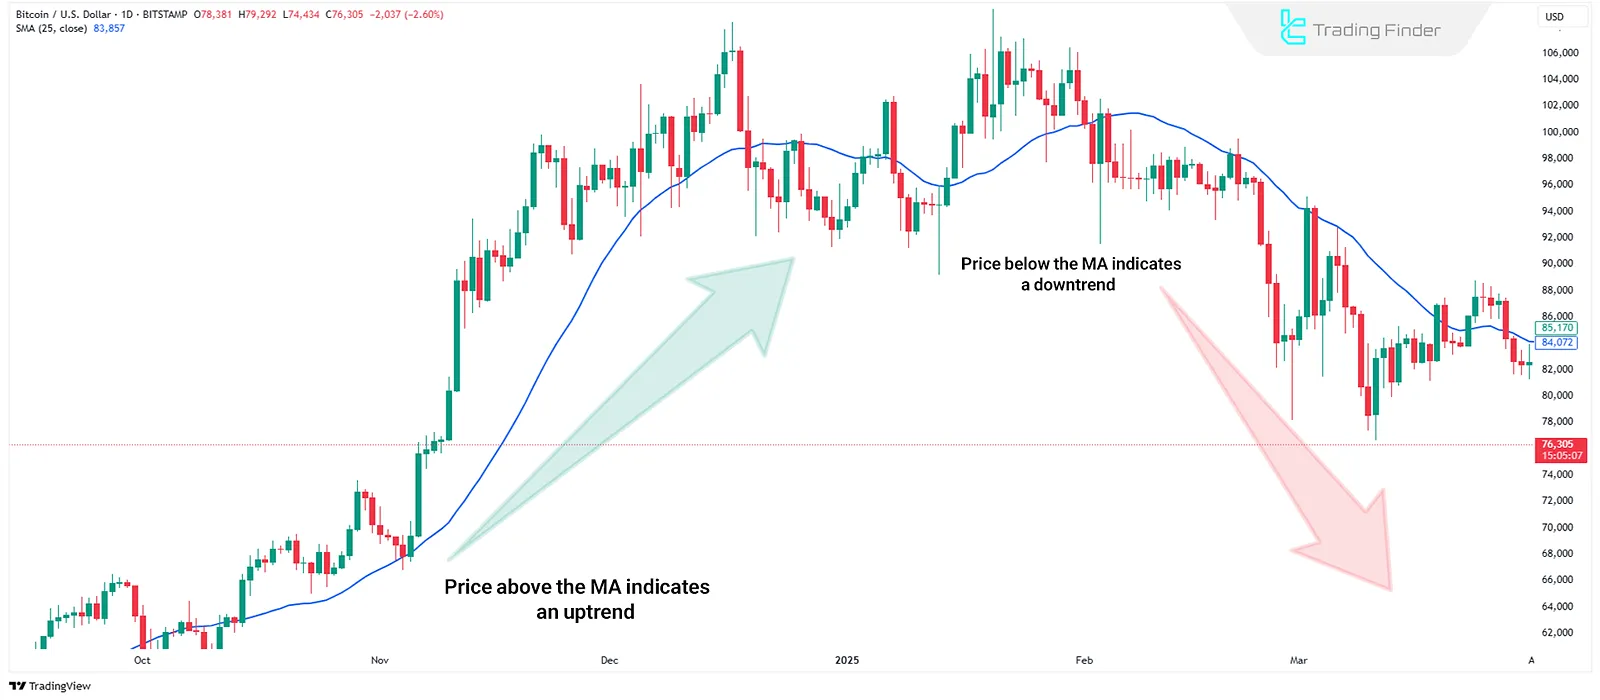
Identifying Market Trend
- If the price is above the MA, the market is considered bullish;
- If the price is below the MA, the market is considered bearish.
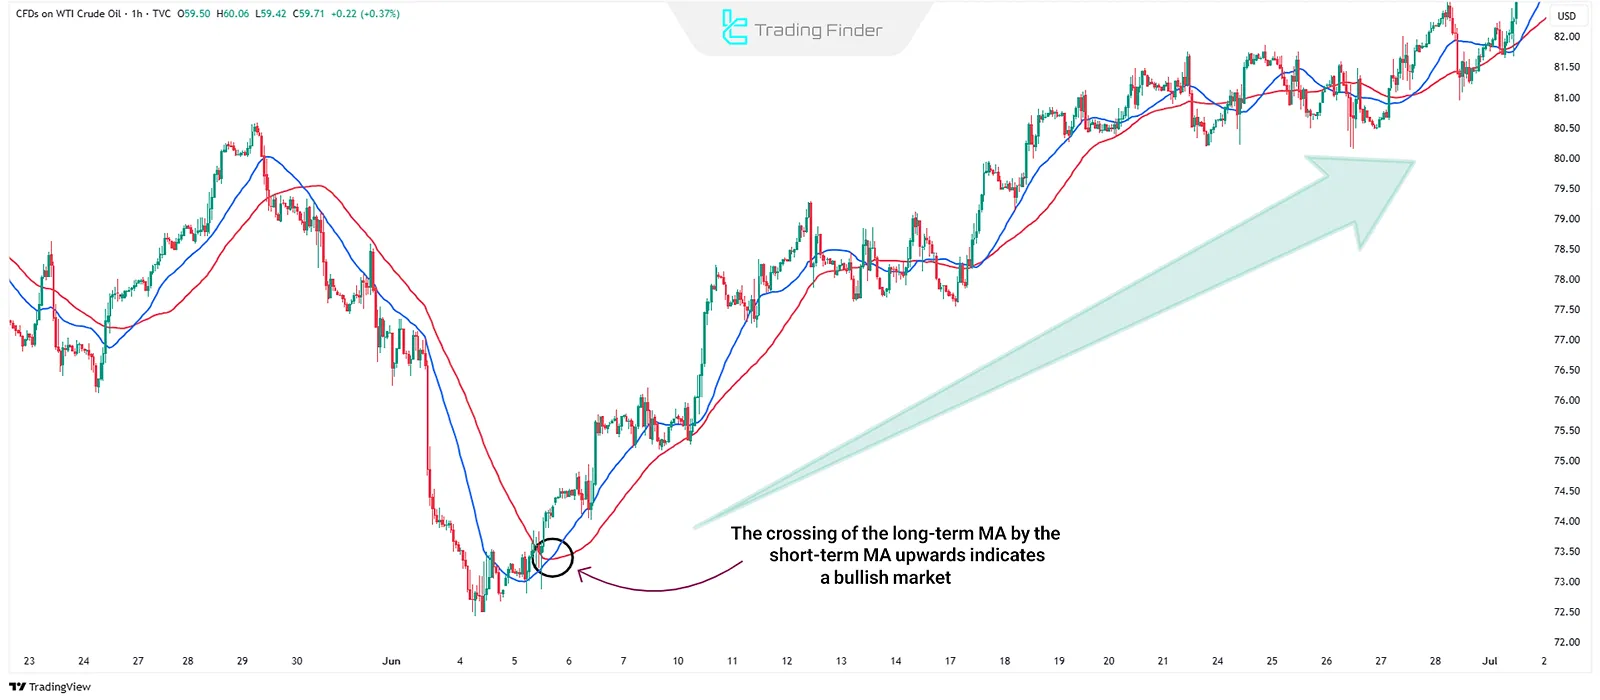
Buy and Sell Signals
One of the most widely used strategies is Moving Average Crossovers. When a short-term MA crosses above a long-term MA, it signals a buy opportunity. Conversely, when a short-term MA crosses below a long-term MA, it signals a sell opportunity.
Dynamic Support and Resistance Levels
In trending markets, MAs can act as dynamic support or resistance levels.
Multi-Timeframe Analysis Using MAs
Moving Averages behave differently across various timeframes. Combining them can give traders a deeper perspective.
If the price is above the MA in a larger timeframe but below the MA in a smaller timeframe, it could signal a temporary correction or a buying opportunity at a better price
Conclusion
Moving Averages (MA) are simple yet powerful tools for technical analysis in financial markets. By calculating the average price over different time periods, they can filter out short-term fluctuations and help identify the main market trend.
MAs are not only useful for trend identification but are widely used in strategies like crossovers, dynamic support and resistance, and multi-timeframe analysis.


