


Traders can use the Market Structure Shift "MSS" to identify medium-term price movements and trend reversals, while Change in State of Delivery "CISD" indicatesshort-term movements and price corrections.
Understanding the differences between MSS and CISD and their combination with Inverted Fair Value Gap "IFVG" can help identify hidden liquidity and create low-risk opportunities by absorbing reverse orders.
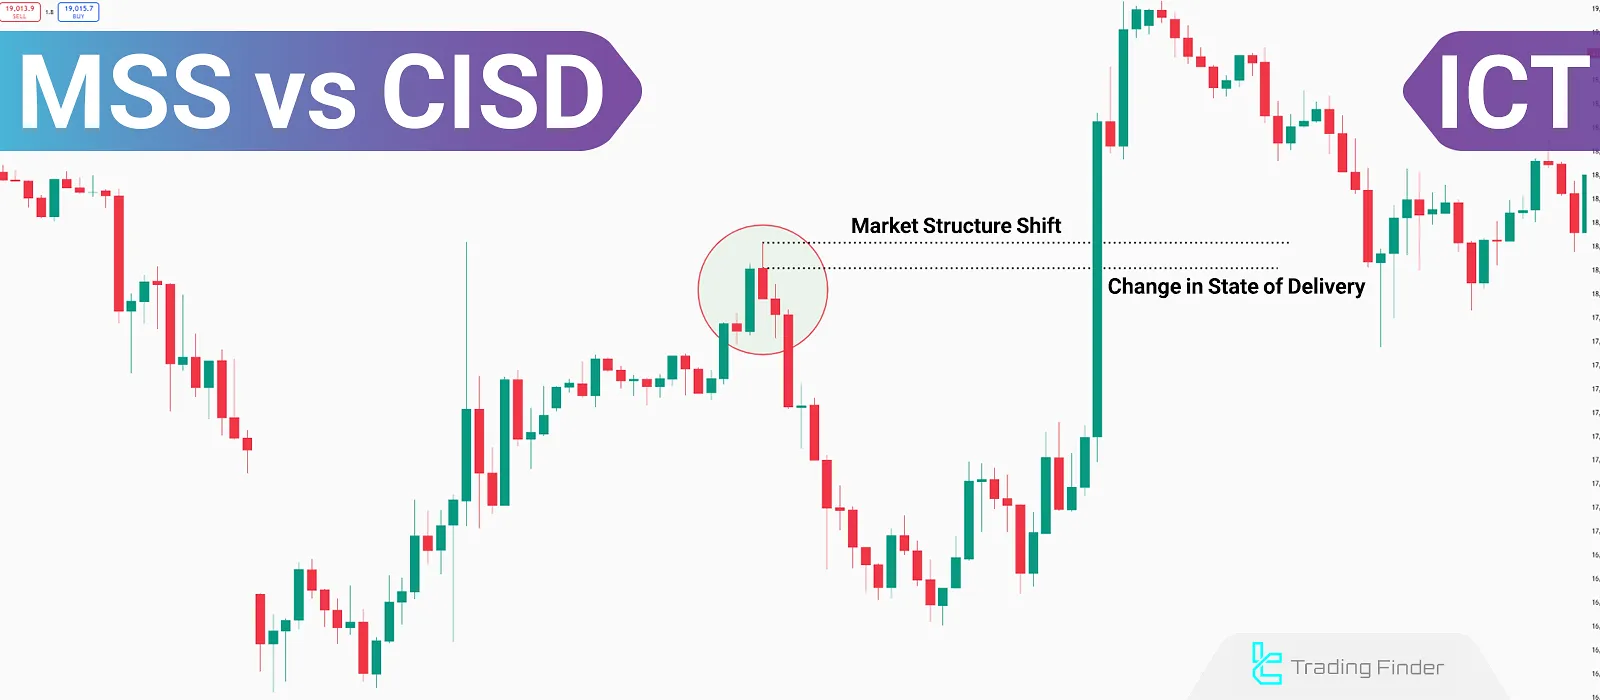
Differences Between Market Structure Shift "MSS" and Change in State of Delivery "CISD"
Market Structure Shift is a concept in the ICT style that leads to medium-term trend changes in the market, while Change in State of Delivery mainly indicates price corrections and short-term fluctuations. When "MSS" occurs in a price chart, "CISD" hasalready formed before it.
Inside the TTrades YouTube channel, the difference between ICT CISD and ICT MSS is explained through a dedicated video.
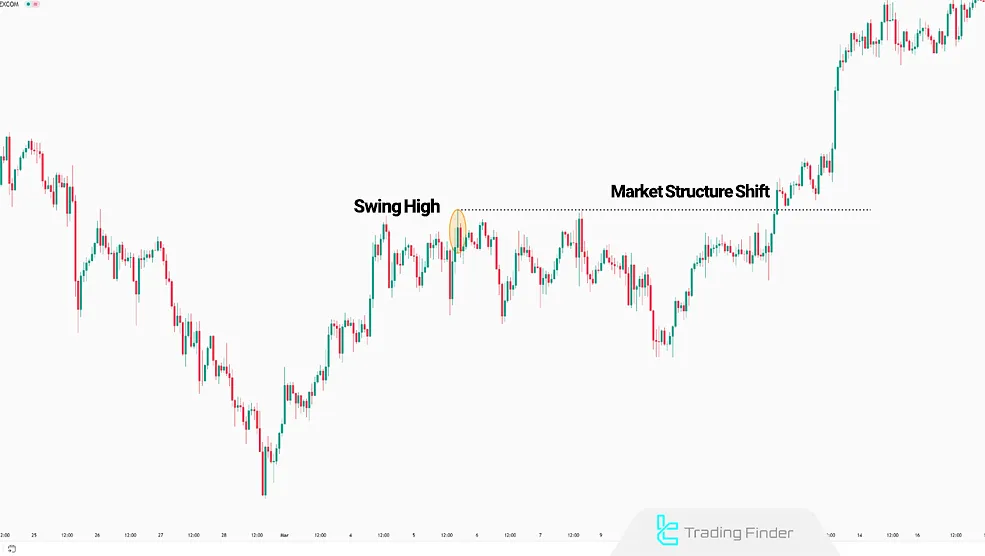
What is Market Structure Shift "MSS"?
Market Structure Shift (MSS) occurs when the price breaks a Swing high or Swing low, changing the direction of the current market trend.
This breakout signals the end of the previous medium-term trend and the beginning of a new one.
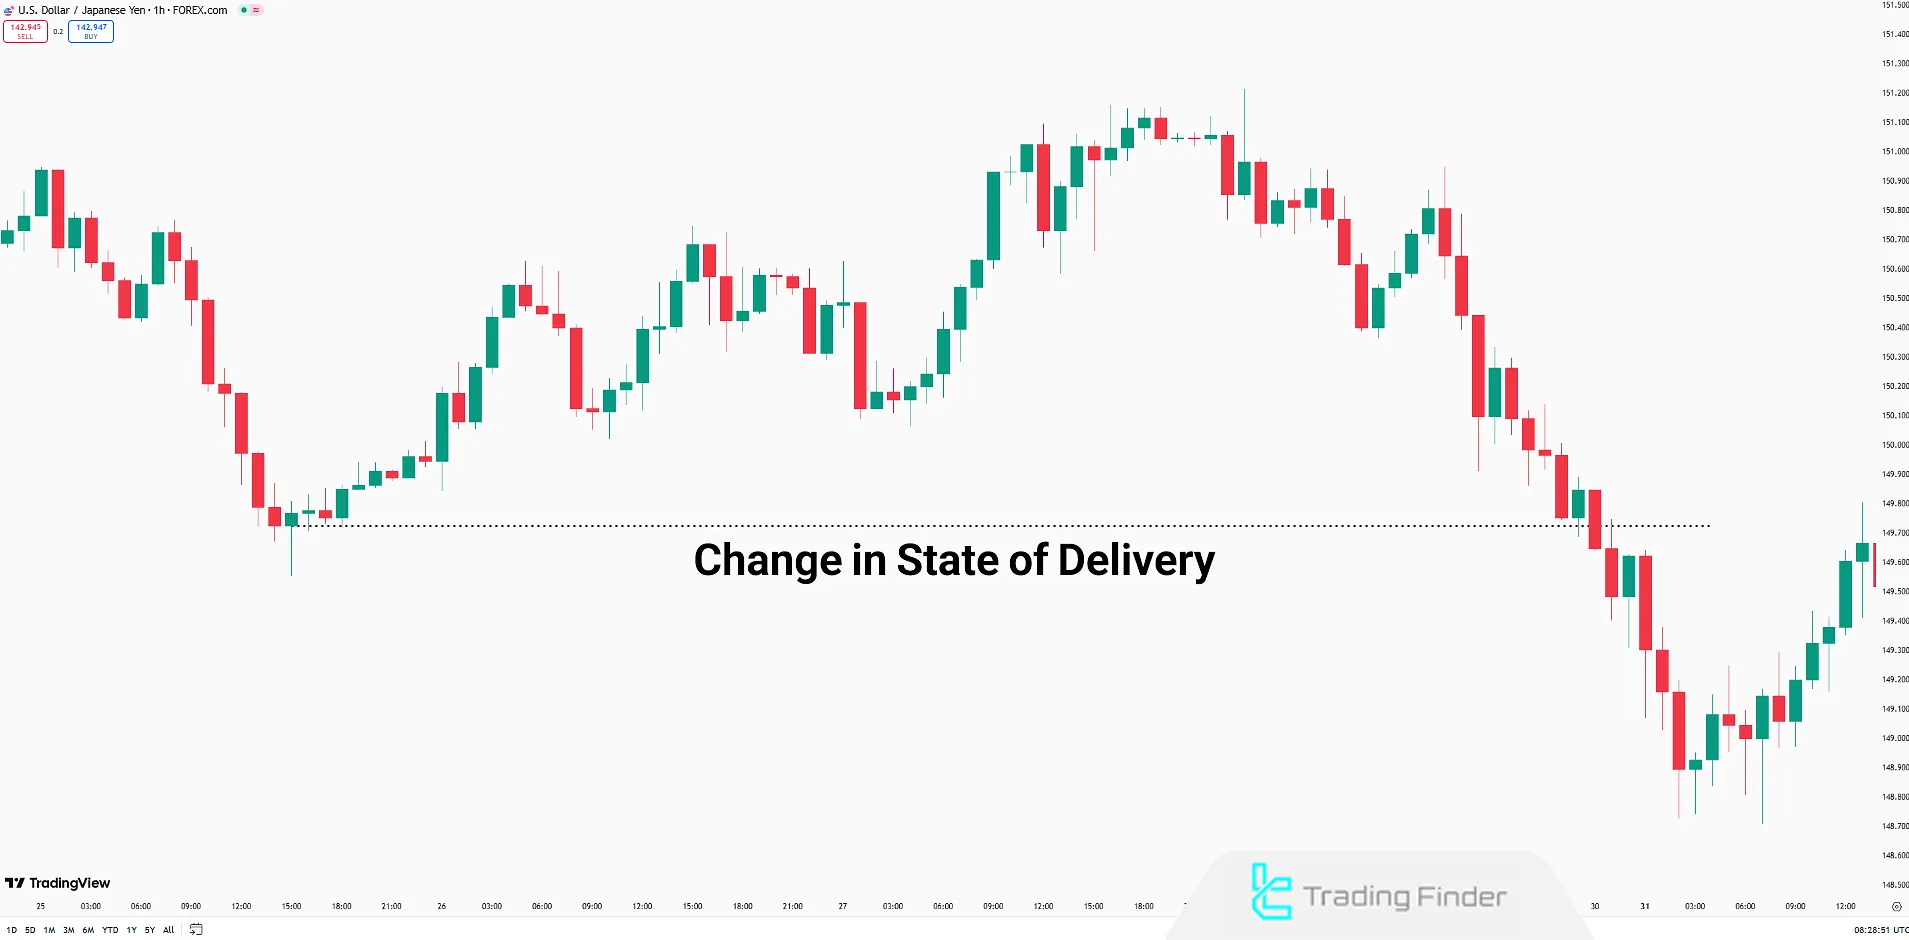
What is Change in State of Delivery (CISD)?
Change in State of Delivery (CISD) in ICT style refers to a situation where the usual price flow is interrupted or reverses direction.
This often happens after a consolidation phase or liquidity absorption. This change signals a price correction against the current market trend.
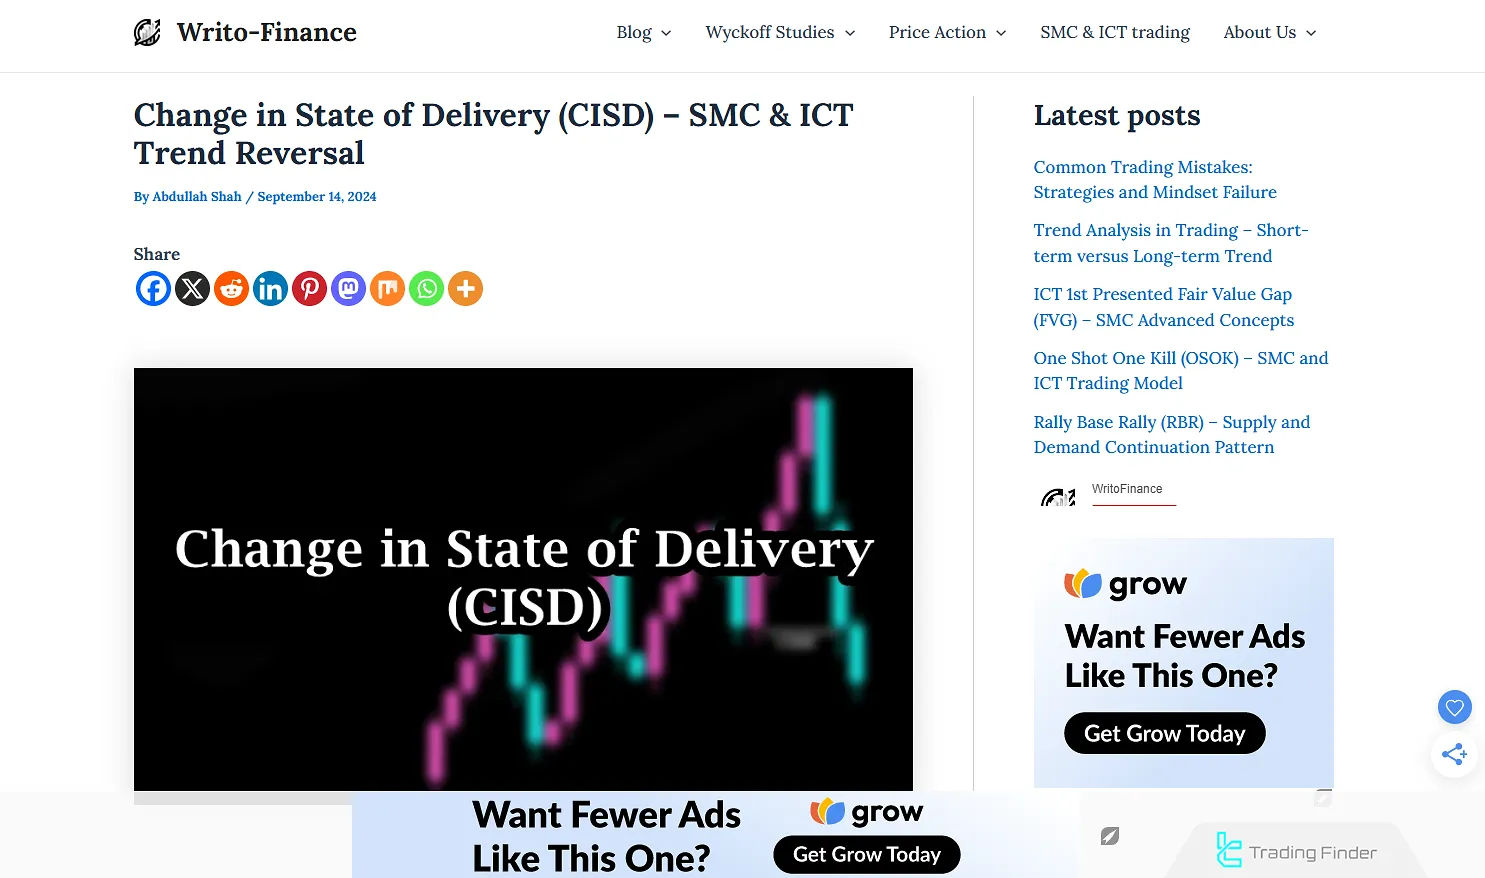
According to the tutorial on CISD provided on writofinance.com, CISD is identified once the body of a candle is broken.
It delivers faster signals for potential Trend Change in market movement.
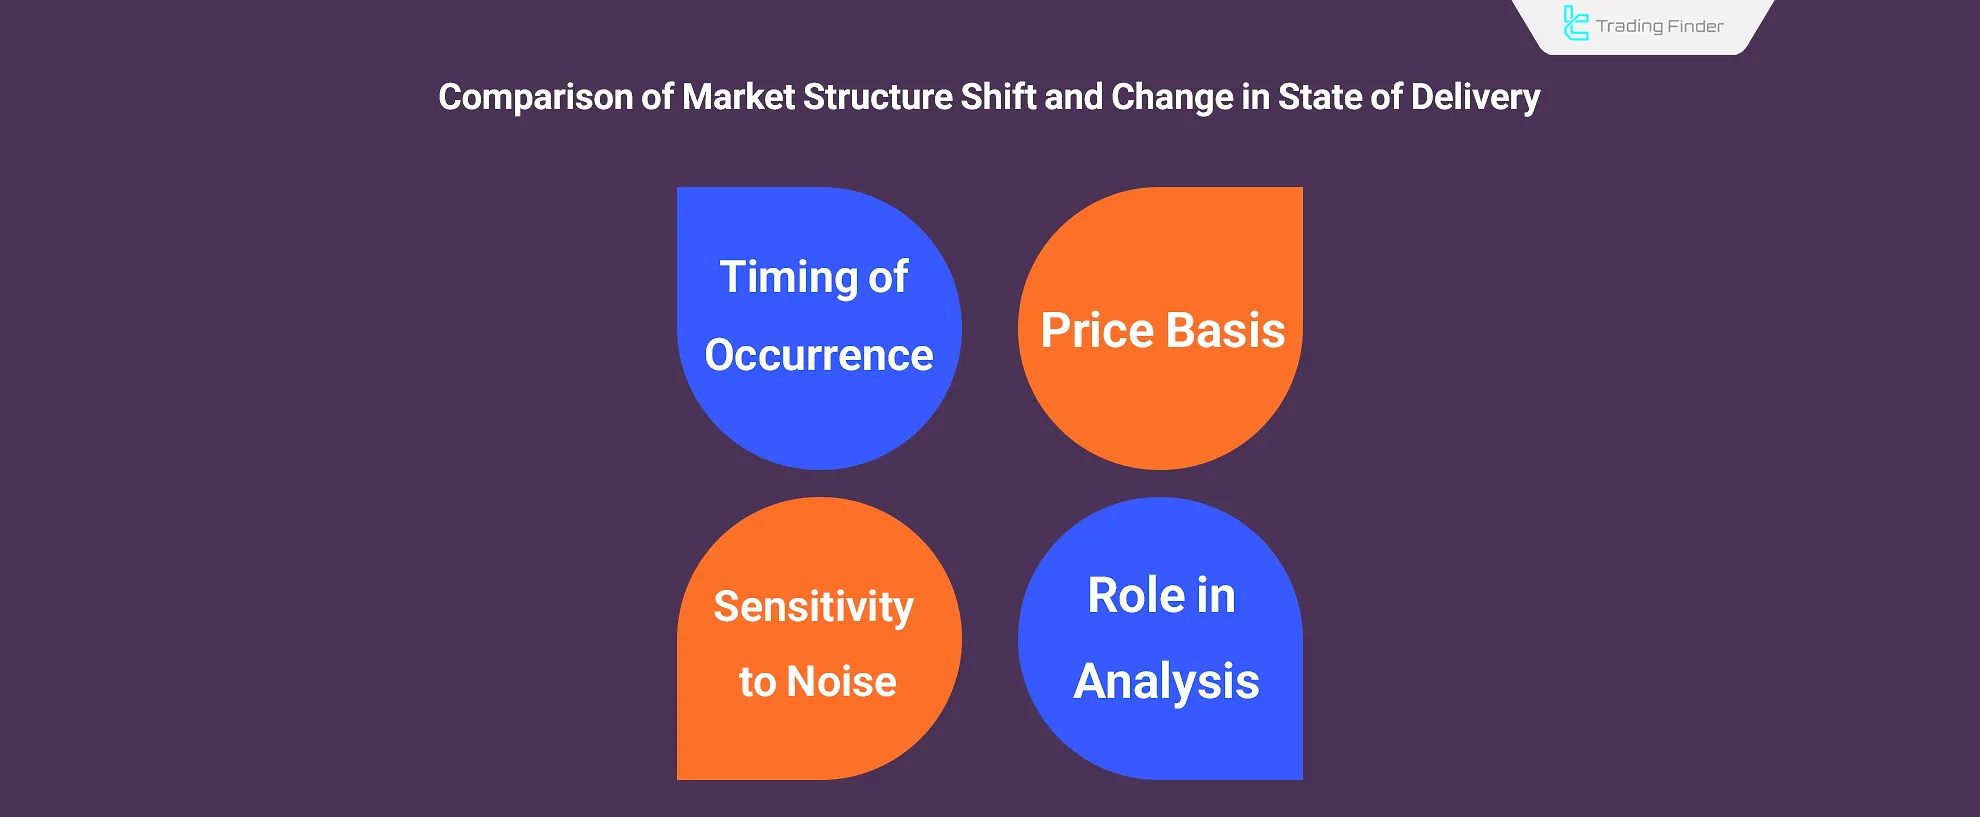
Difference in Price Basis Between MSS and CISD
To understand the Difference between ICT CISD and ICT MSS, one must focus on their identification basis on the candle.
Each structure reacts differently to price changes. The table below highlights the CISD vs MSS difference:
Comparison Criteria | Change in State of Delivery (CISD) | Market Structure Shift (MSS) |
Identification Basis | Based on Open and Close price of the candle | Based on a break of the High or Low of the candle |
Reaction Speed | Faster response to short-term changes (Early Signal CISD) | Slower but more stable for Later Confirmation (MSS) |
Impact of Price Noise | More sensitive to price noise | Reduces the effect of price noise |
Trend Confirmation Reliability | Lower reliability for confirming a Trend Change | Higher reliability and stronger confirmation (Reliability of MSS) |
Change in State of Delivery (CISD) Indicator
The CISD indicator extends beyond a simple buy or sell signal by embedding itself into the core logic of ICT price delivery models, where every market move is dissected through liquidity, structure, and timing.
Its ability to track candle closings within bullish and bearish sequences creates a dynamic framework that adapts to both short-term scalping environments and broader swing setups.
When CISD levels are combined with structural elements like Order Blocks (OB), Breaker Blocks, Fair Value Gaps (FVG), and Balanced Price Ranges (BPR), traders are essentially overlaying multiple layers of confirmation that reduce false signals and highlight liquidity-driven moves.
For instance, in fast-moving assets such as XAUUSD on a 5-minute chart, the retest of an FVG followed by a break of CISD level may signal the beginning of a bullish leg that aligns with order flow and session liquidity.
On the other hand, a 15-minute AUD/JPY chart rejecting a bearish Order Block and closing below CISD can validate the start of a controlled downtrend, which might extend across several sessions.
The customization of CISD adds another layer of precision, as users can filter which CISD types are displayed, integrate them directly with OB or FVG markers, and personalize visual output through trendline adjustments or color-coded signals.
This ensures that the indicator is not rigid but adaptable to each trader’s methodology and market focus.
Furthermore, CISD enriches its utility by incorporating global session timing, allowing practitioners to observe how signals behave differently during Asian, London, or New York trading hours, where liquidity and volatility dynamics vary significantly.
By aligning CISD signals with correlation studies across instruments; for example, comparing reactions in EUR/USD with USD/JPY or analyzing equity indices alongside currency pairs; traders gain a broader perspective of order flow distribution across markets.
This transforms CISD into a comprehensive analytical framework that merges liquidity theory, structural mapping, and time-based execution.
Ultimately, its role is not limited to signaling potential reversals or continuations, but rather to integrate seamlessly into an ICT trader’s arsenal as a contextual decision-making tool, supporting both intra-day precision trading and multi-session directional bias.
- Download Change in Delivery State (CISD) Indicator in ICT Style for MT4
- Download Change in Delivery State (CISD) Indicator in ICT Style for MT5
- Add Change in Delivery State (CISD) Indicator in ICT Style to Tradingview
MSS VS CISD
By understanding the differences between Market Structure Shift and Change in State of Delivery, traders can distinguish trend reversals from price corrections, thereby reducing trading errors.
Recognizing the difference between ICT CISD and ICT MSS helps distinguish between market corrections and true Trend Change signals:
Comparison Criteria | Market Structure Shift (MSS) | Change in State of Delivery (CISD) |
Price Basis | High / Low | Open / Close |
Timing | Later (final confirmation) | Earlier Entry (CISD)/ early warning |
Role in Analysis | ConfirmsTrend Change | Signals early behavioral shift |
Noise Sensitivity | Low | High |
Differences between MSS and CISD IS Market Structure Shift (MSS) is primarily used to identify medium-term trend changes in the market; in contrast, Change in State of Delivery (CISD) is suitable for detecting short-term corrective movements in the trend.
Order of Occurrence Between MSS and CISD
Chronologically,CISD is the first sign of market behavior shift. It provides an Early Signal CISD by capturing Open/Close imbalances.
The MSS forms later, only upon breaking a valid High or Low. Therefore, CISD is seen as the initial alert, while MSS acts as the confirming Trend Change structure.
This explains Whats the difference between MSS and CISD and why traders use them in combination.
Using MSS and CISD to Define Daily Bias
One major role of ICT CISD and MSS is setting the Daily Bias.
When both appear in the same direction, the MSS vs CISD chart indicates that order flow and sentiment have aligned, increasing the probability of continuation in that direction.
Multi-Timeframe Application of MSS and CISD
Analyzing multiple timeframes enhances the use of MSS vs CISD Forex signals. While MSS is often more reliable in higher time frames like H1 or H4, CISD appears earlier in smaller time frames such as M5 or M15.
Combining both layers allows earlier entries (CISD) with later confirmations (MSS).
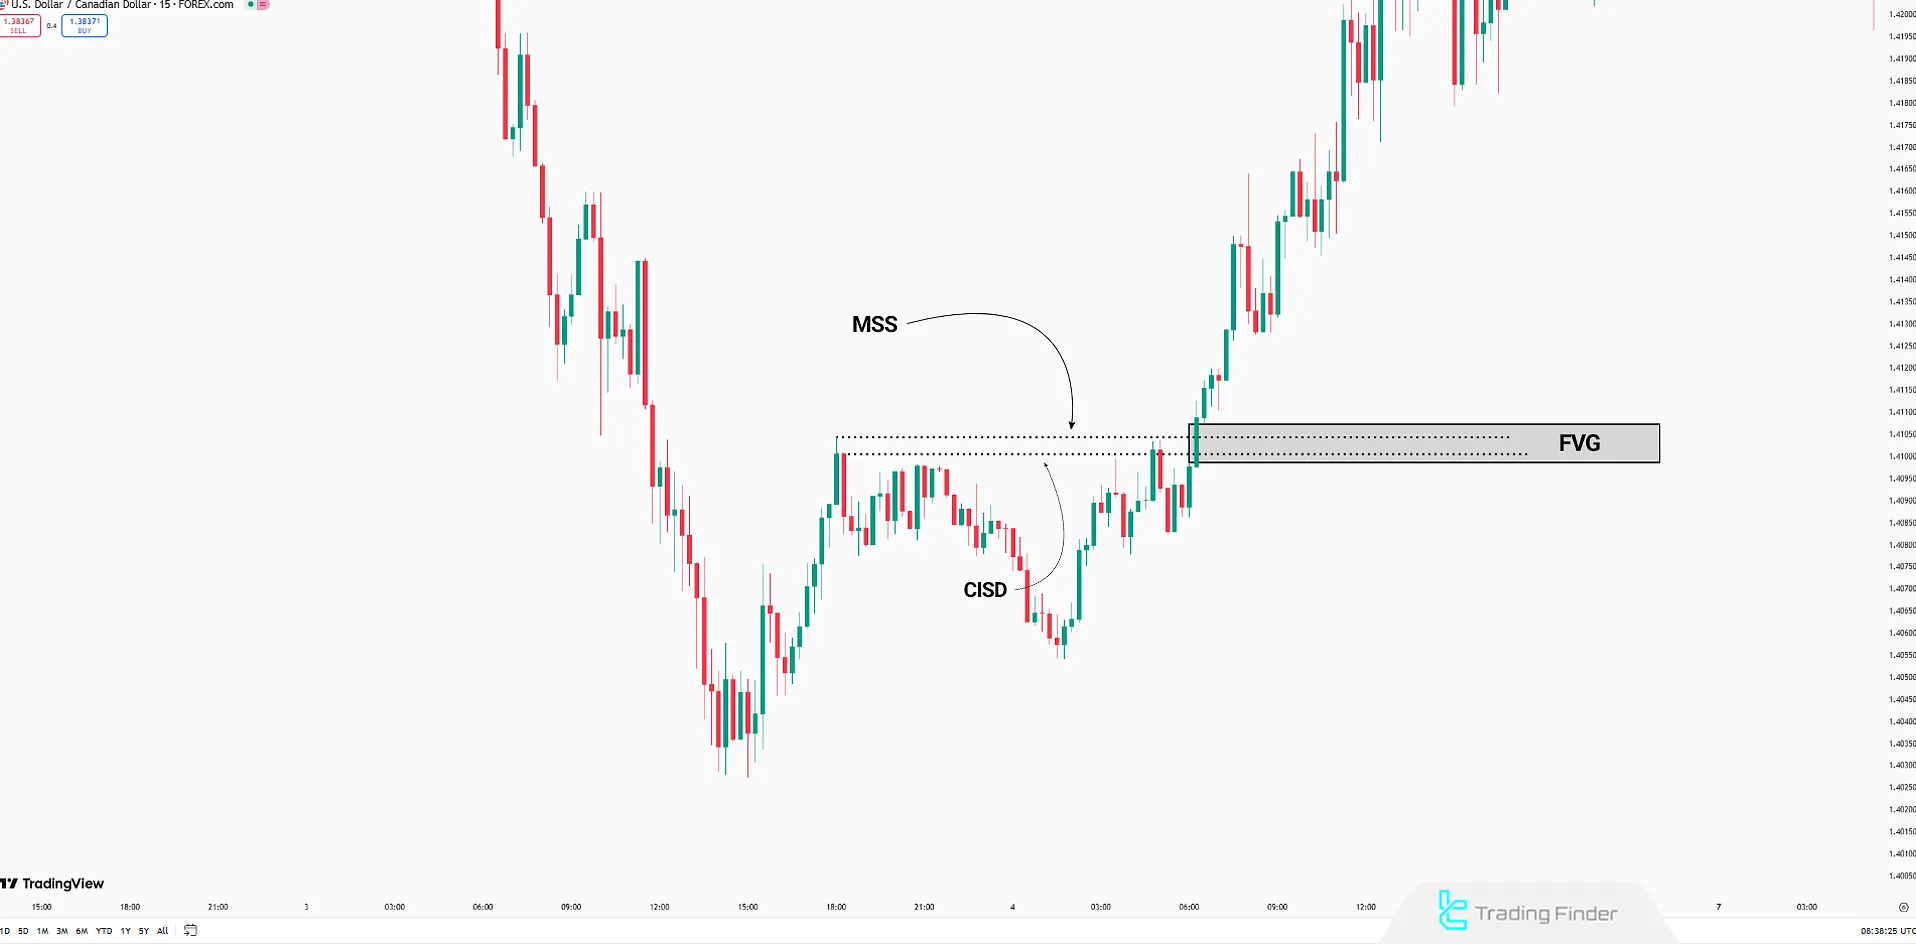
Combining MSS and CISD with Inverted Fair Value Gap "IFVG"
By combining these three concepts in the ICT style, reversal zones and low-risk entry points can be identified.
In this setup, after a Change in State of Delivery "CISD" is observed and a Market Structure Shift "MSS" is confirmed, the price usually returns to the Inverted Fair Value Gap "IFVG" to fill the price gap before starting a new movement.
1# Identify Market Structure Shift (MSS)
Sudden price movements often indicate a shift in market structure, but without analyzing the higher timeframe, they cannot be trusted.
- Determine Daily Bias: Analyze the higher time frame (HTF) to identify key highs and lows and determine the daily trend direction;
- Break of Swing High or Swing Low with Displacement Move: Validate the breakout of support or resistance levels on the lower time frame (LTF).
2# Identify Change in State of Delivery point(CISD)
In low-liquidity markets, CISD may only be a temporary correction, and for final confirmation, the extent of liquidity manipulation must be examined.
- After confirming Market Structure Shift (MSS), locate the CISD point and consider it a potential entry level;
- Identify the IFVG zone as an optimal entry and stop-loss area.
3# Entry Strategy
The choice between low-risk and high-risk entries depends on the level of confidence in the confirmation of absorbed liquidity within the market structure.
- Low-Risk Entry: Wait for price reaction and candlestick confirmation at key levels;
- High-Risk Entry: Enter at the first identified level without waiting for confirmation, accepting the possibility that MSS, CISD, and IFVG levels may become invalid.
4# Stop-Loss and Take-Profit
In situations where the market is seeking hidden liquidity, the stop-loss should not be placed at points directly positioned under the shadow of bulk orders.
- Stop-Loss: Place slightly below (for buys) or above (for sells) the IFVG zone or the previous high/low;
- Take-Profit: Set at liquidity pools or the next price gaps.
 How to trade using the combination of MSS, CISD, and IFVG
Trade Example With MSS, CISD, and IFVG
In this example, a Change in the Delivery of Price (CISD) is first observed, indicating a shift in the price delivery flow. Immediately afterward, a Market Structure Shift (MSS) forms as confirmation of a short-term trend reversal.
The combination of these two initial signals serves as a valid warning of changing market sentiment and provides a basis for evaluating trading opportunities.
As the price action continues, the market returns to an area identified as an Inverse Fair Value Gap (IFVG).
This zone represents where an imbalance between supply and demand has occurred, turning into a resistance level. The price re-entering this zone provided a point of final confirmation and the beginning of a bearish move.
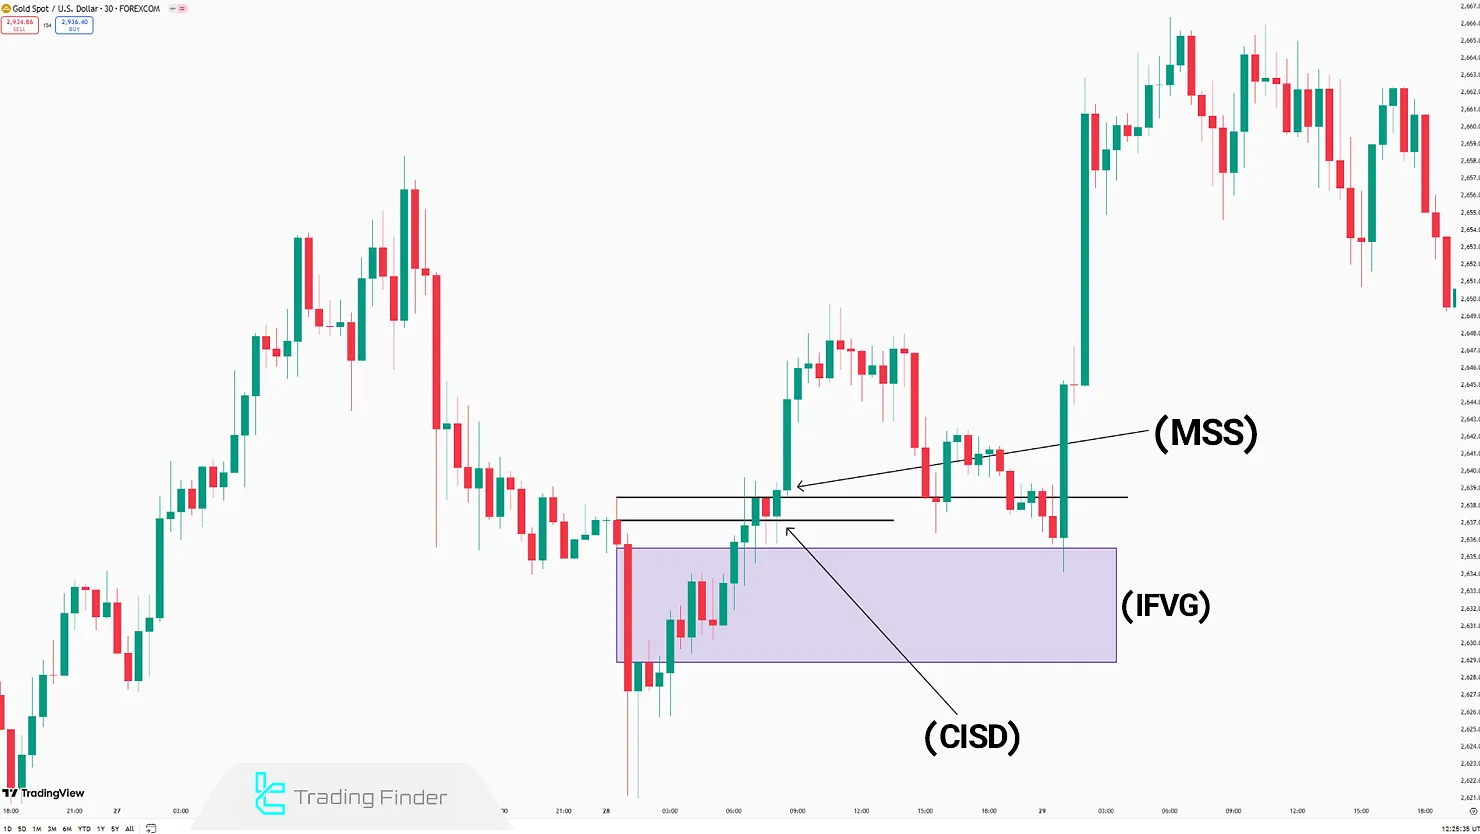
The combination of these three components transforms the trading structure from an early warning (MSS and CISD) into a confirmed entry point within the IFVG.
The outcome is a strong bearish move that creates a favorable opportunity for entering a sell trade.
This approach illustrates how signal confluence can increase decision-making accuracy, allowing the trader to enter based on multiple simultaneous confirmations rather than relying on a single factor.
Validity of MSS and CISD Signals in PD Array Zones
The value of CISD or MSS signals increases significantly when they occur inside PD Array zones such as Fair Value Gaps, Order Blocks, or Liquidity Pools.
A Bearish MSS or Bullish CISD forming in these zones reflects institutional money involvement, raising the probability of continuation.
Conclusion
By understanding the differences between MSS and CISD, traders can differentiate medium-term trend shifts and short-term price corrections, allowing for more precise trade execution.
On the other hand, the Inverted Fair Value Gap (IFVG) provides an optimal entry zone and stop-loss placement. By integrating these three ICT concepts, traders can strategically structure their trades based on liquidity flow and the supply-demand balance.


