


- TradingFinder
- Education
- Forex Education
Forex Education
Forex trading offers opportunities to profit from global currency fluctuations, but success requires solid education and a strategic approach. Forex education encompasses various learning paths, from understanding basic forex concepts to mastering advanced strategies and trading psychology. Trading Finder offers the best Forex educational content for traders with various levels of knowledge and experience. This content covers basic Forex-related topics, including Forex market hours, trading platforms, spreads, commissions, Forex brokers, currency pairs, and general Forex terms such as pips, leverage, and margin. Our team of expert creators doesn’t stop there and also creates content for professional traders. These advanced educational resources cover both fundamental and technical analysis concepts. From Economic calendar, interest rate decisions impacts, economic reports impact including NFP or GDP, Forex regulatory bodies such as SEC, FCA, and ASIC, to technical analysis tools and strategies, including price action trading, various indicators such as RSI, moving average, Bollinger bands, and technical patterns, Trading Finder cover everything a trader needs to know.
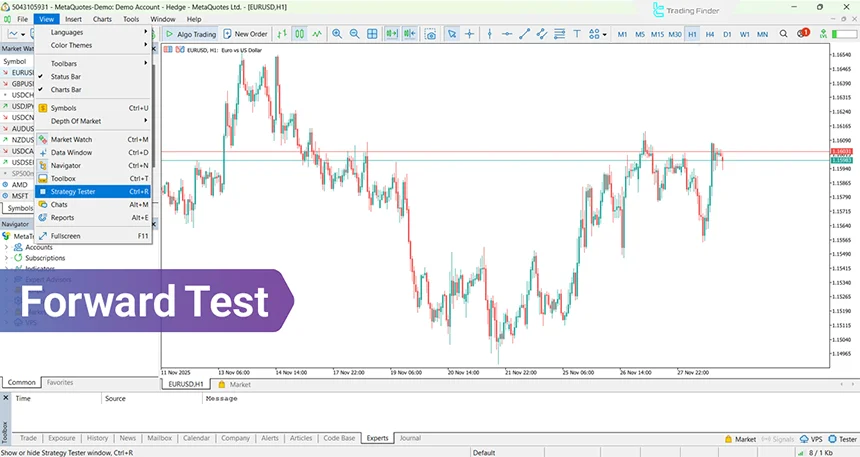
Forward Test: How to Forward Test Trading Strategies
Forward Test is a method for live evaluation of a trading strategy’s performance on real future data; a method that shows how...
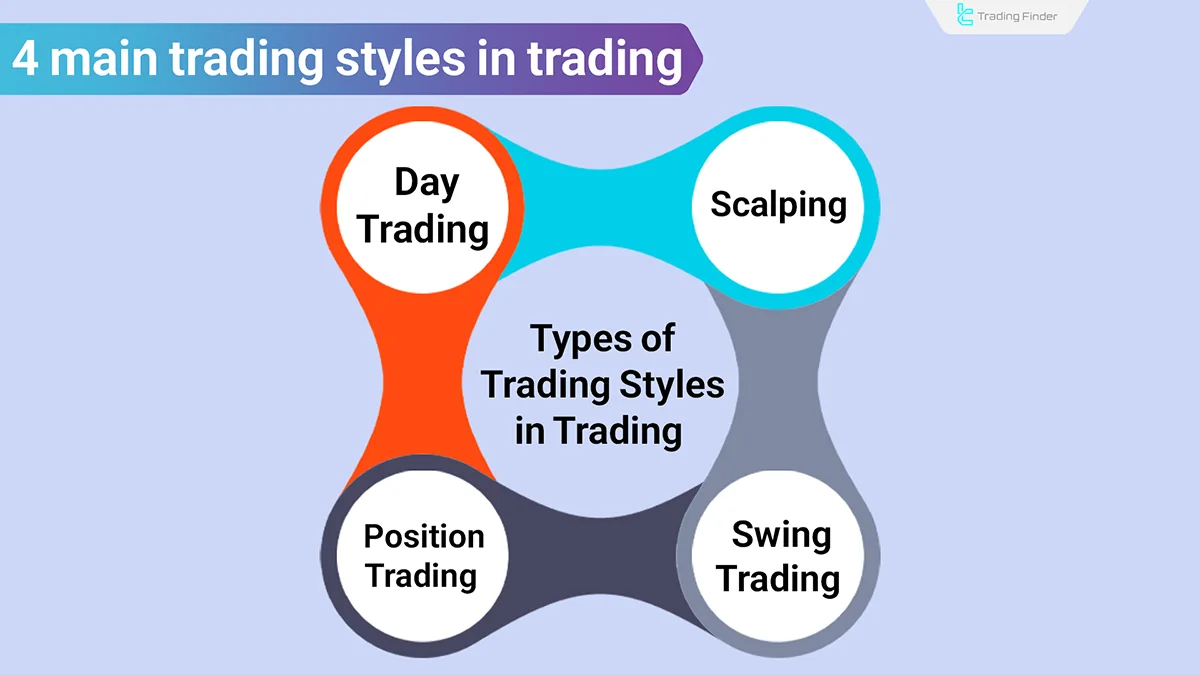
What Is a Trading Style? Types of Trading Styles in Financial Markets
Choosing a trading style helps establish discipline in trading and improves the success rate of a trading strategy. Therefore,...
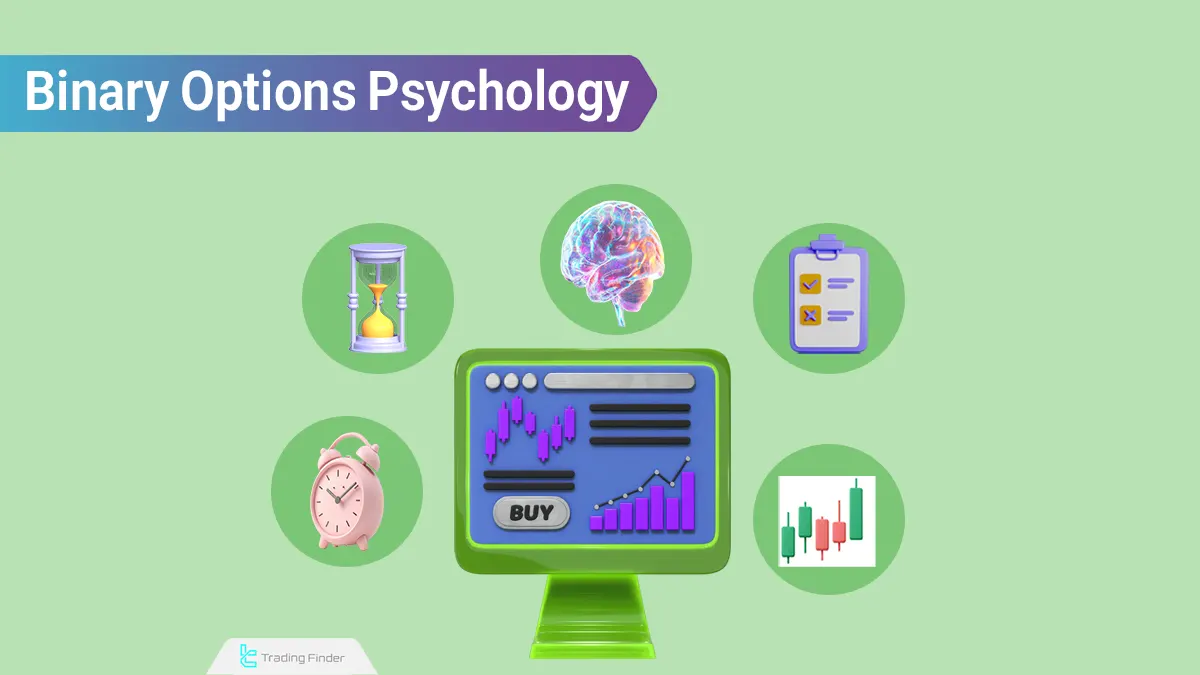
Trading Psychology in Binary Options: Mastering Emotions in Trading
Trading psychology in binary options forms the mental pillar of decision-making and determines the quality of a trader’s reaction...
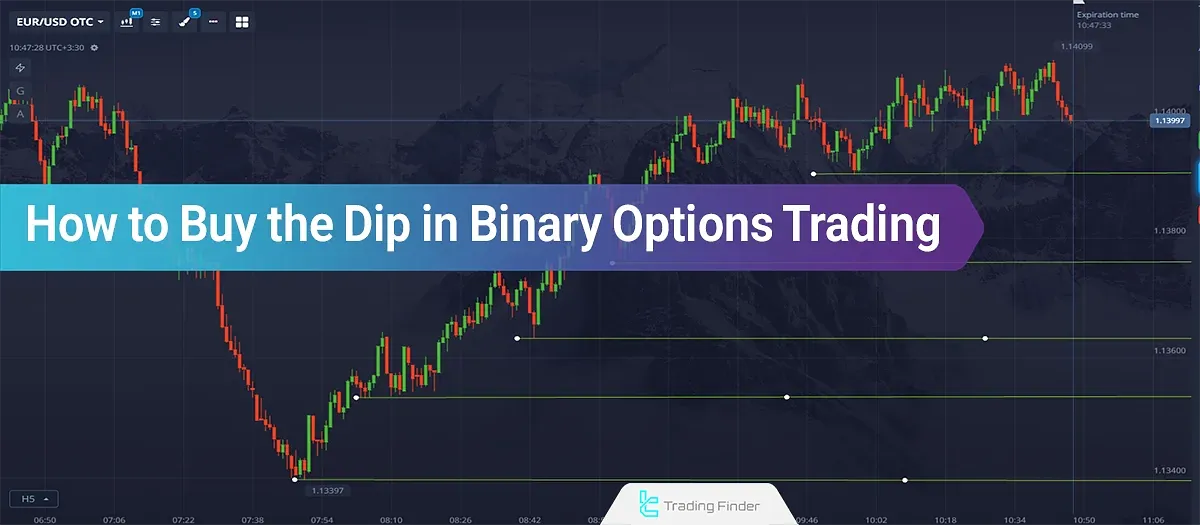
How to Buy the Dip in Binary Options Trading – Dip Buying Strategy
Analyzing price corrections in binary options begins with identifying the market trend and interpreting price behavior within its...
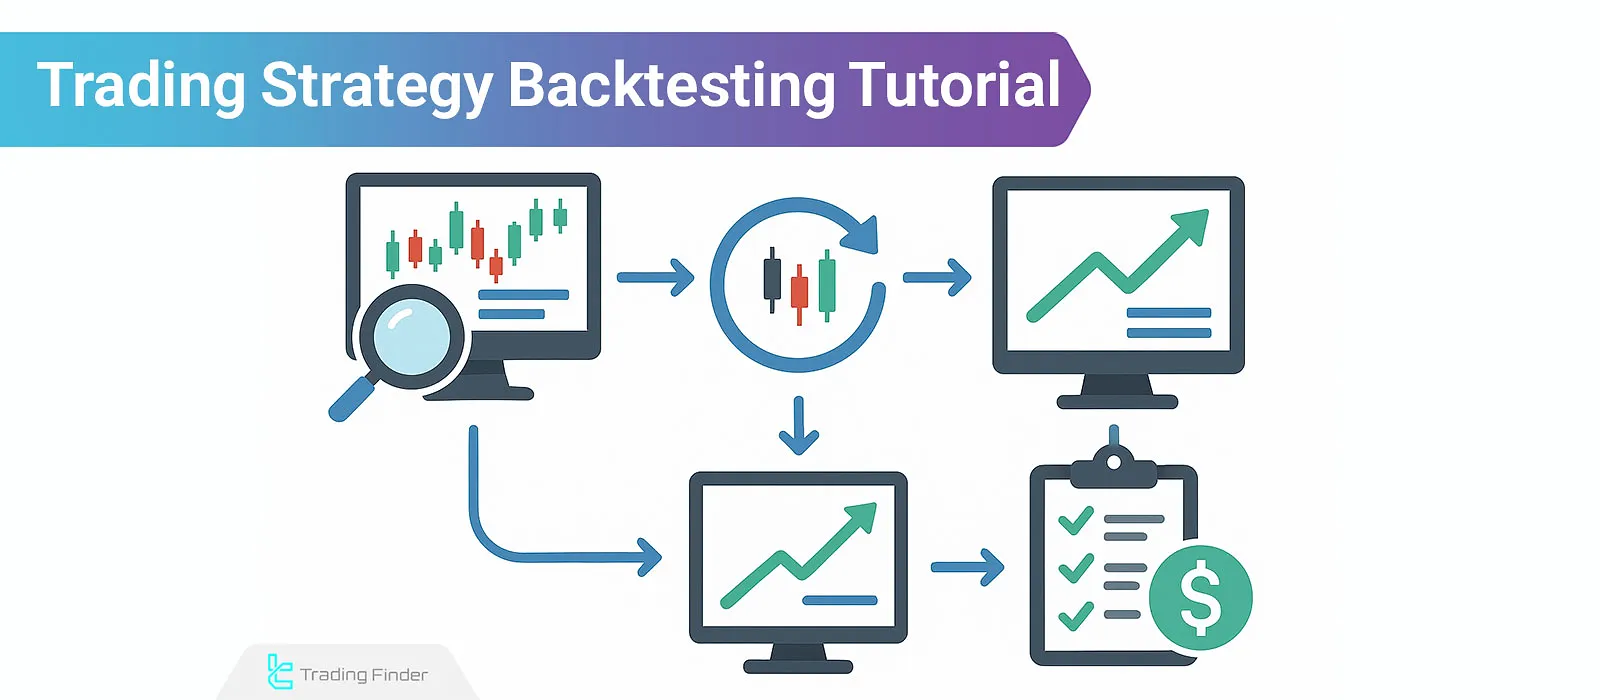
What is Back test? How to Backtest in 5 Steps
Operating in financial markets requires thorough analysis and the development of an effective trading strategy to achieve consistent...
Binary Trading Volume-How to Use Volume in Binary Options
Trading volume in binary options visualizes the intensity of market participation and reports the number of contracts exchanged and...
Risk Management in Binary Options; Training in Risk Management Binary Options
Risk Management in binary options means designing a set of rules and methods to control potential losses and protect capital. In...
Prop Trading Journal: Steps for Creation and Periodic Trade Review
In prop systems, every trader operates under the scrutiny of data and discipline. The goal, in addition to profit, is the ability...
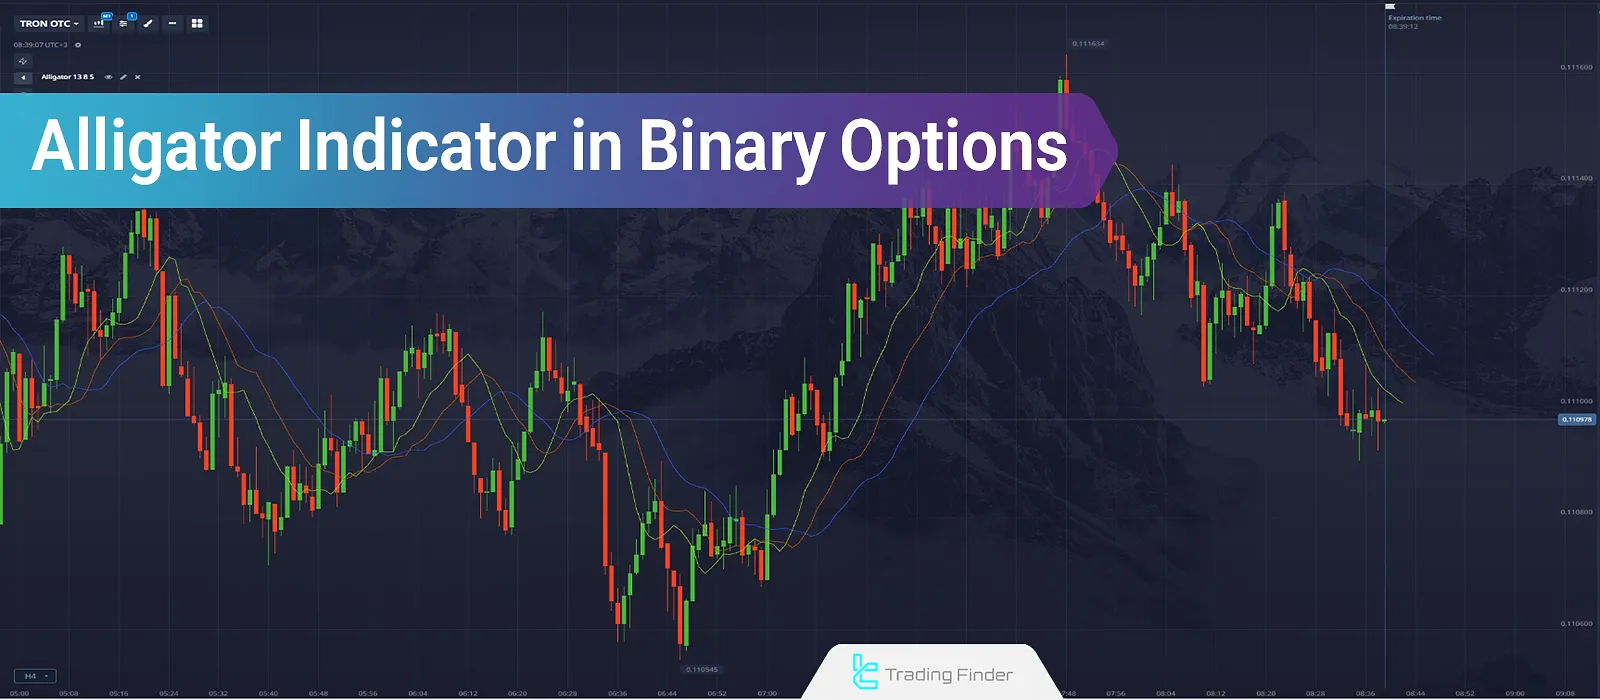
Alligator Indicator in Binary Options; Alligator Indicator Training
The Alligator Indicator in Binary Options is one of the well-known tools in technical analysis, specifically used to identify...
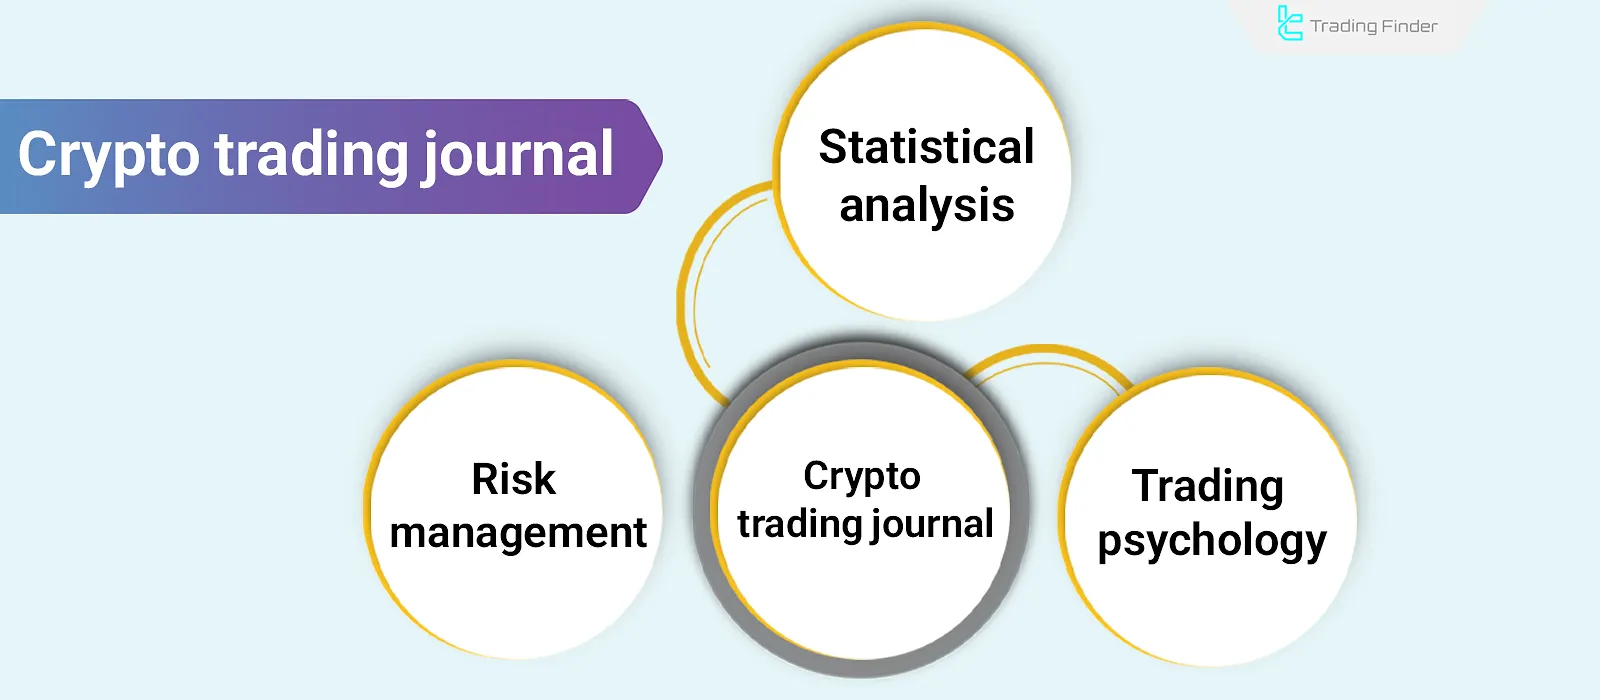
Crypto Trading Journal; Template & Best Tips
The cryptocurrency trading journal is an advanced, analytical tool that, by consistently recording quantitative and qualitative...
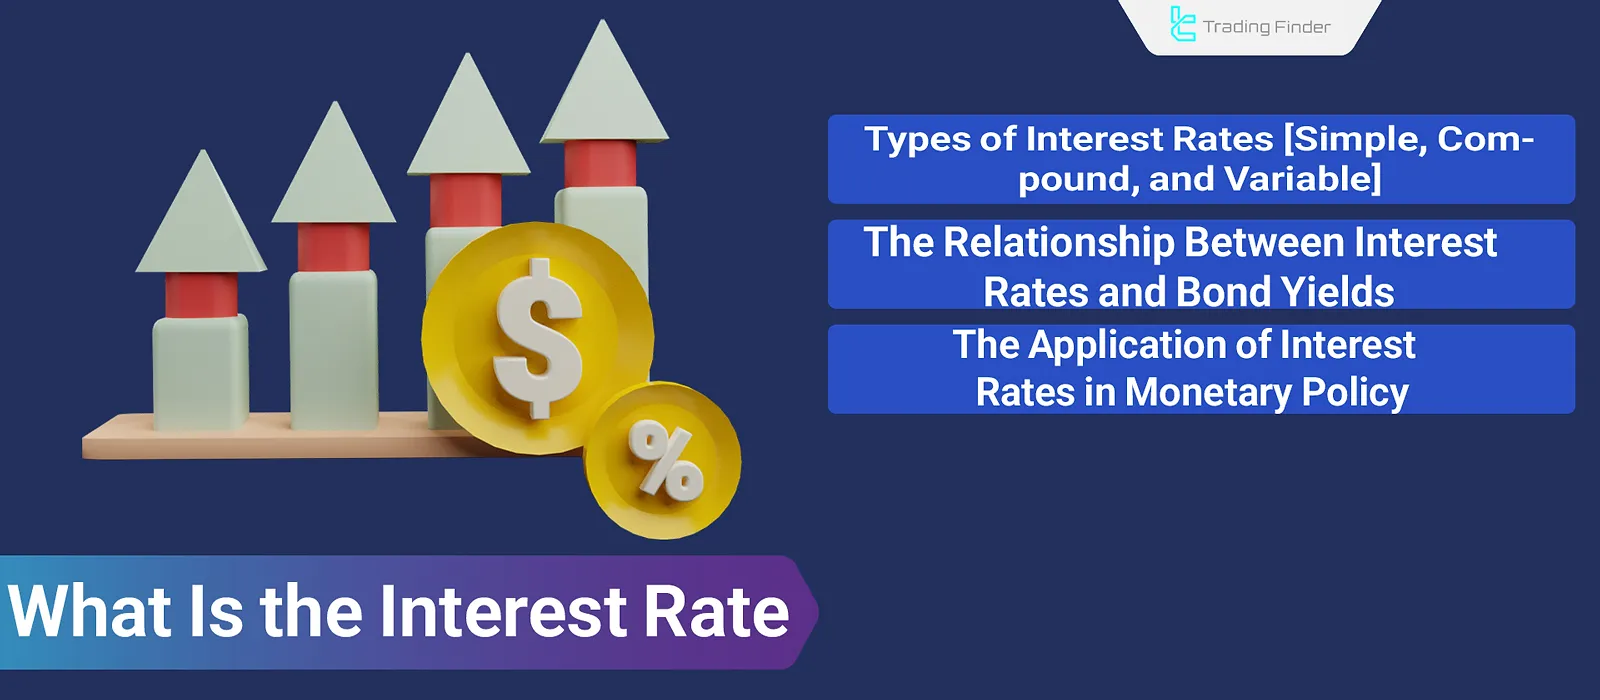
What Is the Interest Rate? The Impact of Interest Rates on the Economy and Forex Trading
The Interest Rate is the cost of borrowing money; that is, for borrowing money for a specified period, how much interest the...
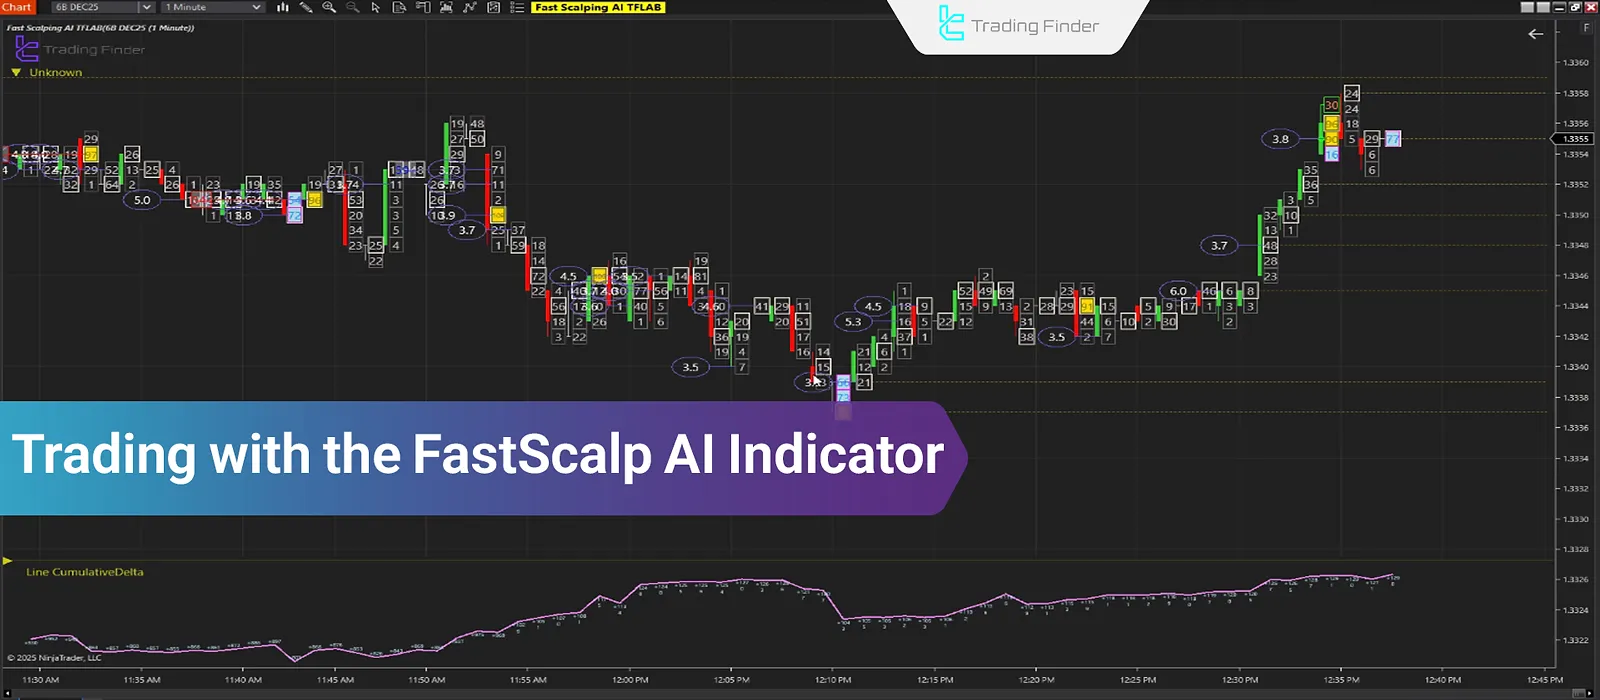
Fast Scalping AI Indicator; Trading with Order Flow Analysis in NinjaTrader
In scalping, any delay in detecting momentum shifts can lead to missed profitable opportunities. The Fast Scalping Indicator for...


