


Price trend analysis indicators like Moving Averages smooth out market fluctuations and reveal the overall price movement structure.
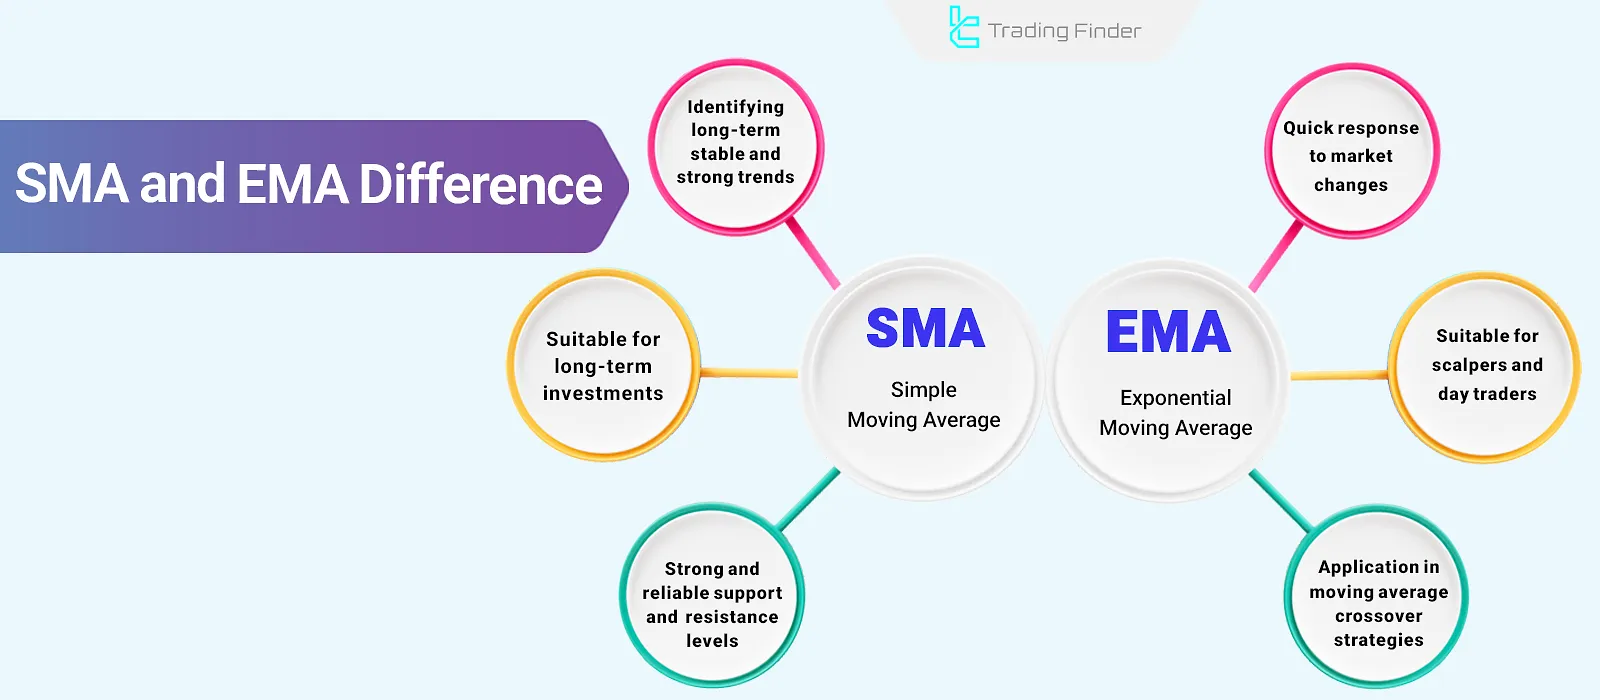
In this context, the Exponential Moving Average (EMA) reacts more quickly to short-term fluctuations, making it ideal for short-term strategies and scalping.
On the other hand, the Simple Moving Average (SMA) is slower in responding to price changes and is more commonly used for long-term and mid-term analyses.
Simple Moving Average (SMA)
The Simple Moving Average (SMA) calculates the average price over a specified time period and displays the general market trend in a smooth, linear fashion.
In this structure, all price data points carry equal weight, meaning that the effect of each candlestick or closing price is treated equally.
This characteristic causes the SMA to react more slowly to short-term fluctuations, showing a smoother behavior.
As a result, the primary use of the SMA is for long-term trend analysis and identifying the overall market structure.
SMA Calculation Formula
The SMA is calculated by summing the closing prices over a given period and dividing by the number of periods:
Advantages and Disadvantages of SMA
Using the Simple Moving Average comes with its advantages and disadvantages, as shown in the table below:
Advantages | Disadvantages |
Suitable for long-term investments | Delayed response to sudden market changes |
Ideal for identifying stable trends | Not suitable for volatile markets |
Easy to understand for beginner traders | Unable to detect trend strength |
Effective for identifying strong support and resistance levels | Slow signal generation |
Exponential Moving Average (EMA)
The Exponential Moving Average (EMA) places greater weight on recent price data, focusing more on the immediate market behavior.
Unlike the SMA, which treats all data points equally, the EMA gives more weight to newer data, making it more sensitive to short-term price changes.
Due to its faster response to real-time market fluctuations, the EMA is an excellent tool for short-term trading strategies, scalping, and precise entries in lower timeframes.
EMA Calculation Formula
The EMA calculation is more complex than the SMA and is done as follows:
Advantages and Disadvantages of EMA
The Exponential Moving Average has its own set of advantages and disadvantages, which are outlined in the table below.
For more information, you can also refer to the moving averages tutorial article on the investopedia.com website.
Table of pros and cons of the Exponential Moving Average (EMA):
Advantages | Disadvantages |
Quick response to sudden market changes | More complex for traders |
Suitable for scalpers and day traders | Can give false signals in weak trends |
Useful for moving average crossover strategies | Requires more precise adjustments for use in different strategies and tools |
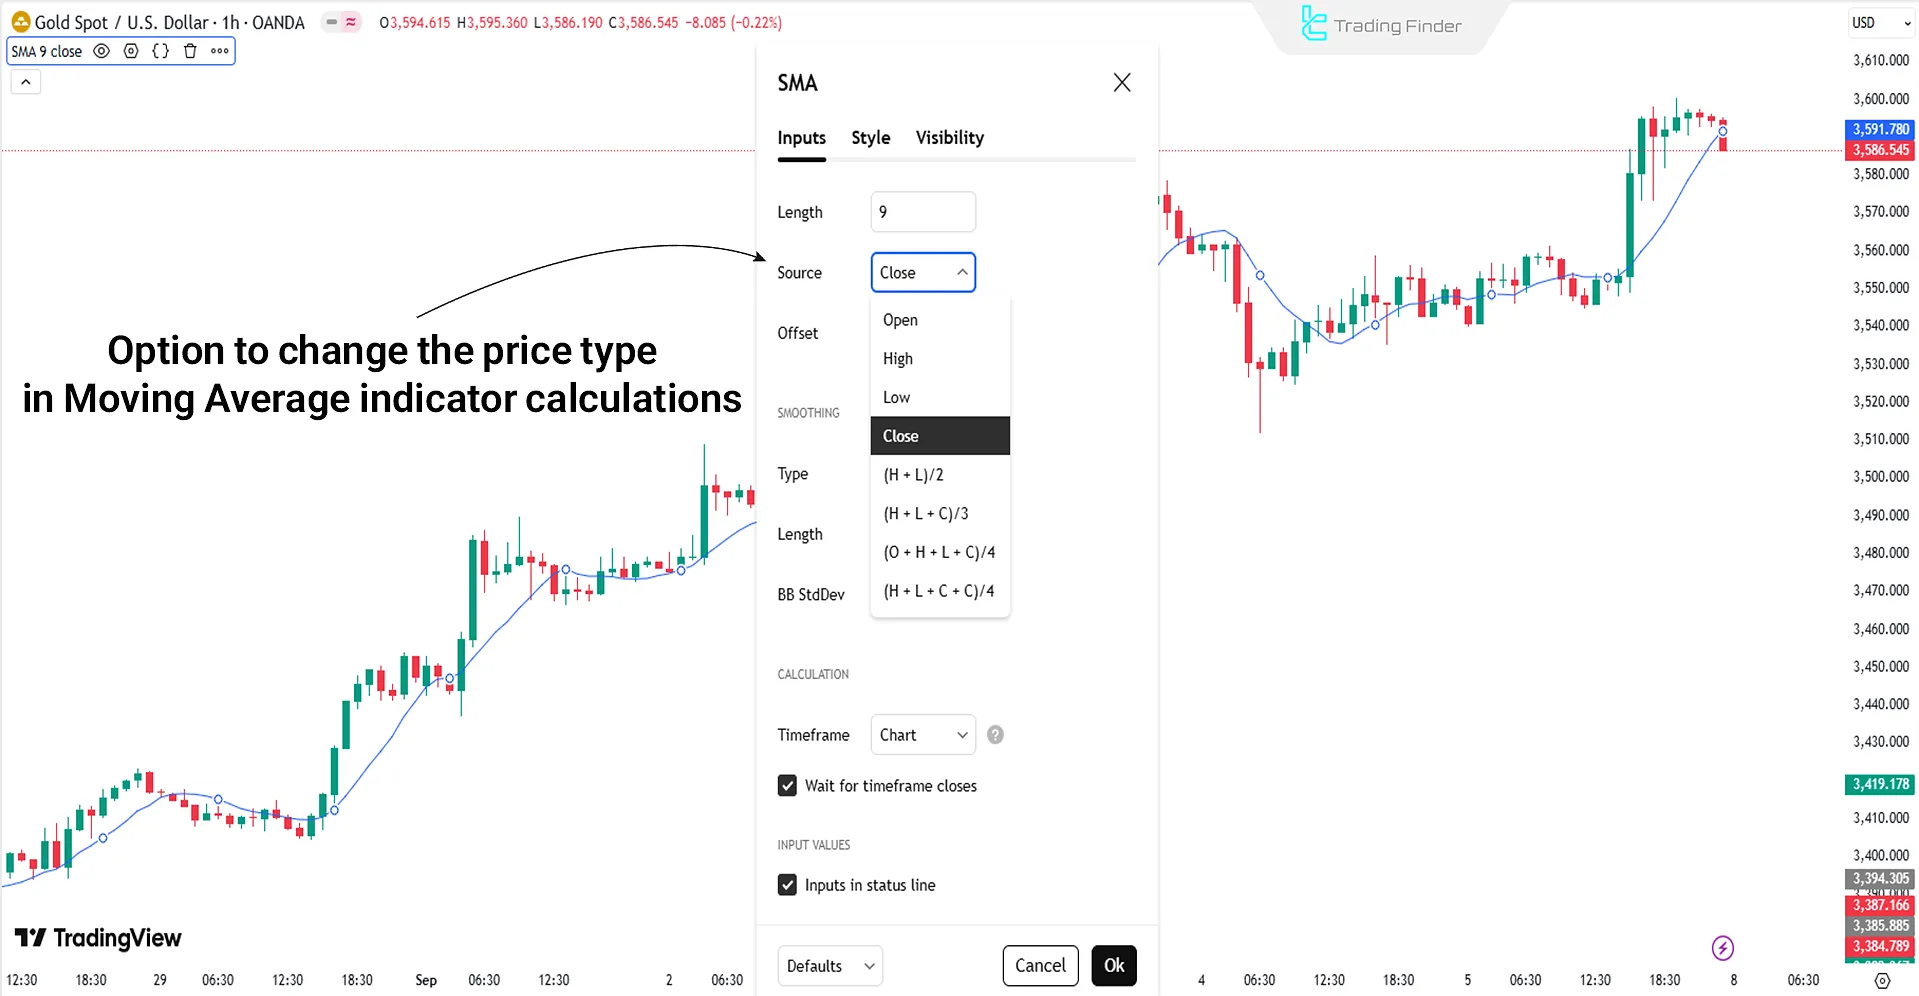
Choosing the price type in calculating the Moving Average
The Moving Average is not calculated solely based on the closing price (Close). Traders, depending on market conditions, use the opening price (Open), median (HL2), or typical price (HLC3).
The selected input type determines the sensitivity and responsiveness of the indicator. For example, an Exponential Moving Average (EMA) with HL2 input generates clearer signals and less noise in volatile markets compared to the Close input.
Types of inputs in calculating the Moving Average:
- Open price (Open): shows a quicker reaction to the initial changes of the candle;
- Closing price (Close): the default input of the indicator and the most common for trend analysis;
- Median (HL2): with the formula (High+Low)/2, reduces noise and is suitable for volatile markets; provides better balance compared to Open/Close;
- Typical price (HLC3): with the formula (High+Low+Close)/3, offers a more balanced view of the price range; a professional option for filtering out unreal price movements;
- HLCC4: with the formula (High+Low+Close+Close)/4, gives more weight to the closing price; has higher efficiency in identifying more realistic support and resistance levels in trending markets;
- OHLC4: with the formula (Open+High+Low+Close)/4, the most complete averaging input that considers all candle data and is valuable for professional algorithms and quantitative analysts (Quant).
Comparison between SMA and EMA
The comparison between Simple Moving Average (SMA) and Exponential Moving Average (EMA) is based on factors such as efficiency, timeframes, calculation methods, and target markets.
These differences make each moving average more suitable for specific trading strategies:
Parameter | Simple Moving Average (SMA) | Exponential Moving Average (EMA) |
Efficiency | Identifying long-term trends | Identifying short-term trends |
Suitable Timeframes | Larger timeframes | Smaller timeframes |
Calculation Method | Equal weight for past data | More weight on recent data |
Target Market | Calm and trending markets | Volatile and fast-moving markets |
To better review and understand the difference between Simple and Exponential Moving Averages, you can also refer to the educational video from the Ross Cameron - Warrior Trading channel on YouTube:
Golden Cross and Death Cross in Moving Averages
Moving Average Crosses are not merely an intersection on the chart; they represent a shift in the balance of liquidity power and market expectations. Below, we will examine two types of Moving Average Crosses:
Golden Cross
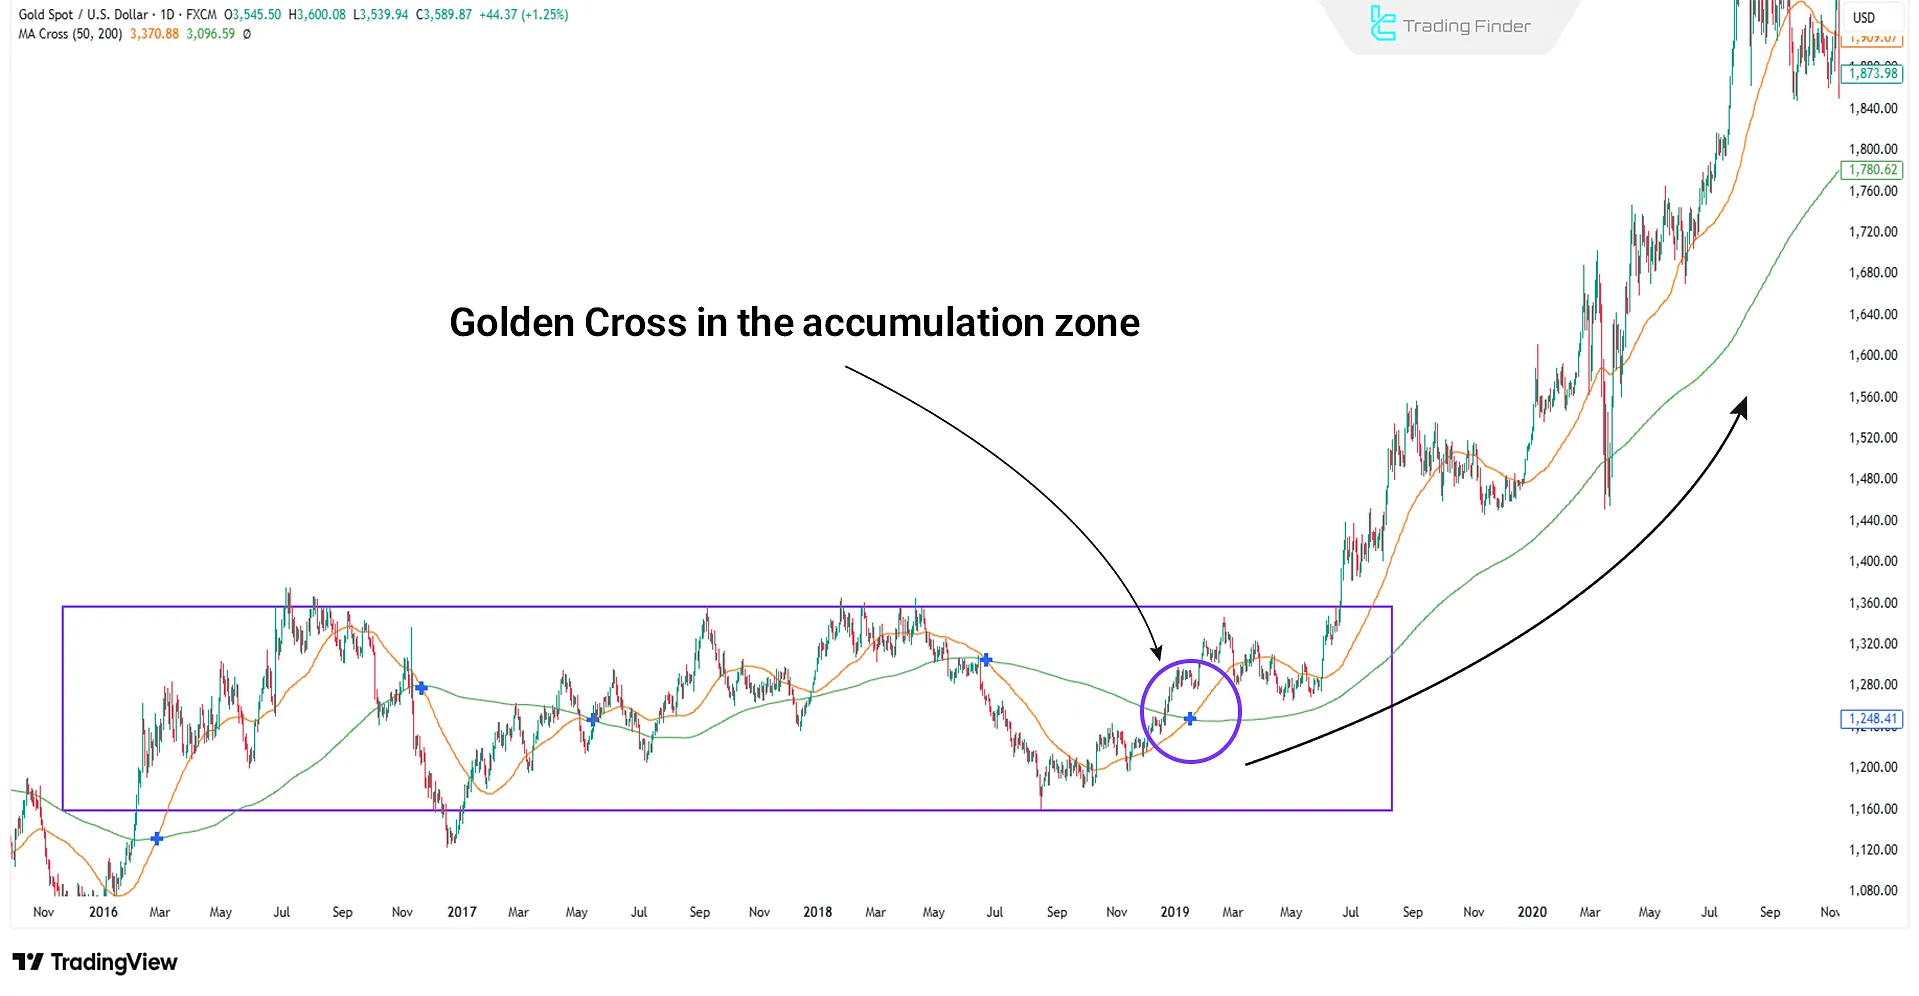
It occurs when a short-term moving average such as the MA50 moves above a long-term moving average like the MA200. This pattern signals the beginning of a new market phase and usually appears after periods of accumulation.
An increase in trading volume at the same time as this crossover confirms the inflow of fresh capital.
The Golden Cross is more of a tool for confirming a trend reversal than an ideal entry point, as professional traders have usually acted beforehand based on structural breaks (BOS/ChoCH).
Real example of a Golden Cross
The Golden Cross signal has the most value when it occurs in the context of accumulation and alongside rising volume.
Entering a trade immediately at the cross is often late; however, it holds strong credibility for managing medium- and long-term positions.
In the example below, you can see a valid Golden Cross on the daily timeframe:
Death Cross
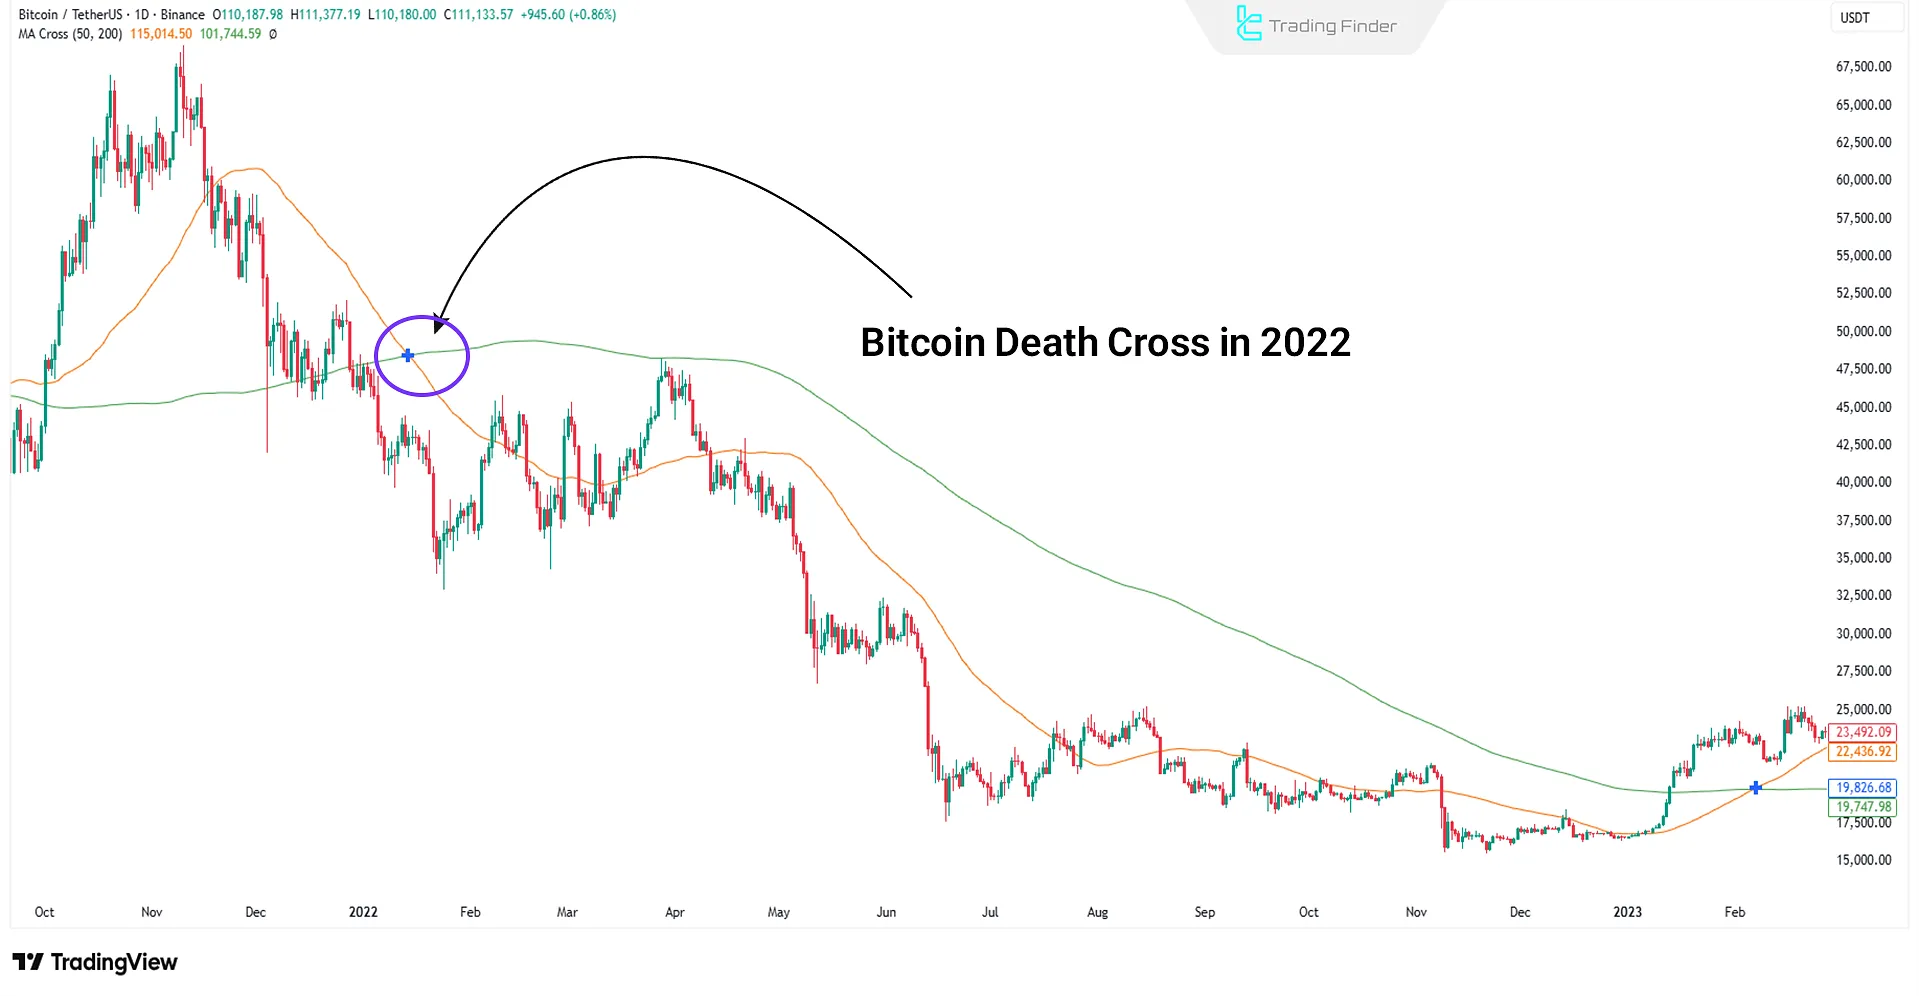
The Death Cross occurs when, for example, the MA50 penetrates below the MA200. This situation often forms in the middle of the distribution phase, where institutional investors are unloading their long positions and selling.
The Death Cross triggers selling pressure from retail traders, while in some cases, smart money players use the liquidity created to enter in the opposite direction.
As a result, this crossover alone does not mark the definite end of an uptrend but serves as a warning of a shift in liquidity structure and the transfer of power between buyers and sellers.
Real example of a Death Cross
The Death Cross signal is valid when it occurs with high volume and structural break. Exiting solely based on the cross is often late, but for long-term investors, it is a definitive warning of a market cycle change.
Professional traders use the Death Cross to confirm a bearish scenario and to adjust hedging or risk management strategies.
In the example below, you can see the Death Cross of Bitcoin on the daily timeframe in 2022, which was followed by a sharp price drop:
Comparison of Golden Cross and Death Cross
Below is a comparison of the Golden Cross and Death Cross based on the criteria of signal, liquidity context, volume confirmation, signal risk, false signals, and professional approach:
Criteria | Golden Cross | Death Cross |
Definition | Short-term moving average (MA50) crossing above the long-term moving average (MA200) | Short-term moving average (MA50) crossing below the long-term moving average (MA200) |
Signal | Indicates the start of a long-term uptrend | Indicates the start of a long-term downtrend |
Liquidity context | Usually after the accumulation phase and liquidity absorption by whales | Often after the distribution phase and unloading of institutional positions |
Volume confirmation | Increase in buying volume to strengthen the trend | Increase in selling volume or liquidation of long positions |
Signal risk | Late entry; part of the main move has already occurred | Late exit; much of the decline has already happened |
False signals | In ranging markets, it may only be a short-term correction | May simply be a correction in an uptrend |
Professional use | Used to confirm market phase change | Used as a warning of liquidity structure change, not an absolute sell signal |
Professional approach | Combine with order block, BOS/CHOCH, and volume confirmation | Combine with liquidity zones, volume, and higher timeframes |
3 Moving Average Cross with Alert Indicator (3MA Cross with Alert)
The 3MA Cross with Alert indicator in the MetaTrader 5 platform is a specialized tool for identifying market trends and reversal points.
This tool consists of three moving averages with periods of 10, 20, and 40, calculated as fast, medium, and slow lines.
The three-layer structure of the indicator provides greater accuracy compared to simpler models and displays Buy and Sell signals with higher clarity. Its features and categories are as follows:
- Platform: MetaTrader 4 and 5
- Indicator type: Reversal + Breakout
- Skill level: suitable for beginners
- Trading style: day trading and scalping
- Timeframe: multi-timeframe
- Target markets: forex, cryptocurrency, stocks, indices, and commodities
In addition to generating signals, this indicator also specifies the exact moment of moving average crossovers with arrows and graphical symbols, allowing faster analysis for traders. This tool can be used in both MetaTrader 4 and 5:
Its performance in trends works as follows:
- Uptrend: crossover of the three moving averages and candle closing above the lines issues a bullish signal;
- Downtrend: price moving below the lines and candle closing under the averages issues a bearish signal.
In the settings of the 3MA Cross with Alert indicator, the following options are available to users:
- Fast/Medium/Slow MA: determine the period, calculation method, and price type;
- Alerts: text, sound, and email notifications;
- Arrows: display arrows for fast–slow, fast–medium, and medium–slow crossovers.
The 3MA Cross with Alert tool, by combining three moving averages, reveals market trends and structural changes.
With visual signals and an alerting system, this indicator is a practical tool for day trading and scalping in Forex, Crypto, and Stocks markets, and it serves as a complement to both technical and fundamental analysis.
The appropriate timeframe for using SMAs and EMAs
Due to its slower response to price movements, the simple moving average (SMA) is more suitable for analysis in higher timeframes, such as the one-hour, four-hour, and daily charts.
On the other hand, the Exponential Moving Average (EMA) performs more accurately in smaller timeframes, such as 30-minute, 15-minute, 5-minute, and even 1-minute charts, due to its sensitivity to short-term price changes.
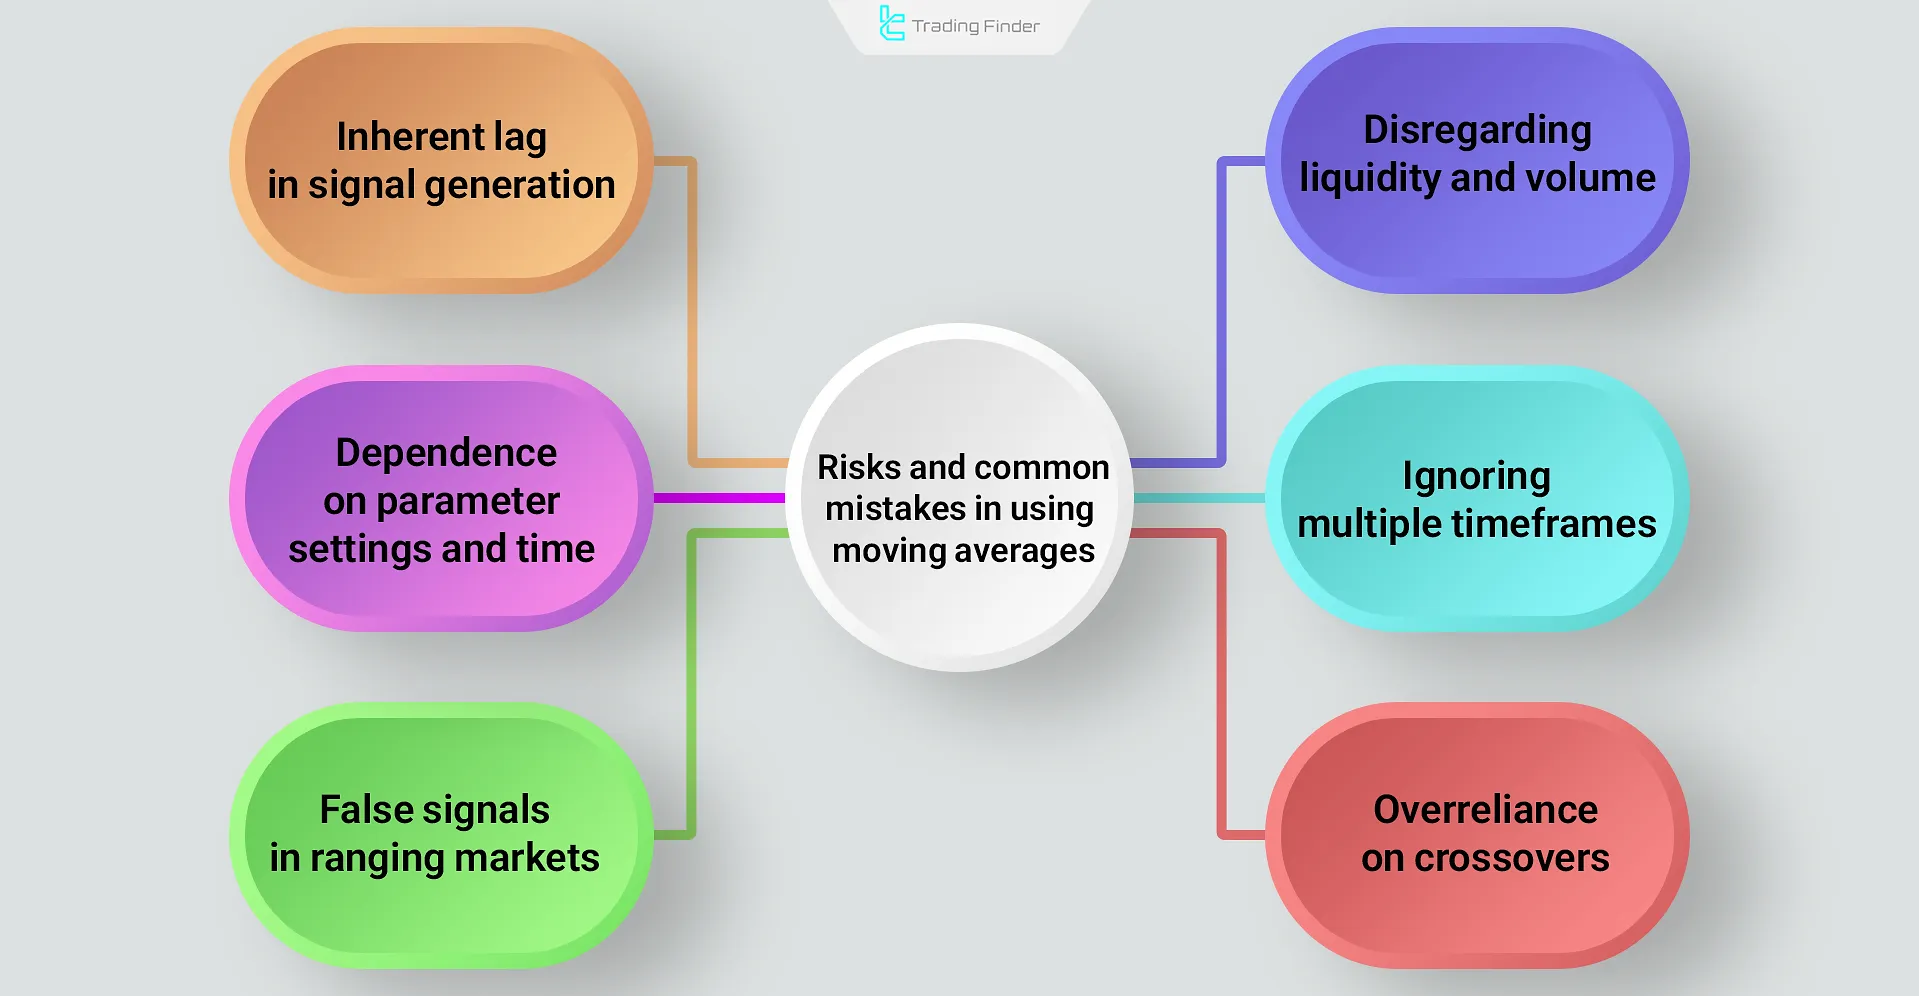
Risks and common mistakes in using moving averages
Moving averages are effective tools for smoothing price, but a misunderstanding of their nature can lead to costly mistakes. The most important risks:
- Inherent lag: signals are generated later than the actual market move; entering positions solely after a crossover is usually late;
- Dependence on parameters: custom settings (such as MA20 or MA50) may create inconsistent results; excessive optimization (Curve Fitting) in the past becomes invalid in the future;
- False signals in ranging markets: frequent crossovers in sideways markets cause whipsaws and repeated losses;
- Disregarding liquidity and volume: MAs lack information about order flow; volume and context confirmation are essential;
- Ignoring multiple timeframes: a positive signal on the daily may contradict the weekly;
- Overreliance on crossovers: the Golden Cross or Death Cross are not definitive ends or beginnings of trends; they often appear in the middle of a cycle.
Conclusion
In technical analysis, the Simple Moving Average (SMA) is ideal for identifying long-term trends and evaluating the general market direction due to its smoother structure and slower reaction to short-term fluctuations.


