


The price of any asset in the market is determined by the balance between supply and demand: Supply refers to the quantity of a good or asset in the market. When supply exceeds demand, prices fall.
Demand refers to buyers' willingness to purchase an asset at the market price. When demand surpasses supply, prices rise.
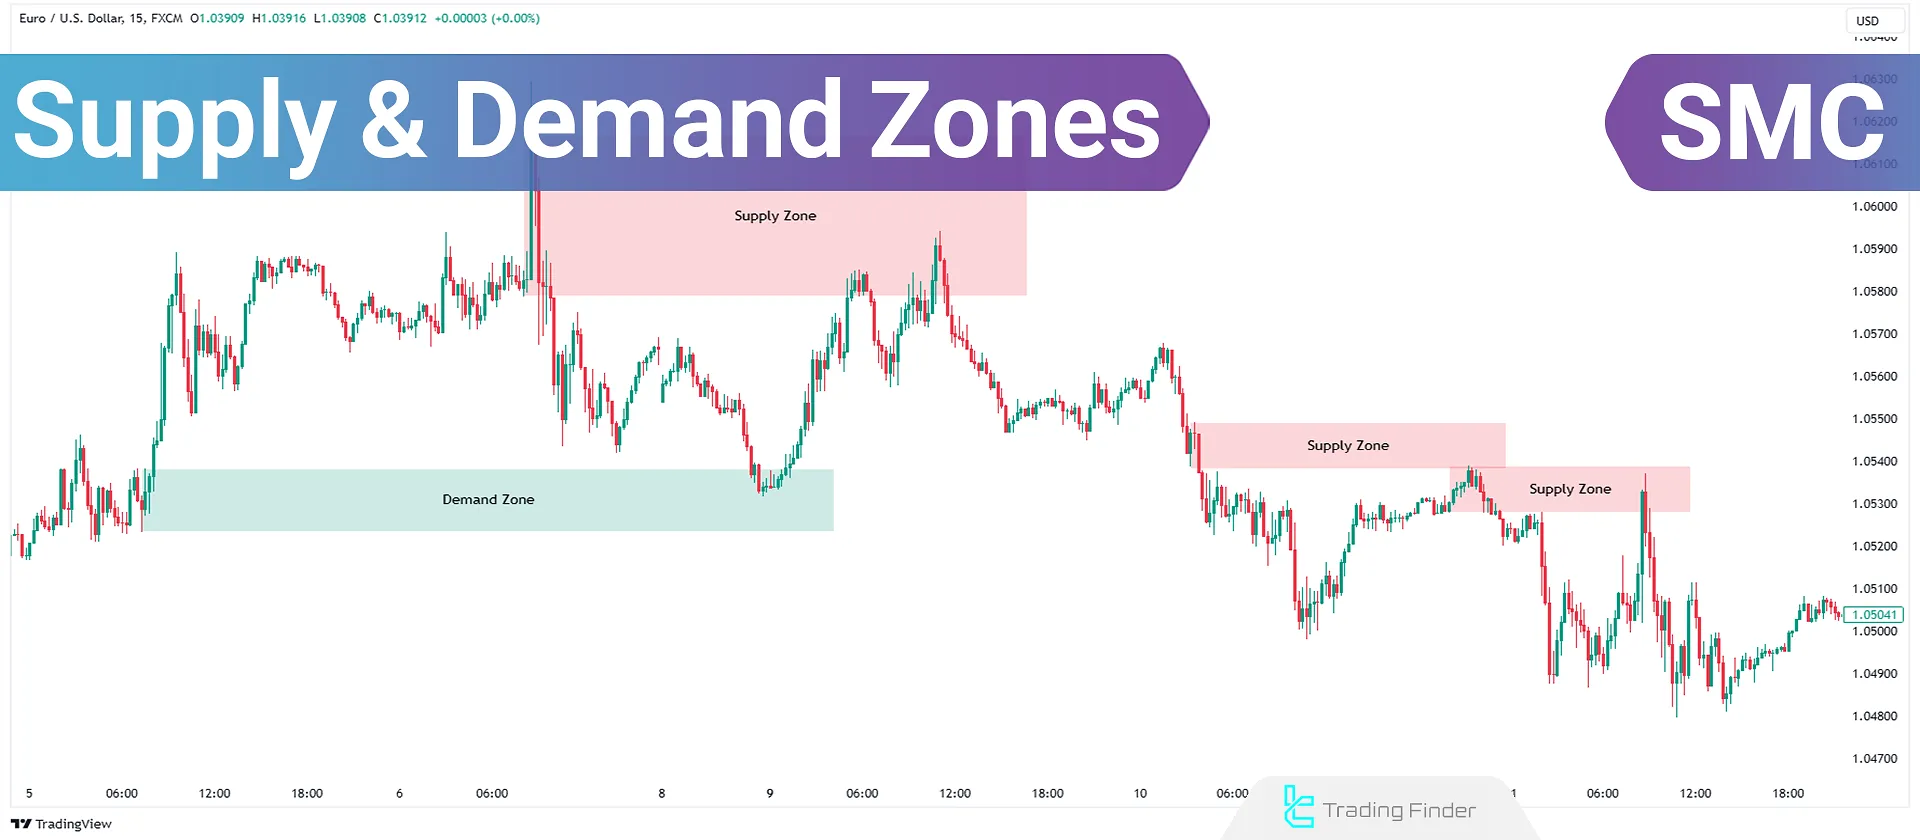
What are Supply and Demand Zones?
In SMC trading and price action analysis, supply and demand zones are defined as:
- Supply Zone: Price region where abundant sell orders increase supply, causing prices to drop;
- Demand Zone: Price region where abundant buy orders increase demand, causing prices to rise.
Why Are Supply and Demand Zones Important?
Supply and demand Zones are crucial areas on the price chart for identifying reversal and trend continuation trades. These zones often trigger rapid market reactions.
According to Smart Money concepts, institutional traders enter these zones in significant volumes, creating increased supply or demand.
Traders should wait for the market to test these zones before executing buy or sell trades, following the footprints of institutional traders and Smart Money.
Difference Between Strong and Weak Supply and Demand Zones
Not all supply and demand zones have the same strength. Some zones are strongly supported or controlled by smart money, while others are weak and less reliable.
Identifying this difference plays a very important role in increasing trade win rate. In the table below, different types of supply and demand are compared:
Comparison factor | Strong demand | Weak demand | Strong supply | Weak supply |
Price departure strength | Fast impulse with long and strong candles | Slow and corrective movement | Sharp and explosive drop | Gradual and low-power decline |
Market momentum | Very high | Weak | Very high | Weak |
Imbalance condition | Clear and wide | Shallow or unclear | Severe and deep | Weak or consumed |
Market structure (BOS/MSS) | Valid break of high | No structure break | Valid break of low | No structure break |
Number of zone touches | First touch | Multiple touches | First touch | Multiple touches |
Probability of price reaction | Very high | Medium to weak | Very high | Weak |
Trading validity | Excellent for primary entries | Only suitable for scalping | Excellent for trend-selling entries | Mostly for filtering fake moves |
Risk of zone failure | Low | High | Low | High |
Liquidity behavior | Heavy absorption of buy-side liquidity | Gradual distribution | Heavy absorption of sell-side liquidity | Full consumption of liquidity |
Best trading application | Smart entry in an uptrend | Short-term pullbacks | Sell entries in a downtrend | Identifying seller traps |
How to Identify Supply and Demand Zones
Identifying supply and demand zones requires a precise understanding of market structure; meaning that the trader must first identify the dominant trend, price highs and lows, and areas of structure break.
Supply zones usually form in areas where strong selling pressure causes price to decline, while demand zones are created at points where, with the entry of buying strength, price rises sharply.
These zones are often characterized by fast moves, strong candles, and a decisive departure from the zone accompanied by price imbalance, and they are used as a foundation for professional entry and exit decision-making.
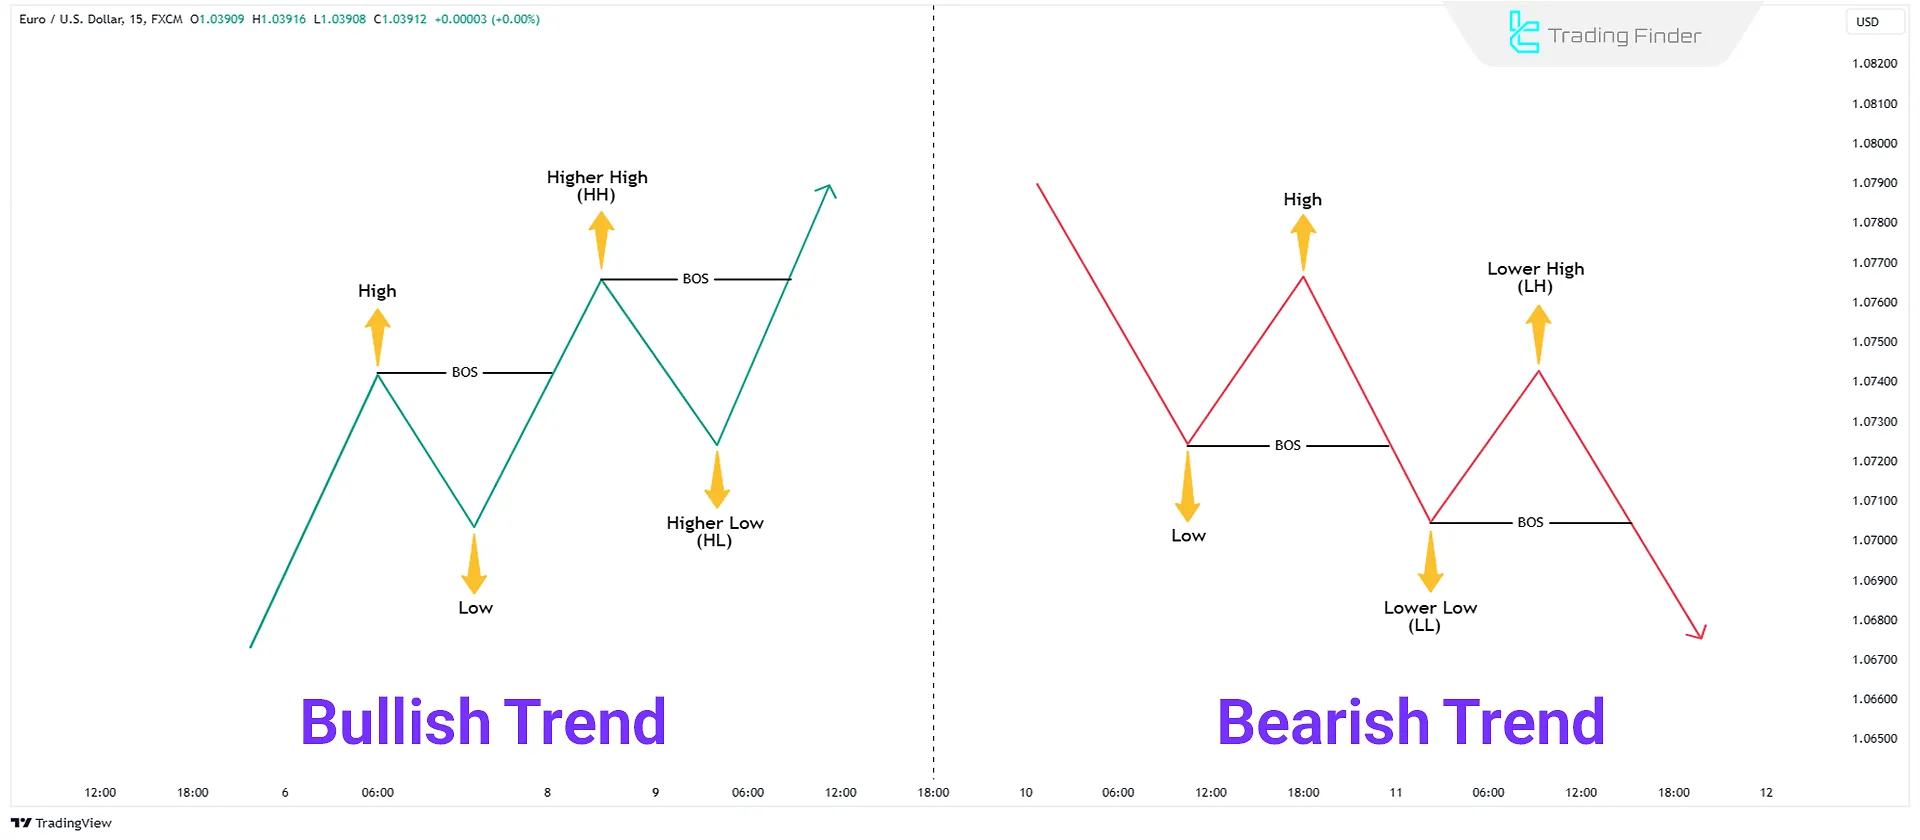
Break of Structure (BOS)
When the market trends, it breaks previous structures in the trend direction and continues moving. This phenomenon is called a Break of Structure (BOS):
- In an uptrend, the market breaks the previous high and creates a Higher High (HH).
- In a downtrend, the market breaks the previous low and creates a Lower Low (LL).
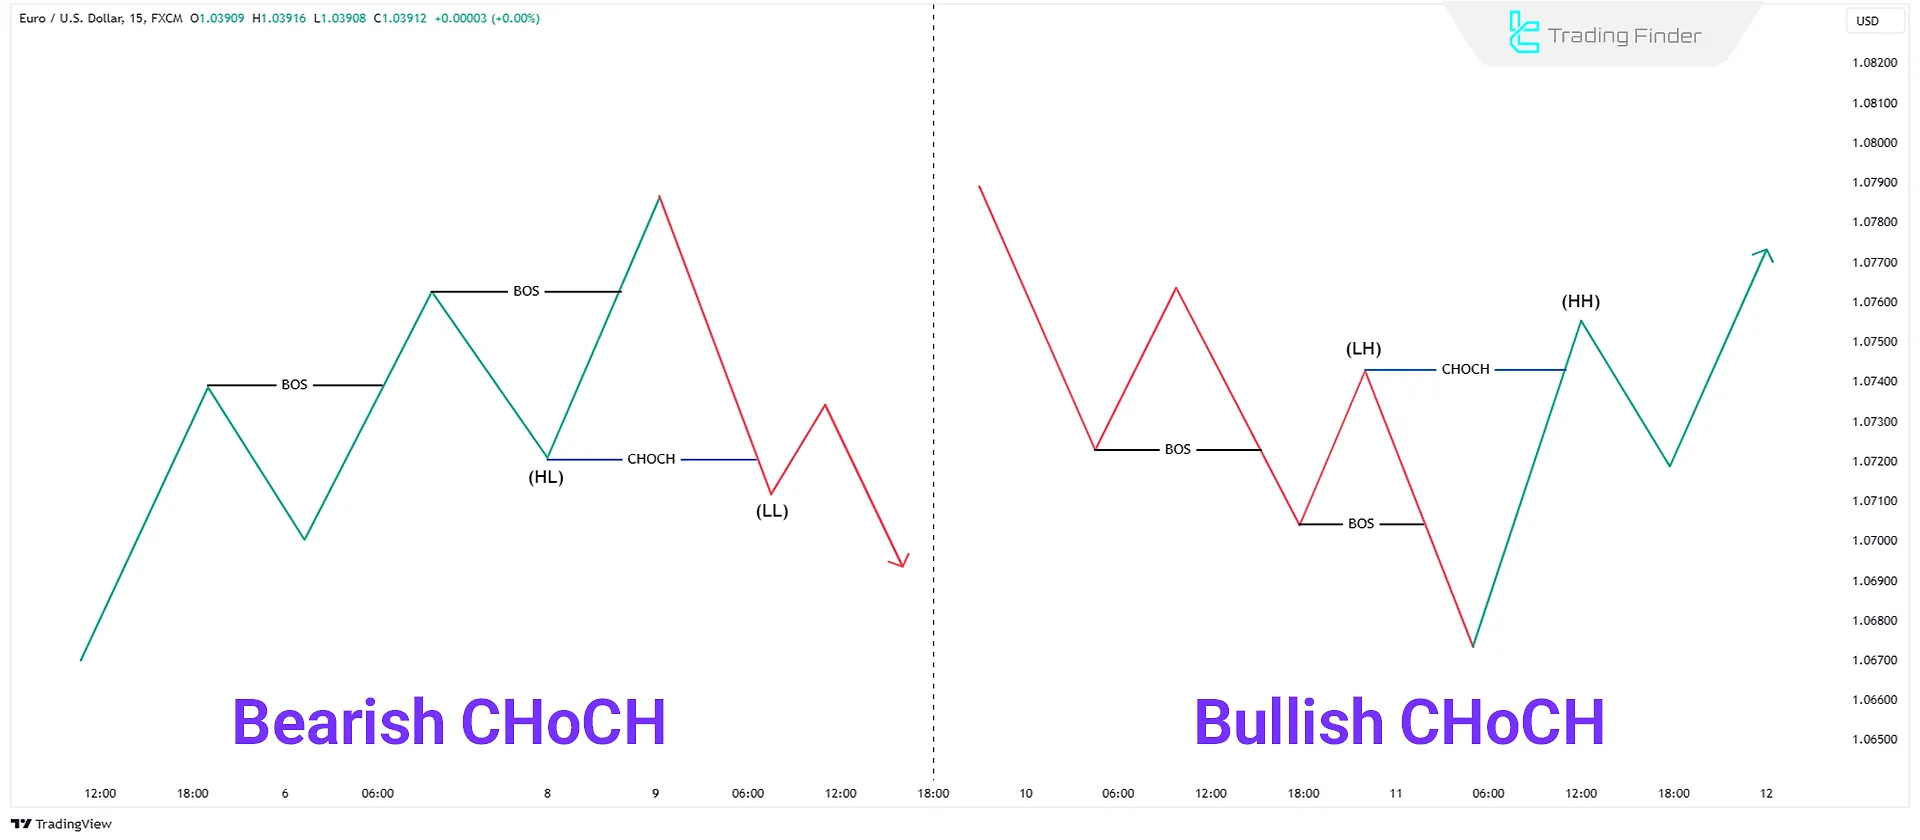
Change of Character (CHoCH)
Change of Character (CHoCH) indicates a market trend shift. It occurs when the market transitions from an uptrend to a downtrend or vice versa:
- In a shift from a downtrend to an uptrend, the previous Higher Low (HL) is broken, forming a new Higher High (HH);
- In a shift from an uptrend to a downtrend, the previous Higher Low (HL) is broken, forming a new Lower Low (LL).
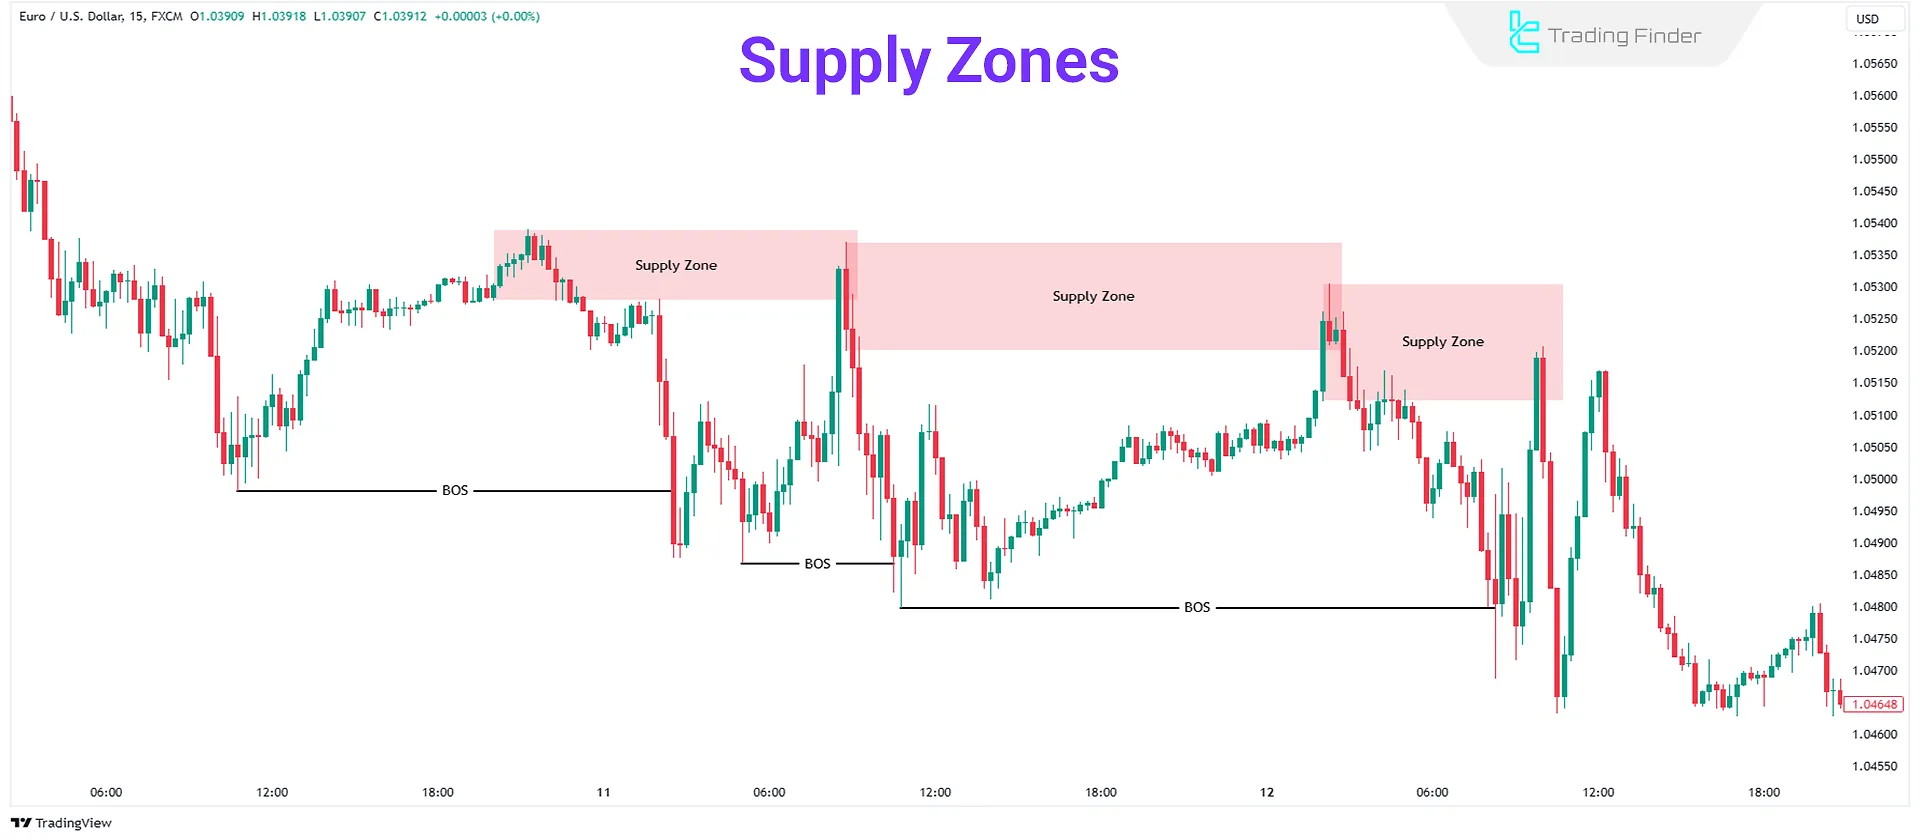
Identifying Supply Zones
A Supply Zone is a market area where selling pressure causes prices to fall rapidly. These zones usually appear during downtrends.
Supply zones are formed during pullbacks before a CHOCH or BOS. Following this, prices drop sharply. These pullbacks may consist of one or multiple bullish candles.
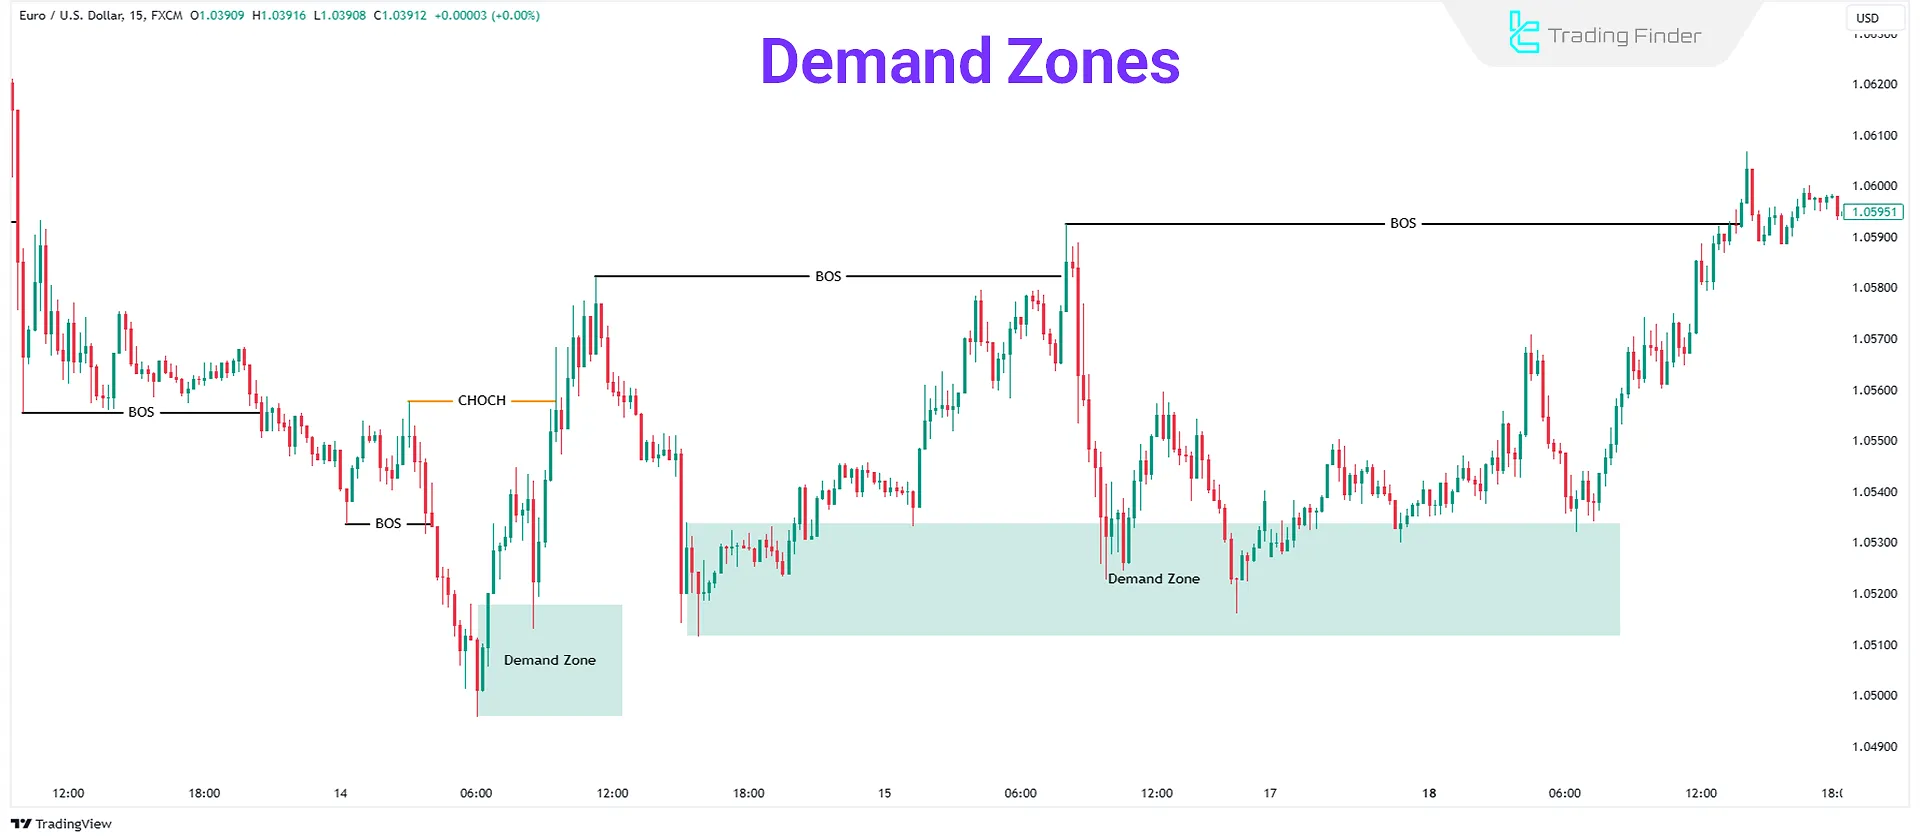
Identifying Demand Zones
Demand Zone is a market area where buying pressure causes prices to rise rapidly. These zones typically form during uptrends.
Demand zones usually form during pullbacks before a CHoCH or BOS. Following this, prices rise sharply. These pullbacks may consist of one or multiple bearish candles.
How to Trade Using Supply and Demand Strategy
To trade using the supply and demand strategy, the market trend must first be identified; in an uptrend, the focus is on demand zones for buying, and in a downtrend, the focus is on supply zones for selling.
Identifying strong zones and aligning them with market structure increases trade accuracy and validity.
Trading Using the Supply and Demand Strategy in an Uptrend
In uptrends, the trader’s primary focus is on identifying valid demand zones in the direction of market movement so that, by aligning with the dominant liquidity flow, low-risk entries with an appropriate risk-to-reward ratio can be executed.
To enter trades in uptrends, the following steps should be followed:
- After a bullish CHOCH or BOS, identify the demand zone;
- When the price retraces and approaches the demand zone, execute a buy;
- If the demand zone is large, wait for the market to test at least 50% of it with additional confirmations, such as lower timeframe structure changes;
- Place the stop loss a few pips below the demand zone.
Trading Using the Supply and Demand Strategy in a Downtrend
In a downtrend, by identifying a supply zone, waiting for price to retrace, obtaining the necessary confirmations, and setting an appropriate stop loss, a sell trade can be entered based on the supply and demand strategy.
The detailed steps for entry in a downtrend are as follows:
- After a bearish CHOCH or BOS, identify the supply zone;
- When the price retraces and approaches the supply zone, execute a sell;
- If the supply zone is large, wait for the market to test at least 50% of it with additional confirmations, such as lower timeframe structure changes;
- Place the stop loss a few pips above the supply zone.
Entry Confirmation Using Supply and Demand Zones
Price touching a supply or demand zone alone is not sufficient to enter a trade. To reduce errors and increase trade accuracy, it is necessary to wait for entry confirmation on a lower timeframe.
The most important entry confirmations include:
- Formation of a break of structure (BOS) on a lower timeframe
- Formation of a change of character (CHOCH)
- Formation of a bullish engulfing candle in a demand zone
- Formation of a bearish engulfing candle in a supply zone
The article on training supply and demand zones in Smart Money (SMC) on the writofinance.com website provides supplementary material about the structure of these zones, and interested readers can use this content to deepen their analysis.
Example of Entry Confirmation Using Supply and Demand Zones
For example, if price enters a demand zone but on lower timeframes such as 5 or 15 minutes there are still no valid signs of a structure break, trend change, or the formation of a reversal pattern, entering a trade at this stage is considered an early entry.
In such conditions, the market has not yet provided the necessary confirmation for a reversal, and price may continue its downward movement.
As a result, the probability of the stop loss being triggered increases, and trade risk rises significantly.
The best approach in this situation is to wait for additional confirmations from market structure and candlestick behavior in order to enter with greater confidence.
The educational video from the The Moving Average channel on YouTube provides supplementary information about supply and demand zones and helps build a more precise understanding of the structure of these zones.
Best Timeframe for Identifying Zones
Supply and demand zones that form on higher timeframes such as the 1-hour, 4-hour, and daily charts have higher analytical validity compared to lower timeframes.
The entry of large capital and the direct activity of institutional traders within these time windows is considered the main reason for the increased reliability of these zones. Advantages of using higher timeframes:
- Reducing market noise
- Higher accuracy of price reactions
- More logical stop-loss placement
- Greater alignment with the primary market structure
A common mistake among traders is drawing zones only on the 5- and 15-minute timeframes, which leads to chart clutter and reduced analytical accuracy.
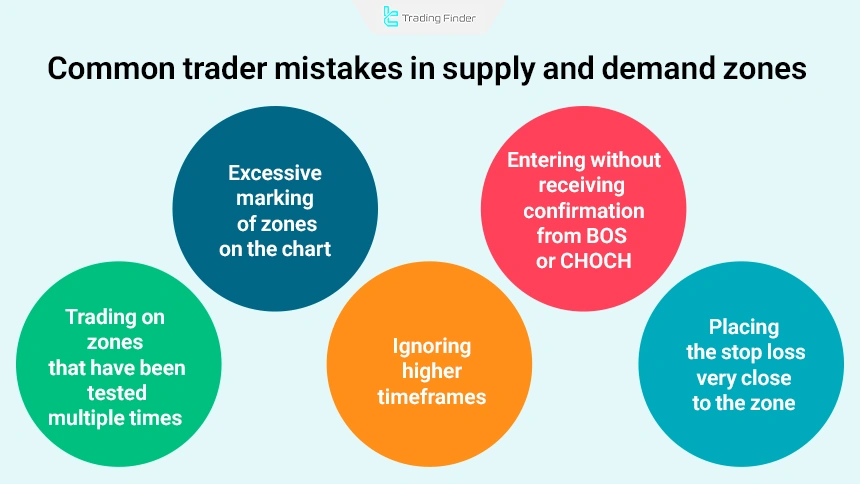
Common Trader Mistakes in Supply and Demand Zones
Many traders, despite being familiar with supply and demand zones, incur losses due to certain common mistakes. The most important mistakes include:
- Excessive marking of zones on the chart
- Entering trades without confirmation from BOS or CHOCH
- Trading zones that have been tested multiple times
- Ignoring higher timeframes
- Placing the stop loss too close to the zone
Supply and Demand Zones Indicator in MetaTrader
The Supply and Demand Zones indicator on the MetaTrader platform is one of the advanced technical analysis tools that, by focusing on liquidity behavior, intelligently identifies key supply and demand zones on the chart.
This tool displays areas where significant price reactions have occurred in the past and which still have the potential to influence future price movement by drawing colored bands.
Unlike classic support and resistance lines, this indicator presents levels as dynamic zones; zones that remain valid until liquidity is fully absorbed. If price has not yet touched these areas, their validity is preserved, and once price interacts with them, the probability of a market reaction in the form of a reversal or continuation increases.
For this reason, this indicator falls into the category of MetaTrader reversal indicators and is more suitable for traders with an intermediate skill level.
In terms of application, the Supply and Demand Zones indicator is compatible with all major markets, including Forex, cryptocurrency, equities, and the forward market, and delivers accurate performance for day trading styles as well as multi-timeframe analysis.
For example, in currency pairs, price reactions to supply zones are usually accompanied by the appearance of candles such as bearish Doji, which can provide a suitable signal for entering Sell trades.
Conversely, price interaction with a demand zone along with patterns such as a Bullish Engulfing can set the stage for Buy trades.
In the settings, traders can fully control the display of support and resistance zones, distinguish touched from untouched areas, remove overlapping zones, and customize colors for different market cycles, allowing the indicator to adapt to various strategies.
Overall, the Supply and Demand Zones indicator in MetaTrader is a powerful tool for identifying reversal levels, refining entries and exits, and understanding market liquidity structure; when used correctly with price action, it can significantly improve trading accuracy.
Conclusion
In Smart Money Concepts (SMC), supply and demand form the foundation of price movements in financial markets. Supply and demand zones are critical chart areas that determine trend direction and provide trading opportunities.
Supply Zone represents high selling pressure, leading to price declines. These zones typically appear in downtrends following a BOS or CHOCH.
Demand Zone represents high buying pressure, leading to price increases. These zones typically appear in uptrends.


