


- TradingFinder
- Education
- Forex Education
- Technical analysis Education
Technical analysis Education
Technical analysis is a method for evaluating price movements in financial markets, emphasizing price charts, chart patterns, trends, trading volume, and indicators. Unlike fundamental analysis, which assesses an asset’s intrinsic value based on economic and financial factors, technical analysis relies on historical price behavior and structured patterns to identify high-probability trading opportunities. Classical technical analysis tools include trendlines, support and resistance levels, price channels, oscillators, and momentum indicators. These tools assist traders in defining market direction, measuring trend strength, and pinpointing precise entry and exit points. Modern technical analysis extends beyond conventional tools, incorporating market structure, liquidity dynamics, and order flow. Advanced methodologies such as price action, the Smart Money Concept (SMC), Inner Circle Trader (ICT) strategies, harmonic patterns, Elliott Waves, and the Read the Market (RTM) approach enable traders to identify institutional liquidity zones, track price manipulation, and refine execution strategies with greater accuracy. TradingFinder offers a comprehensive suite of educational content and analytical tools, bridging classical and modern technical analysis. It equips traders with specialized insights into liquidity models, market structure interpretation, and price movement assessments, enhancing their ability to navigate complex market conditions.
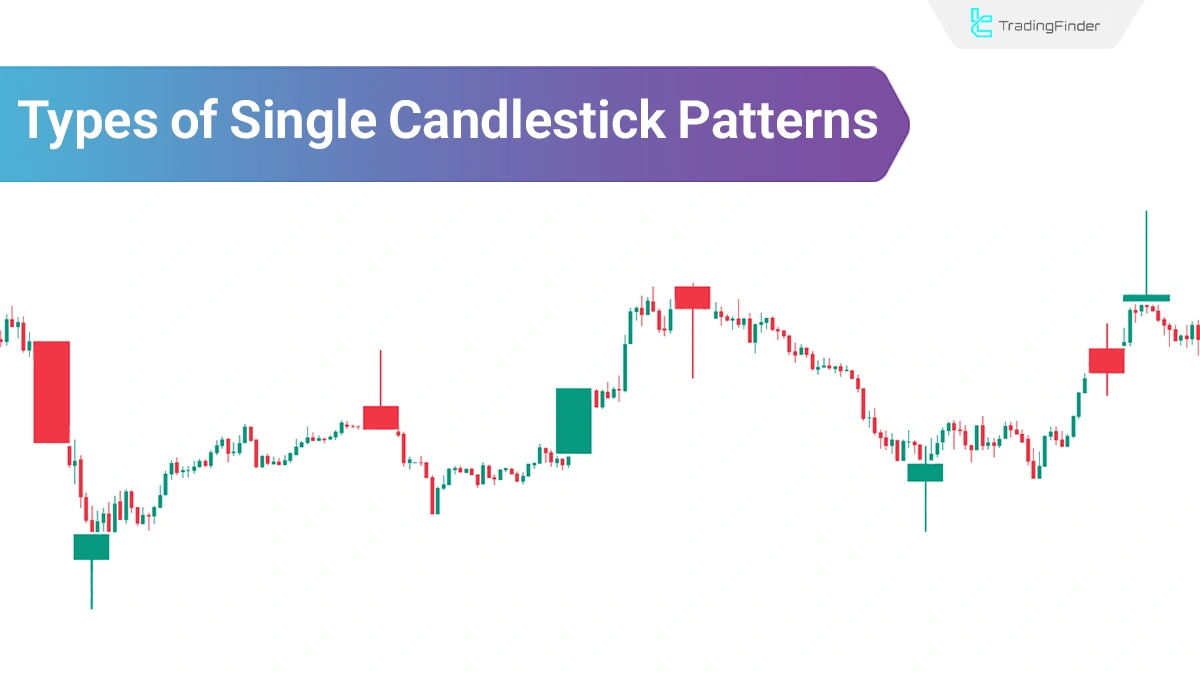
Single Candlestick Patterns Explained: Bullish & Bearish (Beginner Guide)
Single candlestick patterns are recognized as basic yet impactful tools in technical analysis, and with the formation of just one...
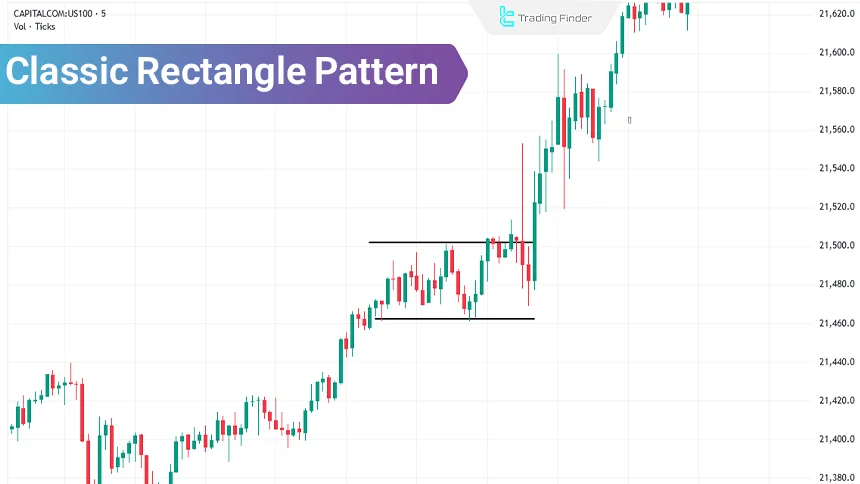
Classic Rectangle Pattern - Trading Strategy Using the Classic Range Pattern
The classic rectangle pattern represents market indecision and an equal balance between buyers and sellers. As a result, this...
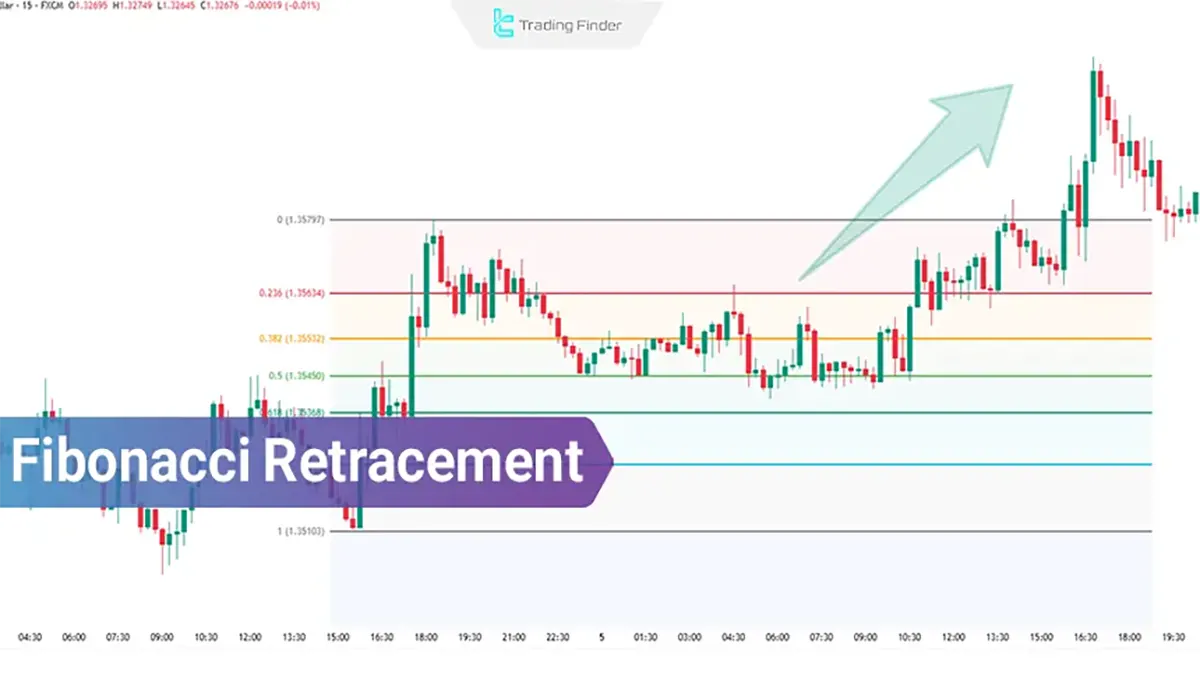
Fibonacci Retracement; Using Fibonacci Retracement in Trading
In technical analysis, various tools and patterns are used to identify price reversal zones, determine entry and exit points, and...
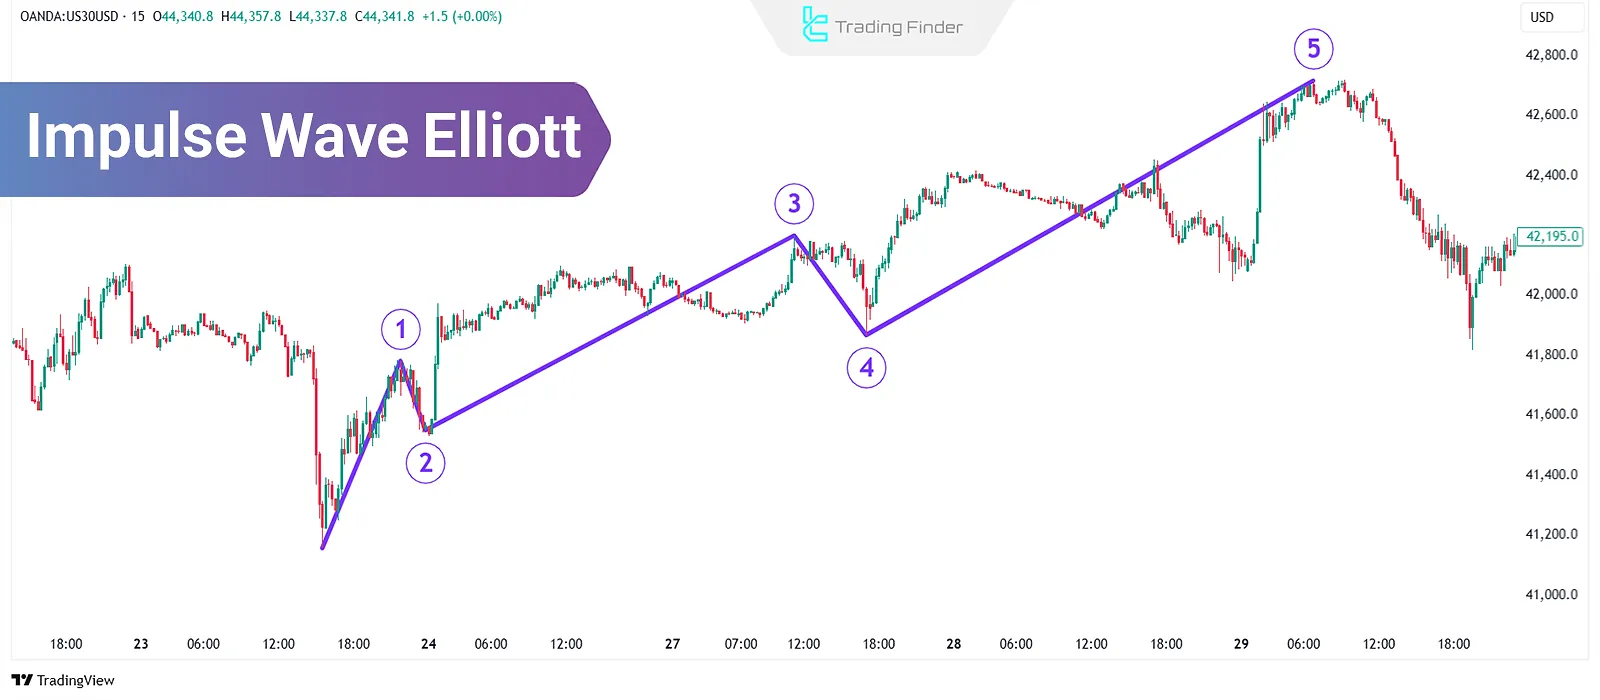
Elliott Impulse Wave Explained: Terminal vs Trending Impulse Structures
Impulse Wave Elliott (also called Elliott impulse waves) represent the basic structure of price movement in the market and act as...
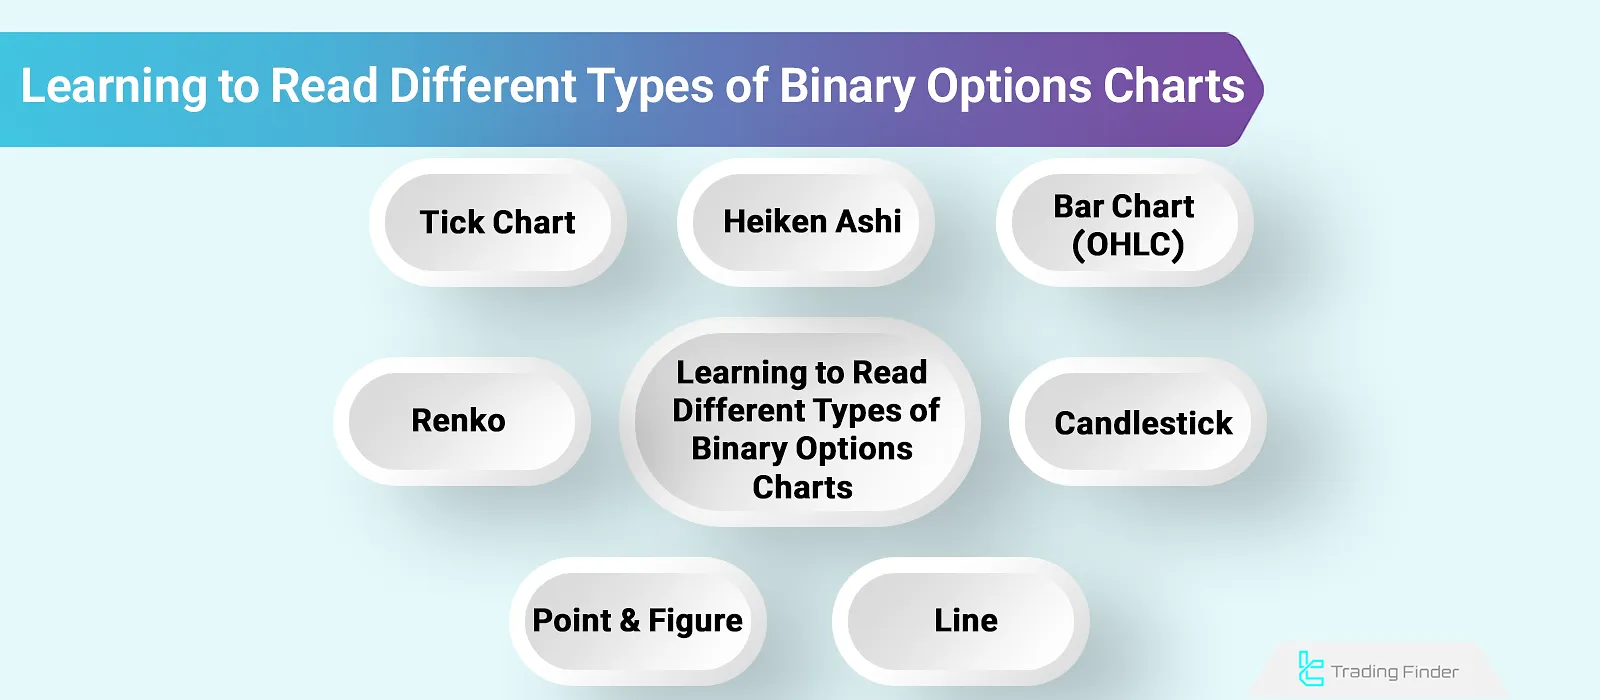
Types of Binary Options Charts (Line, Bar, Heikin Ashi, Tick, and Renko)
In binary options trading, entry and exit timing has a direct impact on profit and loss. Since the trade outcome is simply yes...
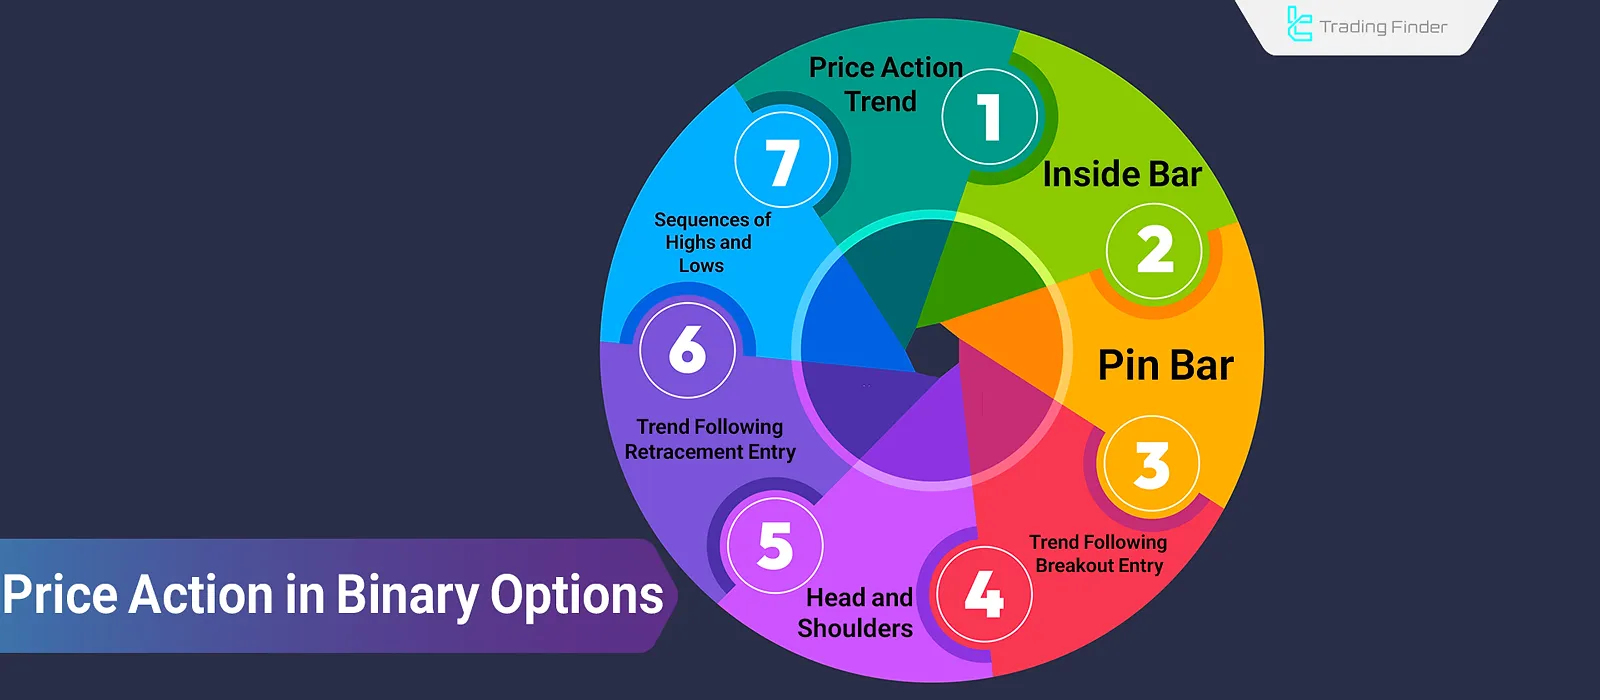
The Best Price Action Strategies in Binary Options; No Delay in Signal Generation
Price action, by directly analyzing price behavior without using lagging indicators, holds a significant position in binary options...
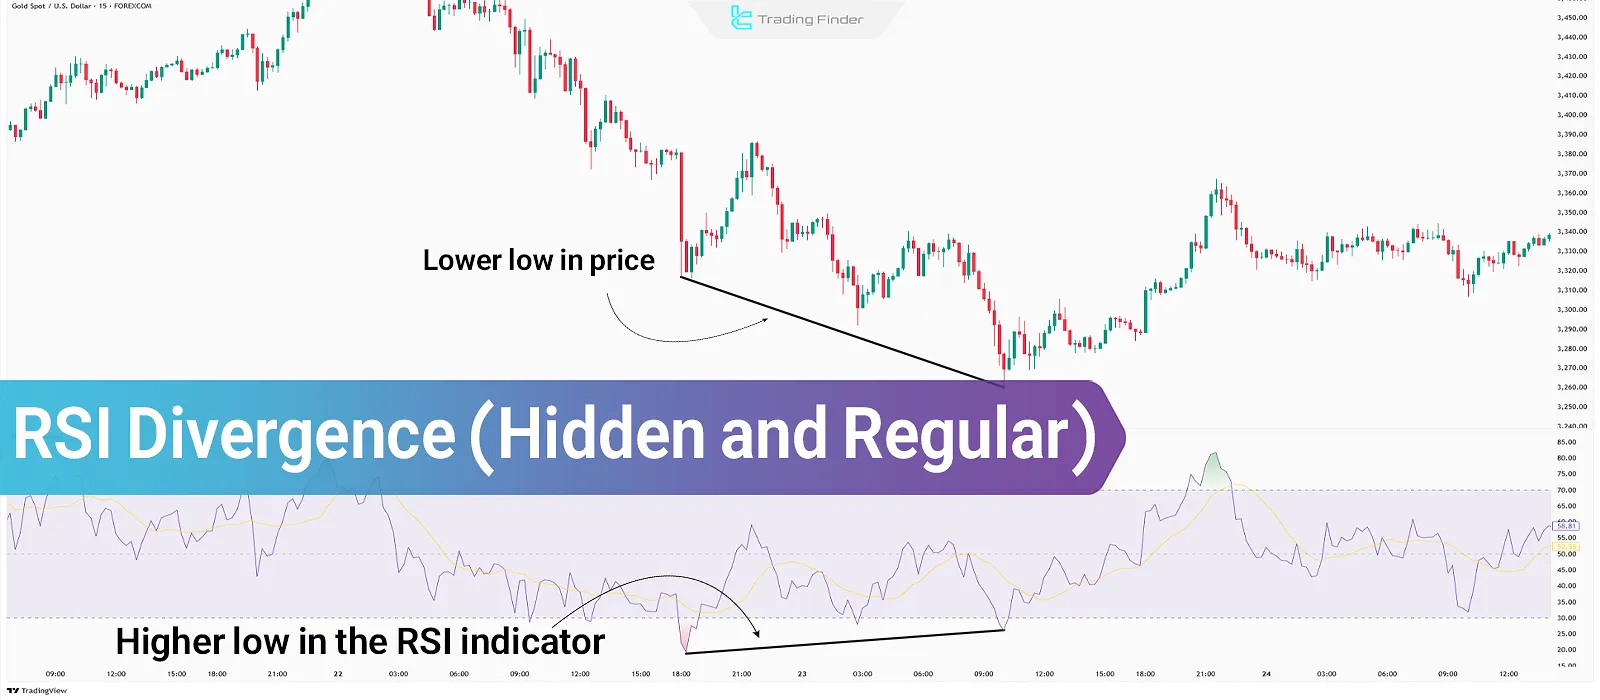
Learn RSI Divergence: Hidden & Regular Divergence
RSI Divergence is a tool for identifying potential price reversal points in the market. Detecting RSI Divergence is one of the...
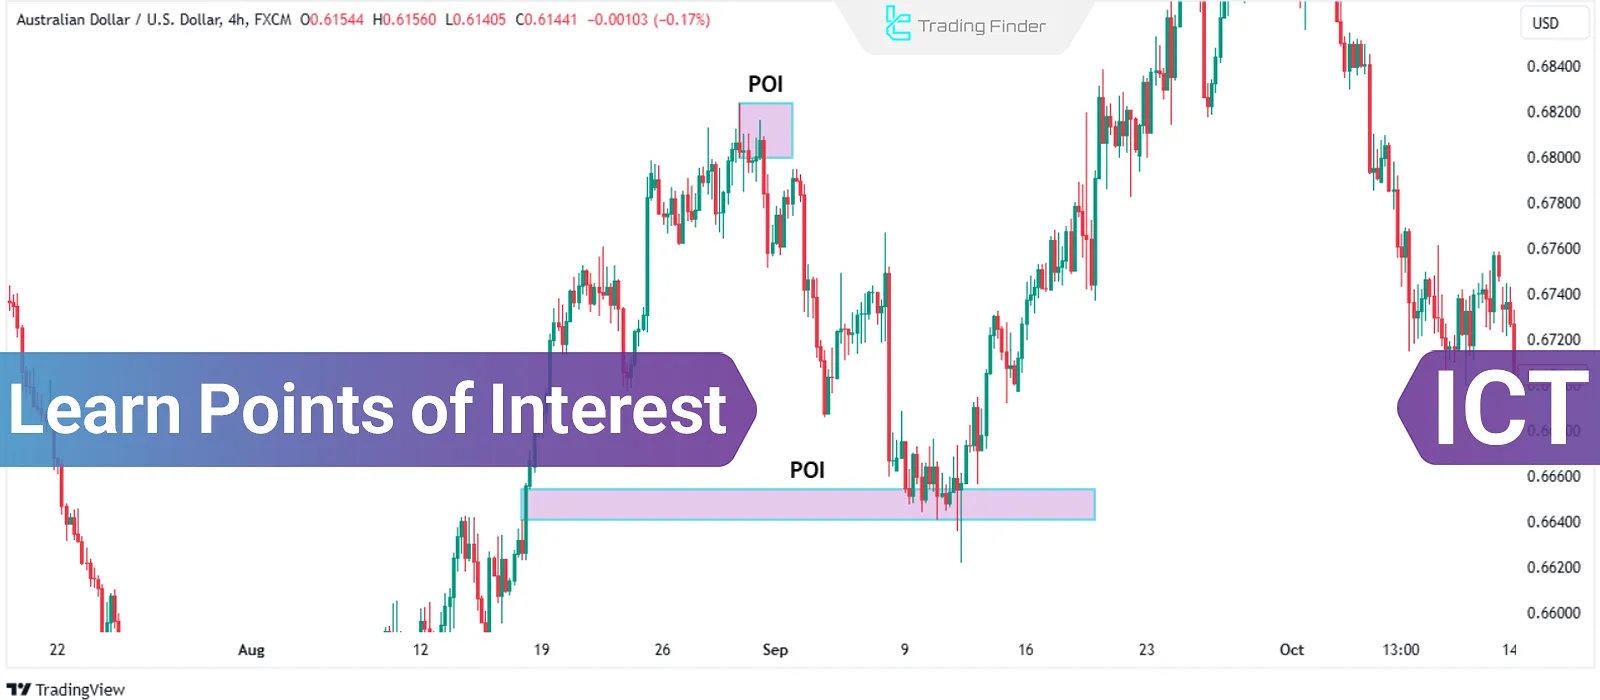
Learn the Concept of POI in ICT– Entering a Trade Using Points of Interest (POI)
In financial market analysis using the ICT style, Points of Interest (POI) in higher timeframes are used to analyze the ongoing...
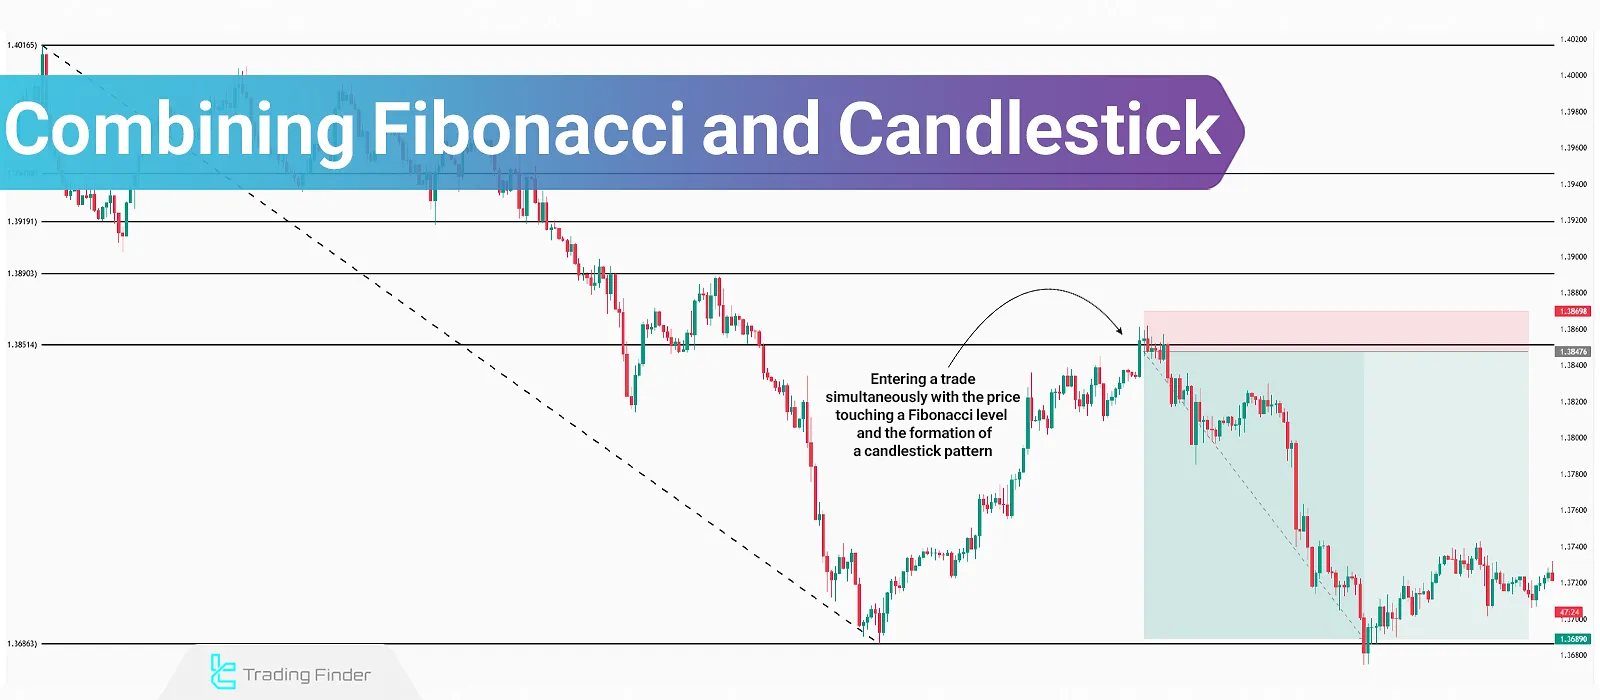
Combining Fibonacci and Candlestick – Best Candlestick Patterns for Fibonacci
The Fibonacci tool offers high compatibility with other technical analysis concepts such as support and resistance, classic...
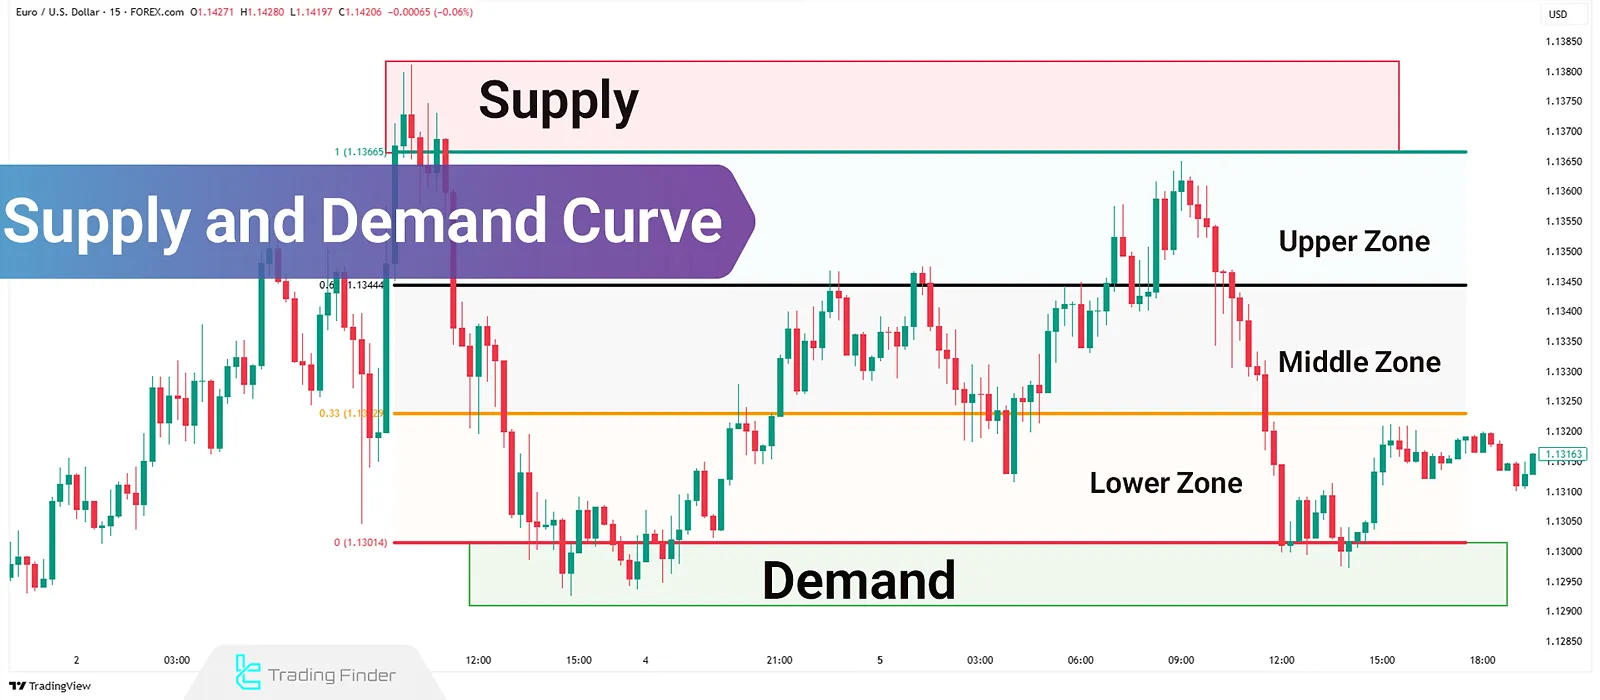
Supply and Demand Curve Training: Trading Setups and Manual/Fibonacci Plotting
When analyzing supply and demand zones in technical analysis, identifying them is not enough; understanding the current price...
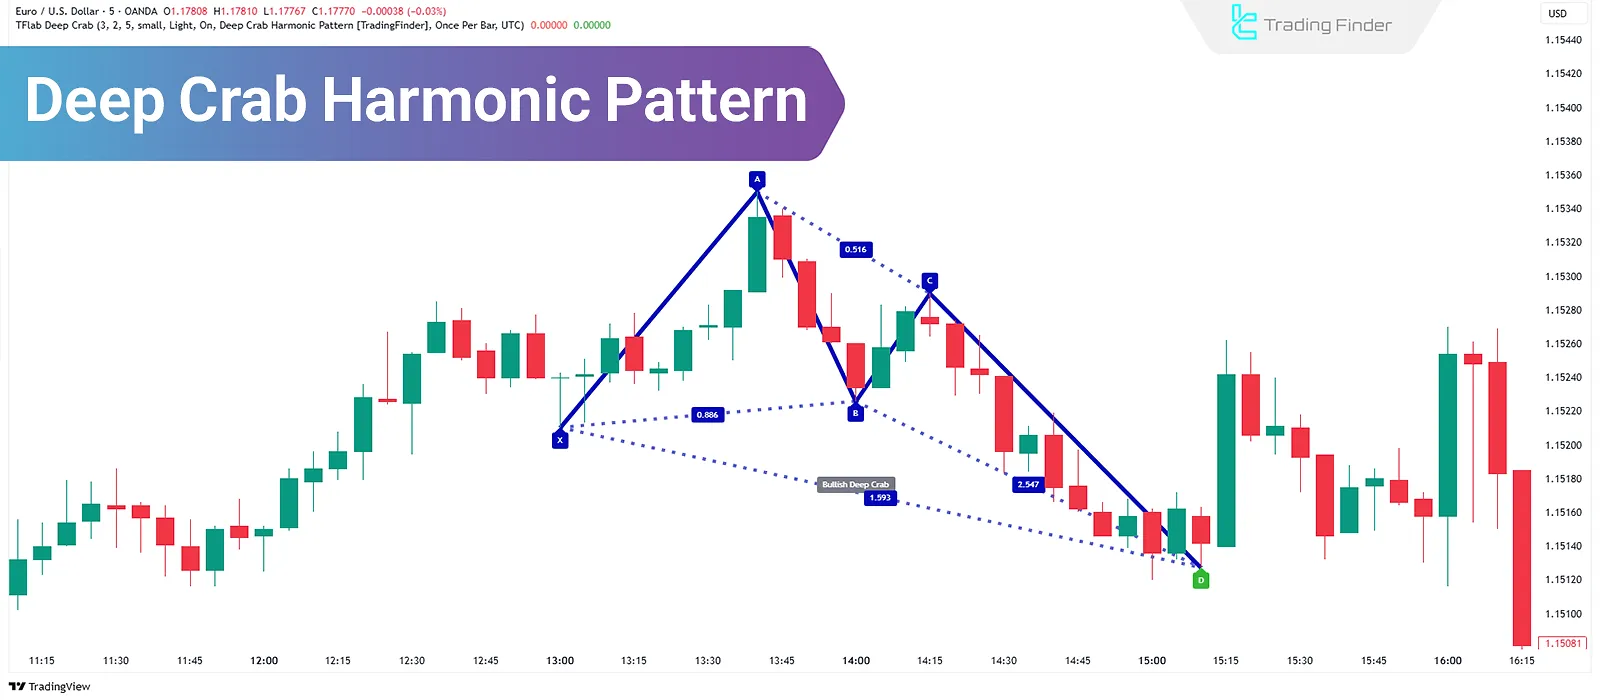
What is the Deep Crab Pattern? – Guide to Trading the Harmonic Deep Crab Pattern
Harmonic pattern traders use the Deep Crab Pattern to anticipate price reversals. By calculating and identifying points B, A, X,...
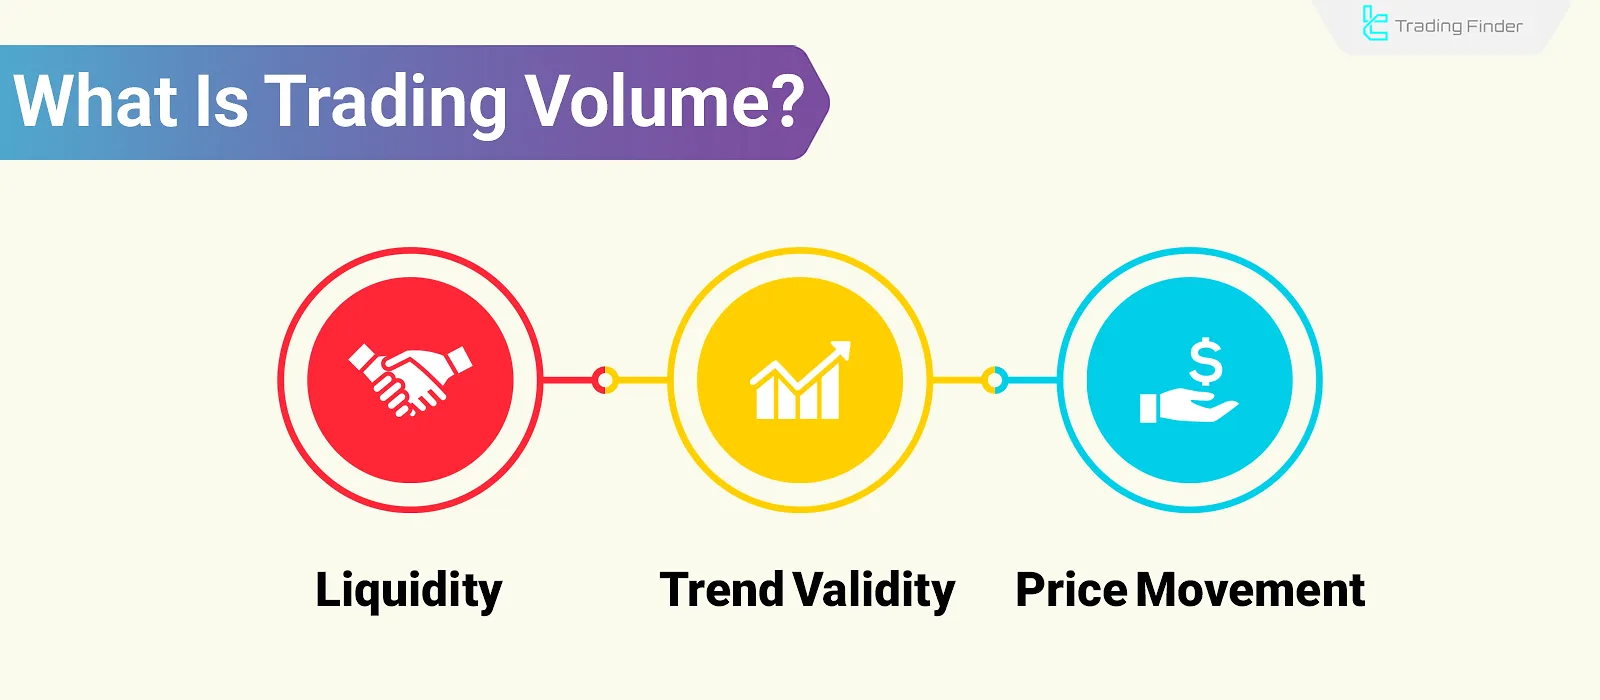
What Is Trading Volume? 9 Indicators for Market Volume Analysis
Trading volume in financial markets is considered a benchmark for assessing liquidity, price momentum, and the validity of ongoing...


